Executive Summary
The global technology upcycle and higher energy prices amid conflicts in the Middle East have accelerated import growth across ASEAN, putting pressure on the trade balances of Indonesia, the Philippines, and Vietnam. However, trade deficits do not necessarily indicate economic vulnerability, provided that most imports are capital and intermediate goods that support production and investment, generate value added in exports, which would help improve trade balances in the next period.
Although all three countries face common external pressures from higher energy prices and the global technology upcycle, their trade balance trends and the linkages between production and investment differ according to their respective economic and trade structures. Whether current trade deficits reflect underlying vulnerabilities or are instead part of an investment-driven process that strengthens their potential in the coming period.
Introduction
The current technology upcycle has become a key driver of ASEAN’s economic growth, through exports of technology products and investment in related industries, including electronics, semiconductors, and data centers. However, production and investment in these industries rely heavily on imported raw materials and capital goods, which has accelerated ASEAN’s imports.
Meanwhile, oil import costs remain elevated amid ongoing tensions in the Middle East. These factors have placed further pressure on trade balances, particularly in energy-importing economies, weakening the trade balances across the region and pushing some into trade deficits.
Nonetheless, a trade deficit does not necessarily indicate economic vulnerability, as its implications vary across countries depending on the drivers and composition of imports; deficit
driven by imports of consumer goods and energy carries different implications from one driven by capital goods imports to support production and investment, which may expand productive capacity and create value added over time.
This article examines changes in the trade balances of Indonesia, the Philippines, and Vietnam from these angles: 1) differences in economic and trade structures, 2) the key factors driving changes in goods trade balances, and 3) the linkages between imports, domestic investment, and foreign direct investment (FDI). The analysis aims to assess the implications of trade deficits for investment and production capacity in each country.
Differences in Economic and Trade Structures
Trade balances generally follow different trends across countries, depending on their economic and trade structures. Indonesia and the Philippines rely mainly on domestic demand, particularly in the Philippines, where private consumption accounts for as much as 76.4% of Gross Domestic Product (GDP).
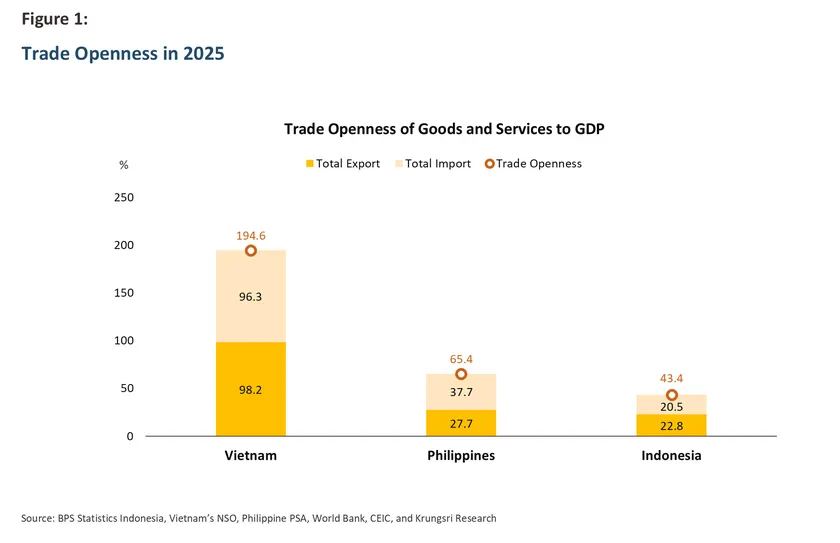
1/ In contrast, Vietnam is significantly more export-oriented, with exports accounting for more than 90% of GDP, compared with just 27.7% in the Philippines and 22.8% in Indonesia (Figure 1).
In addition, the role of investment also varies across these countries. Gross fixed capital formation (GFCF) as a share of GDP is higher in Indonesia and Vietnam than in the Philippines (Table 1). Vietnam also relies on foreign direct investment (FDI) far more than the other two countries, particularly in the manufacturing sector.
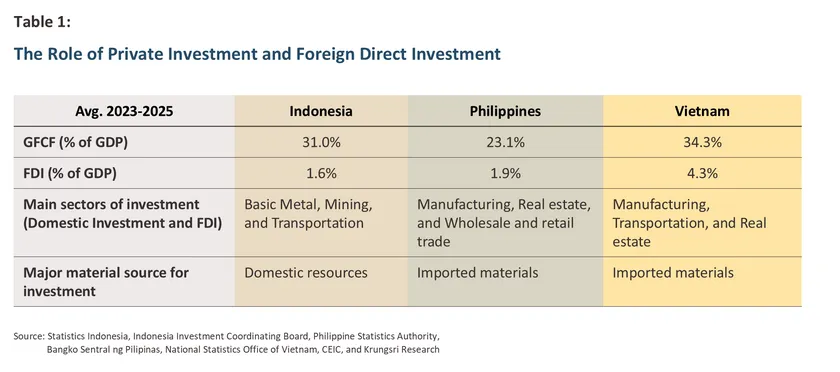
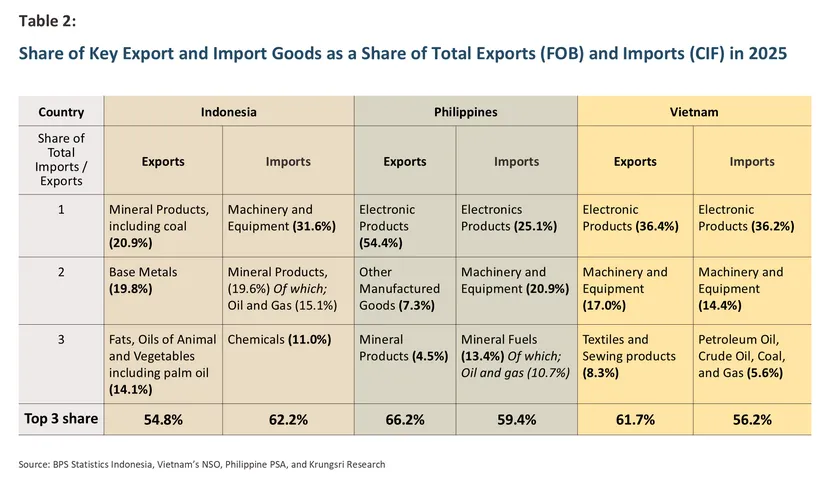
These structural differences, together with the three countries’ diverse natural resource endowments, shape export structures that reflect distinct production bases. Indonesia exports are dominated by commodities and resource-based products2/—notably coal, palm oil, and mineral and metal products—which accounted for approximately 54.8% of total export value in 2025. While electronics are the main exports for the Philippines and Vietnam, accounting for 54.4% and 36.4% of their respective total export values (Table 2).
The main import categories also differ somewhat, machinery and equipment, which are classified as capital goods, account for the largest share of Indonesia’s imports. Meanwhile, the Philippines and Vietnam primarily import electronics as intermediate goods for manufacturing, followed by machinery and equipment. One common feature, however, is their reliance on imported oil and gas. Higher energy prices amid the Middle East conflicts have therefore placed upward pressure on import costs in all three.
Key Factors Driving Changes in Trade Balances
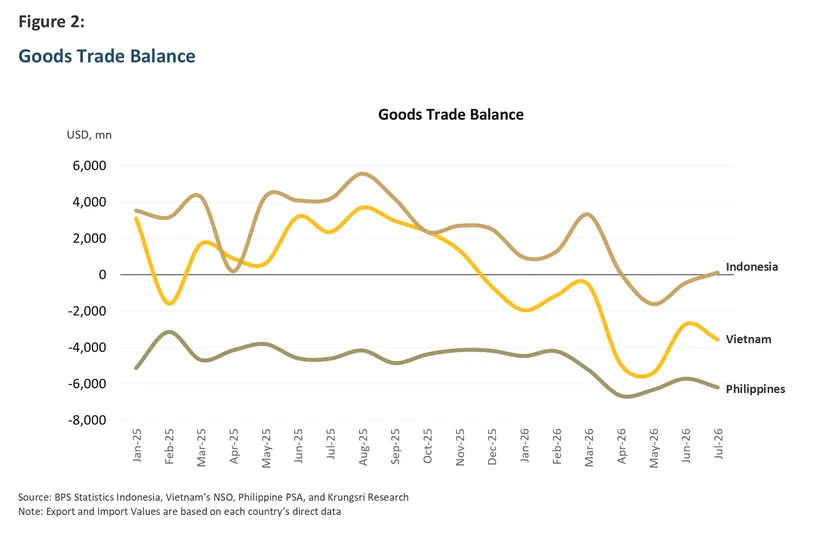
Trade balances from January 2025 to July 2026 shows that the Philippines has consistently recorded a trade deficit, while Indonesia and Vietnam moved into deficit in 2026 (Figure 2). This deterioration has been driven by two main factors: 1) higher energy prices following the conflicts in the Middle East, and 2) the global technology upcycle, which has accelerated imports of goods used in the production of electronics.
1. Higher Energy Prices
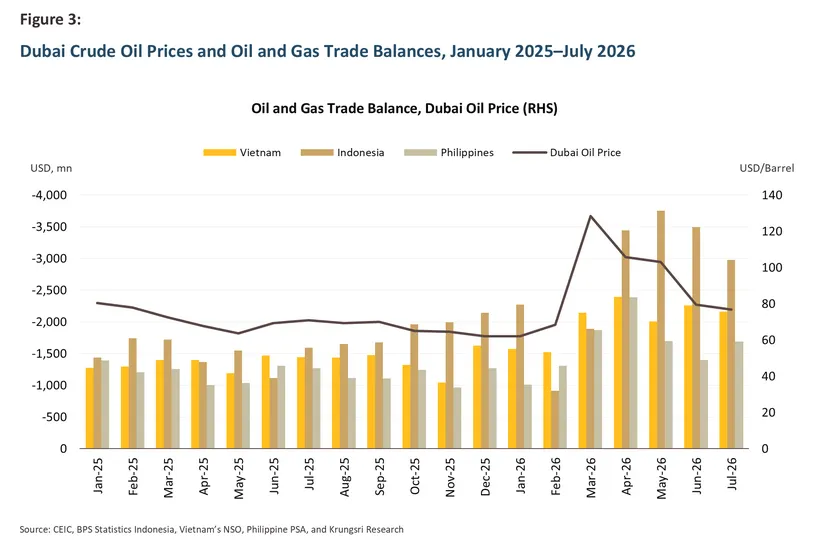
The Middle East conflicts have driven up global energy prices. As net importers of oil and gas, all three economies have consequently recorded significantly larger oil and gas trade deficits during the first seven months of 2026 (Figure 3). Indonesia’s cumulative deficit was larger than those of Vietnam and the Philippines, reflecting its larger economy and greater reliance on energy, which translate into substantially higher import volumes. If global oil prices remain elevated, import costs for these products will continue to weigh on the trade balances of all three economies.
2. Global Technology Upcycle
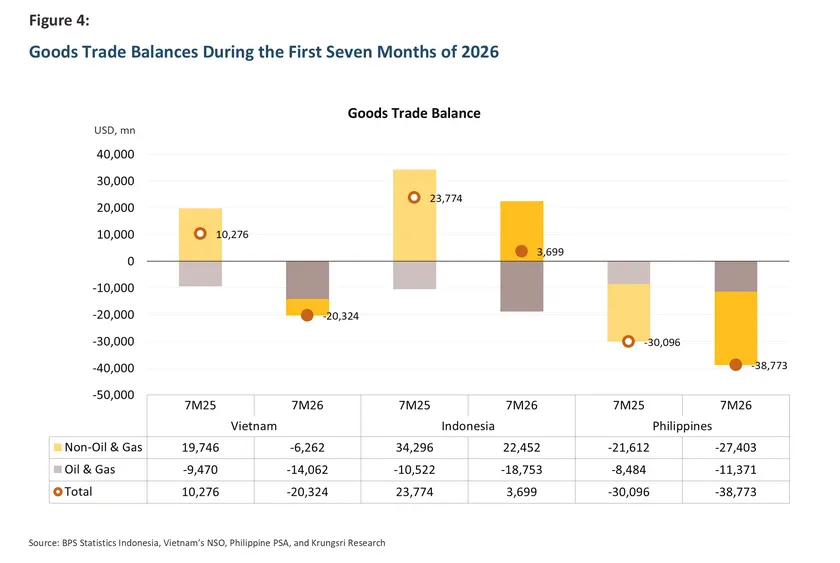
At the same time, although non-oil and gas exports have expanded in all three economies, imports of technology-related goods have grown at a faster pace, putting pressure on their non-oil and gas trade balances. Indonesia’s surplus narrowed from a year earlier, Vietnam shifted from a surplus to a deficit over the same period, while the Philippines recorded a widening deficit (Figure 4). However, the factors weighing on each economy’s trade balance differ:
-
Vietnam and the Philippines: The increase in imports has been driven largely by electronics, reflecting their export-oriented manufacturing structures, which rely heavily on imported components and intermediate goods. As a result, imports in both economies have expanded alongside exports amid the global technology upcycle.
-
Indonesia: The rise in imports comes mostly from machinery and equipment, reflecting domestic investment in fixed assets. Unlike in the other two countries, this trend has not been accompanied by a corresponding increase in exports, as Indonesia’s exports are more heavily influenced by commodity cycles and domestic policies.
Linkages Between Trade Balances and Investment
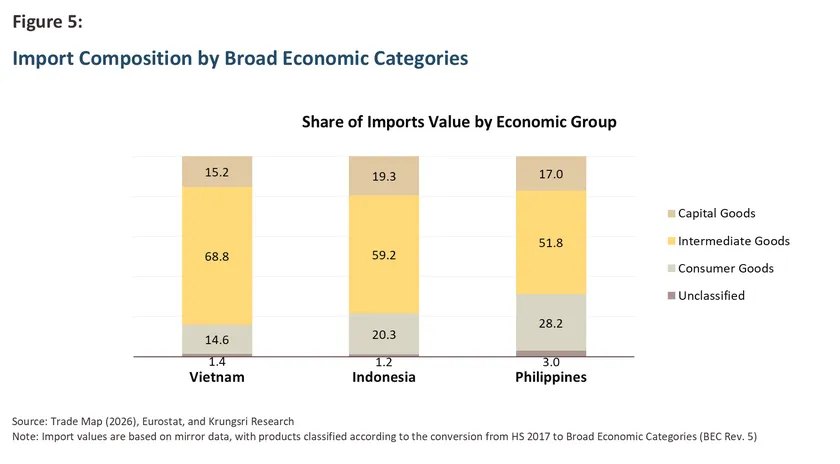
Accelerating imports put pressure on trade balances, they do not necessarily indicate economic vulnerability, particularly when most imports are composed of capital goods and intermediate goods used to support production and investment. These two categories account for more than 80% of total import value in Vietnam and Indonesia, and 69% in the Philippines (Figure 5).
Of the two, capital goods are more directly relevant to investment, as their imports potentially reflect capital accumulation and the expansion of domestic production capacity.
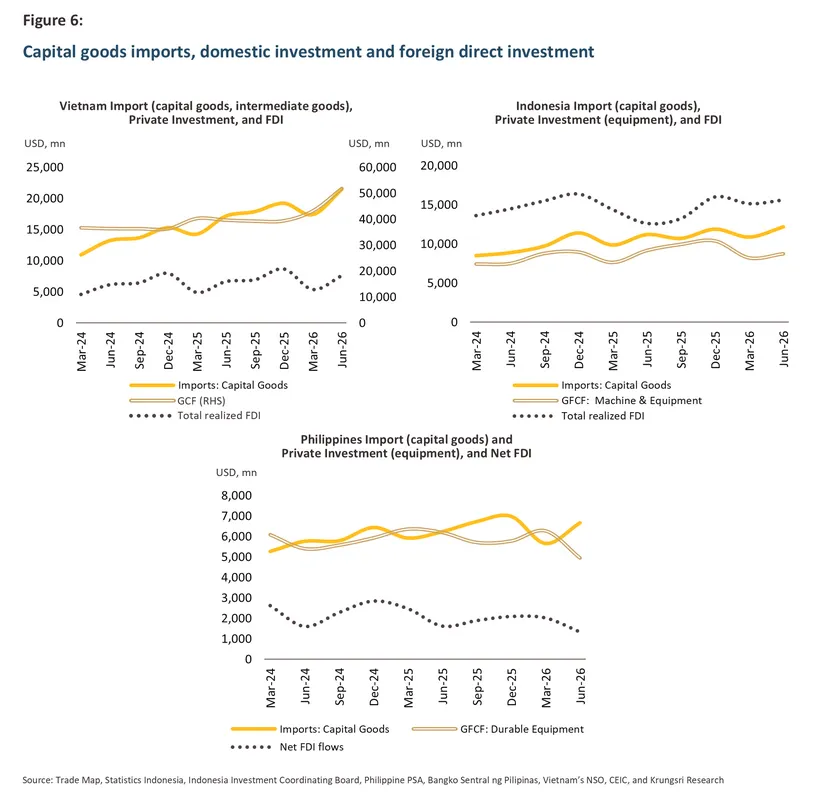
An examination of the relationship between capital goods imports and investment3/ reveals significant differences across the three economies. In Indonesia, changes in capital goods imports are significantly correlated with changes in domestic investment in machinery and equipment (Gross Fixed Capital Formation (GFCF): Machinery and Equipment).4/ In Vietnam, changes in capital goods imports are correlated with changes in foreign direct investment (FDI).5/ (Figure 6)
On the other hand, no statistically significant relationship is found in the Philippines between capital goods imports and either investment in durable equipment (GFCF: Durable Equipment) or net FDI flows. Moreover, investment in durable equipment and net FDI flows have both shown signs of slowing since late 2025, amid corruption issues in public-sector projects that have undermined investor confidence. This suggests that the increase in capital goods imports has yet to translate into actual investment to the same extent as in Vietnam and Indonesia.
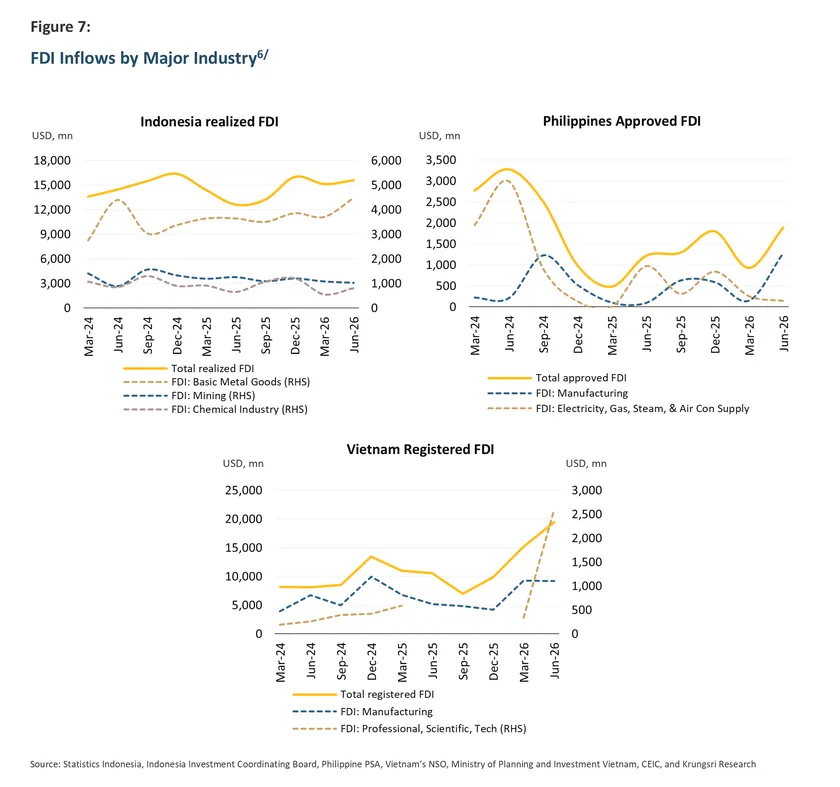
Aggregate investment figures do not reveal which sectors receive these investment flows, which carries different implications for production capacity and trade. Given the limited availability of domestic investment data by industry, this analysis uses FDI by industry as an indicator of investment trends and their linkages with each economy’s trade structure (Figure 7), as follows:
In Indonesia, investment remains largely concentrated in basic metals and mining, reflecting the role of natural resource-based industries in attracting FDI. In the Philippines, FDI flows primarily into manufacturing, followed by the electricity, gas, steam, and air-conditioning supply sector. Meanwhile, in Vietnam, FDI continues to be concentrated mainly in manufacturing, particularly export-oriented production. Investment in scientific and technological activities has also shown an upward trend, reflecting the growing role of advanced manufacturing and innovation.
Krungsri Research View
Indonesia, the Philippines, and Vietnam face common external factors, namely higher energy prices and the technology upcycle, but the effects on their trade balances and the extent to which these translate into investment to strengthen production capacity and trade competitiveness vary according to each economy’s economic and trade structure. Key observations are as follows:
-
Impact of oil and gas imports on trade balances: Although oil and gas account for as much as 15.1% of Indonesia’s total imports, a higher share than in the Philippines and Vietnam (10.7% and 5.6%, respectively, as shown in Table 1), Indonesia faces comparatively less pressure from rising energy costs. This is partly because it has a substantial production and export base in fuels, particularly coal, which helps offset some of the impact of higher imported energy costs.
-
Impact of the global technology upcycle:
-
Impact on trade balances: Technology exports from Vietnam and the Philippines have grown more slowly than their imports, limiting the positive contribution to their goods trade balances. However, if imports consist largely of capital goods that generate value added to exports, they could help improve trade balances in the next period. Meanwhile, Indonesia’s exports remain primarily resource-based, while the increase in imports has been driven largely by machinery and equipment.
-
Implications for trade and investment in technology-related industries: Differences in export structures mean that the three countries benefit from technology cycle through different channels. Vietnam and the Philippines stand to gain directly through electronics exports, while Indonesia is more likely to benefit from investment related to the digital economy, particularly data centers. Such investment is supported by its large domestic market, rather than its role as an export base for electronics manufacturing.
-
Linkages between imports and investment: ASEAN is an important manufacturing base in global supply chains and rely heavily on imported capital goods and intermediate goods. In Indonesia and Vietnam, capital goods imports have shown a relatively clear relationship with the expansion of domestic investment (Figure 6). No such relationship is evident in the Philippines, where the investment has been distorted and undermined by corruption issues in public-sector projects. Vietnam also has a more prominent role for FDI in manufacturing than the other two countries, reflecting its stronger integration into global supply chains (Figure 7). Whereas Indonesia’s capital goods imports are primarily used to support resource-based production and meet domestic demand.
Overall, Vietnam and the Philippines have benefited more visibly than Indonesia from the global technology upcycle through stronger technology exports. Both nevertheless remain heavily dependent on imported raw materials and intermediate goods, which may continue to weigh on their trade balances. The trajectory of the trade balance for these goods, as well as the linkages between trade, domestic production, and investment, therefore remain a key issue to monitor. In particular, it remains to be seen whether the two countries can reduce their import dependence by concurrently supporting domestic economic activity and exports. This will be key to determining whether their current goods trade deficits reflect underlying vulnerabilities or are instead part of an investment-driven process that strengthens their economic potential in the coming period.
References
Ministry of Investment and Downstream Industry. (2025). Press Release Investment Realization January – December 2024.
Ministry of Investment and Downstream Industry. (2026). Press Release Investment Realization First Quarter (January –March) of 2026.
Ministry of Investment and Downstream Industry. (2026). Press Release Investment Realization Performance January - December 2025.
Philippines Statistics Authority. (n.d.). Approved Investment. Retrieved from https://psa.gov.ph/statistics/foreign-investments
Publications Office of the European Union. (n.d.). Eurostat statistical classifications. Retrieved from https://op.europa.eu/en/web/eu-vocabularies/eurostat?nstoken=7SOY%2FFbMog3%2FTQb%2Ffodzv9w1V8LxlS8OTFmsqY3NouAHkThOMV%2F%2Bf9OfldJ1%2F3qC2QjvvoqmJfl0vOYkIBHS3%2F%2FIbZEC%2FnO3NIwUP6yeWxwbu8f5b7rTJgfrdUs0bhb0YLC7gTdU6FsTGU63uCFNRCNSRYYHGvbyWTkFqj30oNFYp9A9
Statistics Indonesia. (n.d.). Economic statistics. Retrieved from https://www.bps.go.id/en/statistics-table?subject=530
Vietnam National Statistics Office. (n.d.). Investment and construction. Retrieved from National Statistics Office: https://www.nso.gov.vn/en/investment-and-construction/
1/ In 2025, private consumption accounted for 55.2%, 76.4%, and 53.2% of GDP in Indonesia, the Philippines, and Vietnam, respectively.
2/ Under the Downstreaming Strategy, a national economic policy that restricts exports of key raw commodities while promoting domestic processing and manufacturing for export, with the aim of generating greater economic value added. using a two-tailed test at the 5% significance level. Due to data limitations, Gross Capital Formation (GCF) is used as a proxy for GFCF for Vietnam,
3/ The analysis uses Pearson correlation coefficients to examine the relationship between quarterly changes in capital goods import values and changes in domestic investment (GFCF) and foreign direct investment (FDI), based on data from Q1 2021 to Q2 2026 (n = 21). Statistical significance is tested for which quarterly GFCF data are unavailable, and net FDI flows are used in place of realized FDI for the Philippines.
4/ R-squared = 0.91, p-value < 0.001
5/ R-squared = 0.66, p-value = 0.001
6/ Approved FDI data are used for the Philippines, while registered FDI data are used for Vietnam, as realized FDI data by industry are not available.