Survey Background and Objectives
Over the past decade, Thailand’s family structure has undergone a significant transformation. The traditional model of a nuclear family—comprising parents and children—has increasingly given way to more diverse living arrangements and lifestyles.
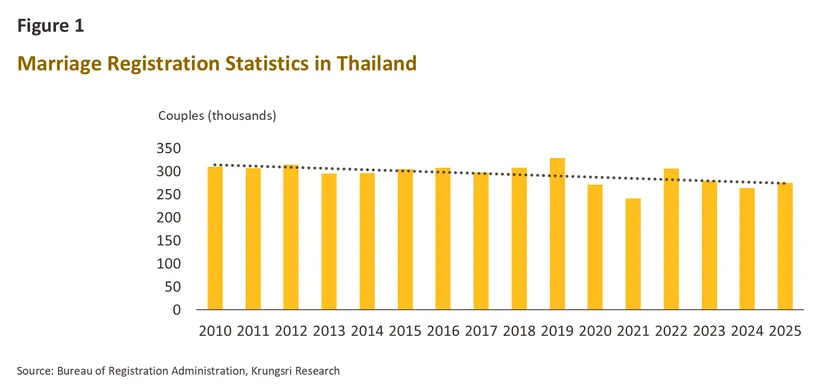
Data from the Department of Provincial Administration show that the number of registered marriages in 2025 stood at only 275,659 couples, down from an average of around 307,000 per year in the decade prior to the COVID-19 pandemic (Figure 1). Moreover, 2025 marked the fifth consecutive year in which the number of deaths in Thailand exceeded the number of births.
1/
These structural shifts are not coincidental. Rather, they reflect evolving social values, economic and societal constraints, and the complex decision-making processes faced by individuals across different life stages.
As more people in Thai society—particularly younger generations—begin to view the traditional nuclear family as no longer a primary life goal, urban lifestyles associated with the “Single Economy” are becoming increasingly prominent. This consumer segment demonstrates distinct preferences across housing, goods and services, food, entertainment, and financial products—seeking solutions that offer greater flexibility and convenience in daily life. In response to this shift, Krungsri Research conducted The Single Economy Survey to examine the behaviors and attitudes of both single individuals and those with families, spanning from early working age to retirement. The study aims to better understand differences in lifestyles and needs between these two groups. The survey targeted urban residents aged 24 and above and was conducted between November and December 2025. A total of 2,202 respondents participated via online channels. Findings from this dataset will be presented in a two-part report series:
- Part 1: The Single Economy: Life at Different Stages
- Part 2: The Single Economy: Exploring Solo Living Lifestyles
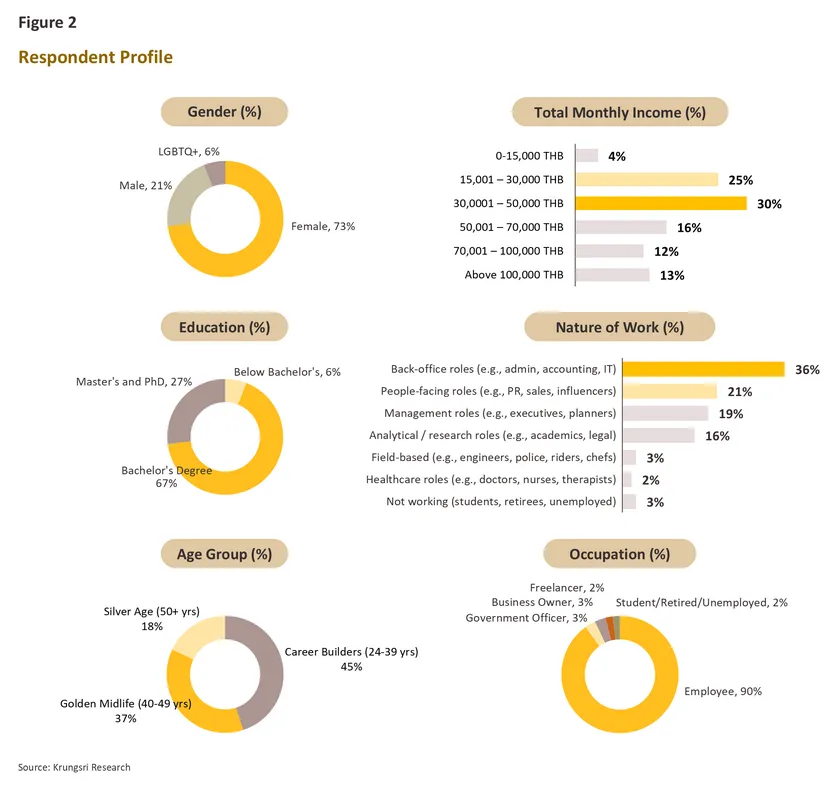
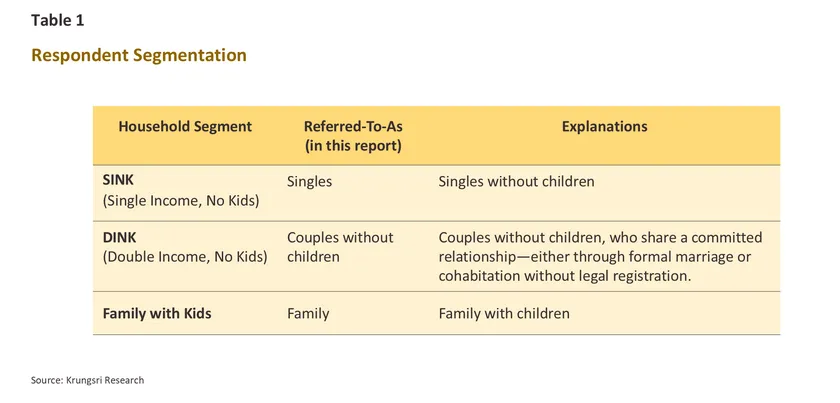
Respondent Profile
The largest share of respondents (41%) identified themselves as single. This was followed by those who are married, accounting for approximately 38% (including both registered and unregistered marriages). The remaining respondents consisted of individuals in a relationship but not married (17%), and those who are widowed or divorced (4%).
Female respondents represented a significant majority at 73%. In terms of age distribution, the largest group (45%) fell within the “Career Builders” segment, aged 24–39. This was followed by the “Golden Midlife” group, aged 40–49 (37%), and the “Silver Age” group, aged 50 and above (18%).
Two-thirds of respondents held a bachelor’s degree or equivalent, and 90% were full-time employees. More than half reported a monthly income of no more than THB 50,000, with the largest segment (30%) earning between THB 30,000 and 50,000 per month. Notably, over one-third of respondents worked in corporate support functions—such as accounting and IT—rather than front-facing roles.
Survey Results
1. On “Singlehood”
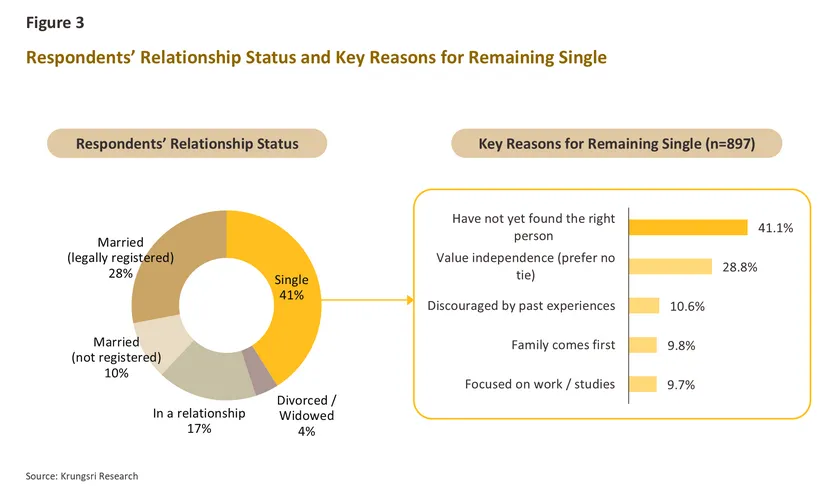
The survey found that
the largest share of respondents (41%) identified as single. A deeper look into the reasons behind singlehood reveals that 41% of singles reported that they
“have not yet found the right person.” This suggests that many in this group remain open to relationships but have yet to meet someone who meets their expectations.
Meanwhile, 28% of singles indicated that they choose to remain single because they
“value independence and prefer not to be tied down.” Other reasons include prioritizing family, focusing on career, and past disappointment in relationships, each accounting for a similar share of approximately 10–11%.
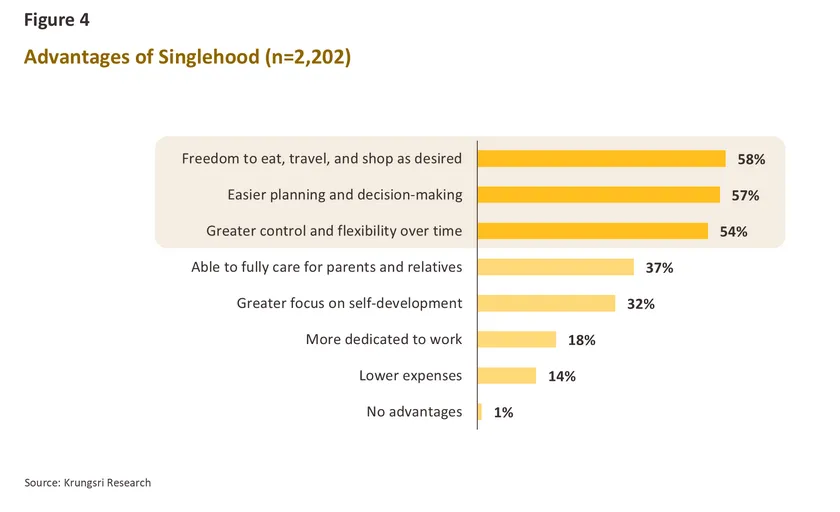
Advantages of Singlehood: Flexibility and Autonomy in Decision-Making
Across all respondent groups, there is strong consensus on the top three advantages of being single: (1) the ability to live freely—such as eating, traveling, and shopping as one wishes (58%); (2) greater ease in planning and decision-making (57%); and (3) more flexible and self-directed time management (54%).
Notably, nearly all respondents—regardless of their relationship status—recognized at least one benefit of singlehood, with only 1% indicating that being single offers no advantages at all.
However, perceptions of these benefits vary across life stages. Among singles in the “Career Builder” group (aged 24–39), 41%—a cohort that tends to prioritize career growth—view singlehood as enabling greater focus on self-development, significantly more than older single groups. In contrast, about half of singles aged 40 and above—who are more likely to have aging parents—see singlehood as allowing them to devote more time to caring for family members. This perspective is less prominent among younger singles, with only 38% of those aged 24–39 recognizing this benefit.
Among non-single respondents, including both DINK households and families with children, around 60% perceive singlehood as offering greater flexibility in personal time management. From their perspective, having a partner or family often entails increased responsibility and the need to allocate time with greater consideration for others.
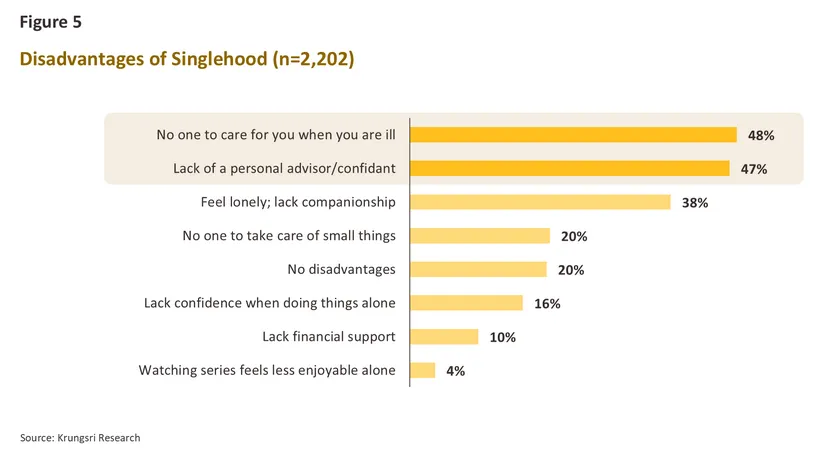
Disadvantages of Singlehood: Lack of Physical and Emotional Support
Across all respondent groups, the top three perceived disadvantages of singlehood are: (1) having no one to care for them when they are ill (48%), (2) lacking a personal advisor or confidant (47%), and (3) experiencing loneliness or a lack of companionship (38%). These findings highlight the importance respondents place on having both physical and emotional support—particularly in times of illness, when making decisions alone, and when facing the isolation that can accompany single living. In addition,
more than one in five respondents identified the absence of everyday care and attention as another drawback of being single.
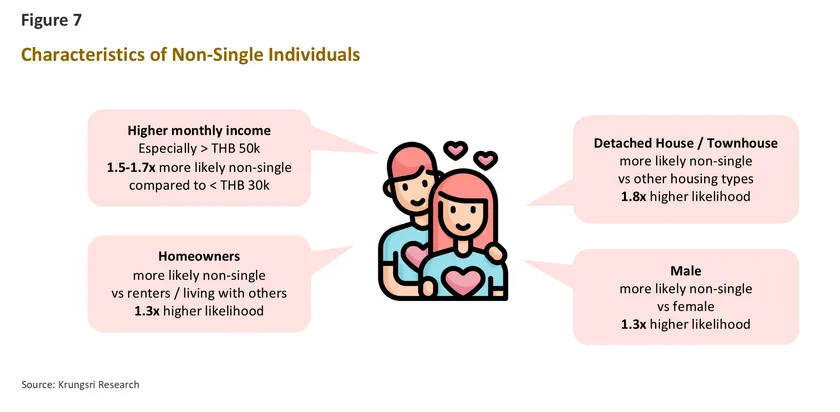
Econometric analysis provides further insight into perceptions of the financial implications of having a partner. Men in relationships are 1.5 times more likely than women in relationships to view singlehood as “less financially burdensome,” suggesting that men may perceive a greater increase in expenses associated with having a partner.
Moreover, the analysis indicates that the likelihood of perceiving singlehood as lacking financial support increases with age. This may reflect the expectations of older generations, who tend to rely more on mutual financial support within a partnership, whereas younger individuals may prefer to maintain financial independence and separate spending arrangements.2/
2. Single or Partnered: A Matter of Preference or Income?
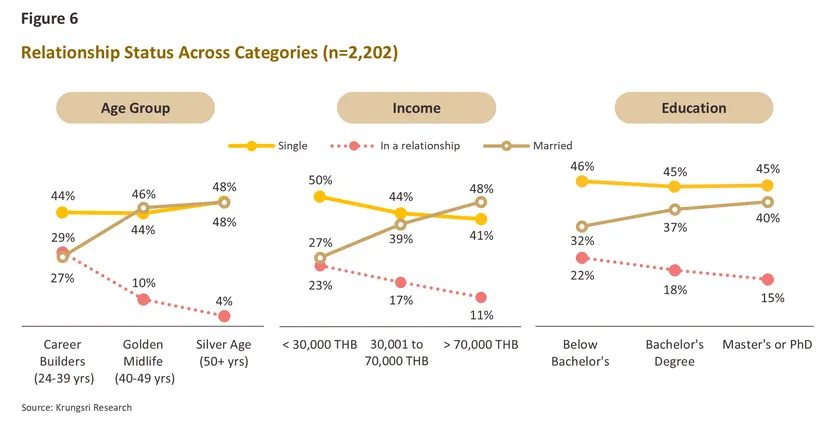
Econometric analysis further suggests that single individuals tend to view singlehood more positively than those in relationships. Specifically, singles are 2.2 times more likely than partnered individuals to perceive that “singlehood has no disadvantages.” This aligns with the finding that those in relationships are more likely to recognize the downsides of being single—such as lacking confidence when doing things alone, not having a personal confidant, and experiencing loneliness. These patterns indicate that perceptions of singlehood are influenced, at least in part, by one’s current relationship status.
Beyond perception, income also appears to play a role in shaping singlehood. As income increases, the proportion of single individuals declines significantly. Among those earning no more than THB 30,000 per month, around 50% are single, compared to 41% in the group earning more than THB 70,000. Further analysis of male respondents shows that the likelihood of being in a relationship increases with income, particularly among those in the middle- to high-income brackets.
3. Self-Care and Beauty
Self-Care Expenditure
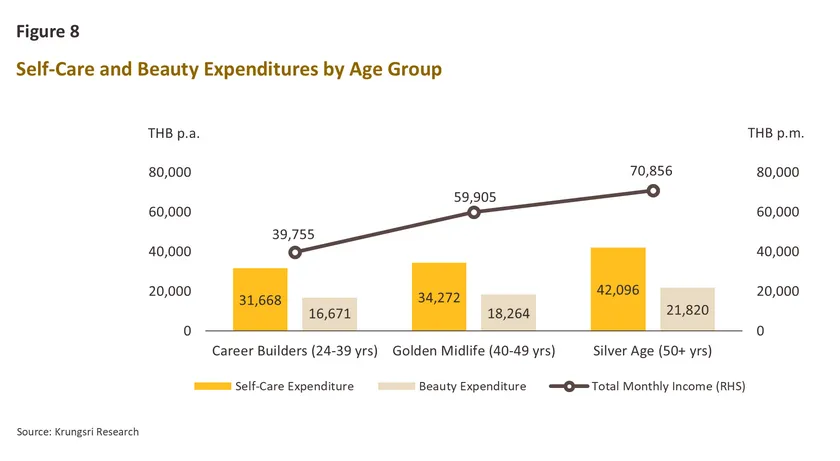
Single individuals spend approximately 8% of their income on self-care, including supplements, fitness, yoga, spa services, and sports equipment. Among them, those working in healthcare-related professions allocate the highest share, at around 9.4% of income. In comparison, family households spend only about 5% of their income on similar self-care activities. Across age groups, the “Silver Age” segment (50+) records the highest spending on self-care, averaging THB 42,096 per year. This is approximately 23% higher than the “Golden Midlife” group (aged 40–49) and 33% higher than the “Career Builder” group (aged 24–39), consistent with their relatively higher average income.
Econometric analysis further reveals that individuals in relationships but not yet married are about 1.4 times more likely to exercise regularly than both singles and married individuals. Around 30% of this group report going to the gym on a weekly basis, possibly reflecting stronger motivation or the use of fitness activities as a space for relationship-building. In contrast, among family households, female respondents are significantly less likely to exercise than males—highlighting the disproportionate burden of caregiving responsibilities, which may limit the time available for personal health management.
Beauty Expenditure
Survey results indicate that respondents who have undergone aesthetic procedures spend an average of THB 18,206 per year. Single individuals allocate around 4% of their income to such procedures, or an average of THB 20,156 annually. This figure increases by a further 4.8% among singles who do not intend to have children. Family households spend slightly less on aesthetic procedures, at around 3% of income or approximately THB 16,664 per year. Notably, 41% of respondents in this group have never undergone any aesthetic procedures—significantly higher than the 34% observed among singles.
By gender, LGBTQ+ singles report the highest average spending on aesthetic procedures at THB 21,932 per year—about 3.7% higher than female singles. In addition, singles with monthly incomes above THB 100,000 spend an average of THB 40,783 annually, with one-third of this group spending more than THB 50,000 per year. Across age groups, the “Silver Age” segment (50+) again records the highest spending, averaging THB 21,820 per year on aesthetic procedures. This spending increases by a further 11.3% among individuals in this age group who do not intend to have children.
4. Lifestyle Differences Between Single and Non-Single Individuals
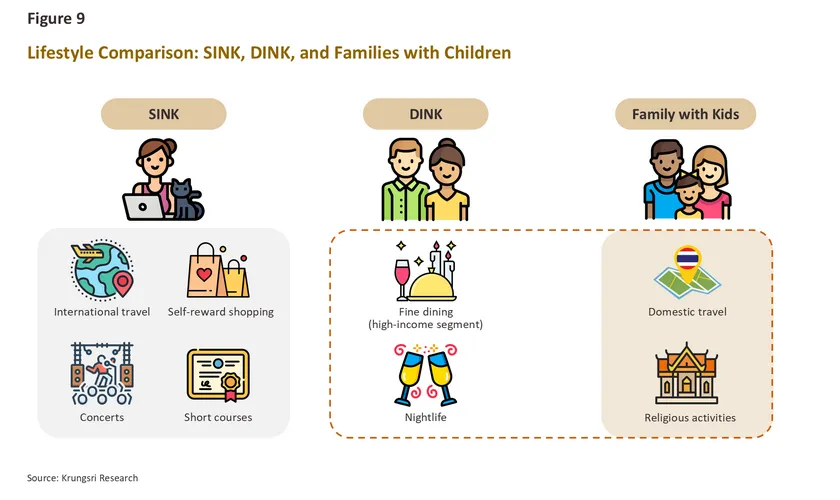
Singles Prefer International Travel, While Couples and Families Favor Domestic Trips
Around 21% of singles travel abroad frequently—approximately 2–6 times per year—significantly higher than both DINK households (16%) and family groups (9%). This may reflect the greater flexibility singles have in making decisions and planning their finances, enabling more frequent international travel. Econometric analysis further confirms that income plays a key role: as income rises, both singles and family groups are more likely to travel abroad more frequently.
In contrast, DINK households and families show a stronger preference for domestic travel. About 66% of these groups travel within the country 2–6 times per year, a significantly higher share than among singles (56%).
Who Attends Concerts More Frequently?
Singles attend concerts more frequently than family groups. Approximately 28% of singles go to concerts at least twice a year, compared to only 11% of those in family households. Econometric results indicate that singles are 2.7 times more likely than family groups—and 1.5 times more likely than DINKs—to attend concerts at least twice annually.
Gender and age also influence concert attendance among singles. Female singles are 1.7 times more likely than male singles to attend concerts at least twice a year. However, the likelihood of attending concerts declines significantly with age.
Singles Are More Likely to Shop for Self-Reward
Nearly half of singles (47%) report shopping for self-reward at least once a month, with similar patterns observed across income levels. Econometric analysis shows that singles are twice as likely as family groups to engage in monthly self-reward shopping. In contrast, a large share of family respondents (45%) shop for self-reward only 2–6 times per year, suggesting that households may prioritize other types of expenses over personal consumption.
Luxury Dining Is Popular Among High-Income DINKs
More than 40% of DINKs earning over THB 100,000 per month dine at luxury establishments—such as omakase and fine dining—more than once a month. This share is significantly higher than that of singles (18%) and family groups (22%) within the same income bracket.
Nonetheless, econometric analysis highlights income as the key driver of luxury dining frequency. As income increases, both singles and family groups are significantly more likely to dine at high-end restaurants more often.
Nightlife Is Most Popular Among LGBTQ+ Singles and DINKs
Around 40% of DINK respondents engage in nightlife activities 2–6 times per year, a significantly higher share than both singles (34%) and family groups (34%). Within the DINK segment, male and female respondents report similar frequencies of nightlife participation. Econometric analysis reveals further nuances across groups. Among singles, LGBTQ+ individuals are approximately 1.8 times more likely than both male and female singles to participate in nightlife more frequently. In contrast, within family groups, male respondents are 1.9 times more likely than females to engage in nightlife activities. Across all groups, however, the frequency of nightlife participation declines with age.
DINKs and Families Are More Active in Religious Activities
Approximately 46% of DINKs and family respondents visit temples or participate in religious activities 2–6 times per year—significantly higher than singles (37%). This likely reflects the older age profile of these groups, who tend to engage more frequently in religious practices. Consistent with this, econometric findings indicate that age is a key determinant of such behavior. Among family respondents, those in the “Silver Age” group (50+) are nearly 1.8 times more likely to visit temples than those in the “Career Builder” group (aged 24–39).
Within the single population, gender also plays a role. LGBTQ+ singles are 2.3 times more likely than male singles to participate in religious activities, while their participation frequency is not significantly different from that of female singles.
Singles Are More Likely to Enroll in Short Courses
About 19% of singles enroll in short courses at least twice per year, significantly higher than family groups (15%). Education level is a key factor driving this behavior. Econometric analysis shows that individuals with higher levels of education are significantly more likely to enroll in short courses more frequently.
5. When Women and Younger Generations Are Less Likely to Have Children
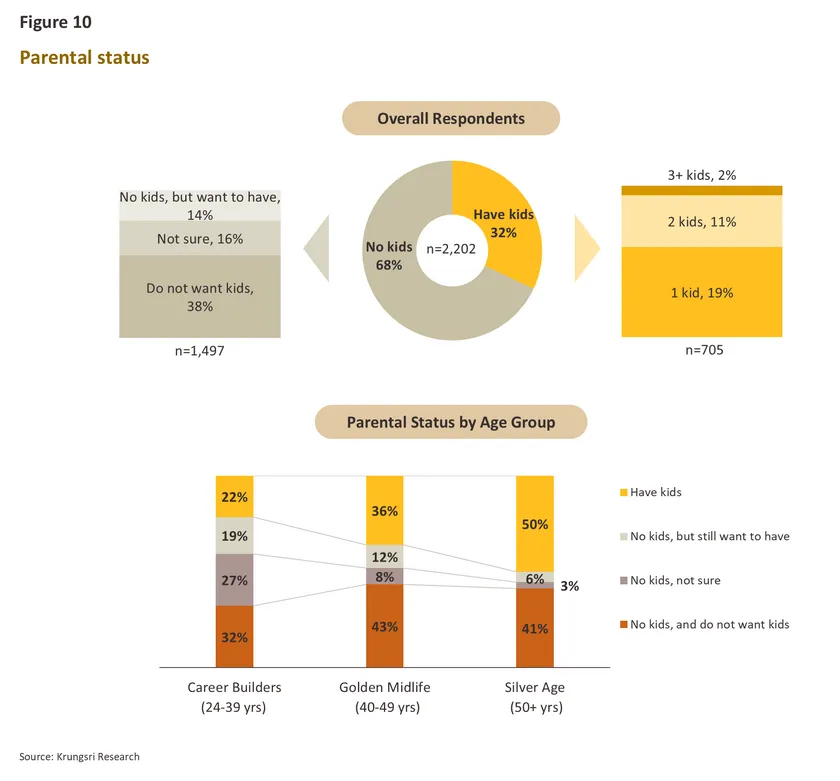
In terms of family formation, 32% of respondents reported having children, and among this group, more than half have only one child. When segmented by age group, the proportion of respondents with children increases with age. The “life-established” group (aged 50+) has the highest share of parents (50%). In comparison, the “stable working age” group (40–49) (36%) and the “early career” group (24–39) (22%) show lower proportions of parenthood. This may reflect both their younger age profiles and a broader shift in childbearing preferences among younger generations.
Furthermore, 32% of respondents in the early career group (24–39)—typically considered the key family-forming age—stated that they do not plan to have children. This is the largest segment within this age group. An additional 27% are still uncertain, while only 19% of those without children currently intend to have children in the future. Gender differences are also evident. The share of respondents who are childless and do not intend to have children is significantly higher among women (38%) compared to men (29%). This may reflect the disproportionate burden of pregnancy and childcare on women and further reinforces the ongoing trend of declining birth rates in Thailand.
6. When Single People Manage Inheritance: Diverse Approaches to Wealth Planning
When planning for asset distribution after death, the survey finds that only 29% of single respondents intend to leave their assets to family members, compared with 44% among those in family households. Single individuals are also more likely to consider alternative approaches to wealth distribution than other groups. These include leaving assets to caregivers in old age (6%) or choosing to fully spend down their wealth before death (6%). Notably, singles are 2.7 times more likely than other groups to adopt a “die with zero” approach, and 4.6 times more likely to allocate assets to charitable causes. This reflects a gradual redefinition of “heirs,” shifting from traditional blood relatives toward organizations and personal networks that hold meaning in their lives.
Gender and identity differences are also evident. LGBTQ+ respondents are significantly more likely to leave their inheritance to those who care for them in later life (9%), compared with men (3%) and women (5%). This highlights a stronger emphasis on “care-based relationships” rather than conventional family structures.
In terms of will-making behavior, income shows a clear correlation. Respondents earning more than 100,000 THB per month are 1.9 times more likely to prioritize estate planning than those earning less. Among this high-income group, 9% have already completed a will, while 46% are currently considering or planning to do so. Women are also slightly more likely than men to engage in will planning or execution, at approximately 1.3 times higher.
7. Facing Life Crises: Who Do Single People Rely On in Times of Serious Illness?
In the event of severe illness requiring hospitalization, nearly half of single respondents (46%) still rely primarily on relatives such as parents or siblings, underscoring that family networks remain the main safety net during crises.
This contrasts with DINK households across all age groups, where spouses are the primary source of support—from early career (24–39 years) (57%) to stable working age (40–49 years) (67%) and older adults (50+) (62%). This shift illustrates how partnership transforms the primary support structure from the family of origin to the newly formed family unit.
At the same time, a substantial share of single individuals emphasize self-reliance. Around 37% of single respondents report that they would take care of themselves as much as possible, compared with only 21% in family households. This highlights a strong self-sufficiency mindset among singles. The pattern is particularly pronounced among men, 45% of whom prefer self-care, making them about 1.6 times more likely than other groups to rely on themselves.
Among women, there is a higher tendency to seek care from relatives (1.4 times higher than other groups) and to hire professional caregivers (1.7 times higher). LGBTQ+ respondents are also more likely to rely on friends for support (12%), compared with women (5%) and men (2%), reflecting the importance of friendship-based care networks that often function similarly to family ties. This also suggests that support systems among single LGBTQ+ individuals may be more complex and socially distributed than traditional family structures.
8. Preparing for Lifelong Financial Security: Earning More, Spending Less, Living the Single Life Approach
More than 90% of respondents across all groups share a common view that ensuring lifelong financial sufficiency requires three key actions: saving, maximizing income before retirement, and reducing expenses.
However, lower-income groups are more likely to prioritize cost-saving behaviors. Similarly, older respondents place greater emphasis on spending less, which may reflect both reduced living expenses and a shorter remaining working horizon for wealth accumulation, leading to a stronger focus on financial frugality.
Some respondents also adopt long-term financial planning strategies through insurance products such as savings plans and pension insurance, as well as investments in various asset classes including equities, gold, mutual funds, and bonds. Female and LGBTQ+ respondents are more likely to purchase insurance products than male respondents, while individuals with higher education and income levels are more likely to invest. This may reflect not only differences in financial attitudes, but also greater access to investment opportunities and higher levels of financial literacy.
In addition, single individuals and DINK households are approximately 1.6 times more likely than family households to allocate funds toward investments aimed at ensuring lifelong financial sufficiency.
Another form of “passive income” that is particularly attractive among early-career respondents (aged 24–39) is income generated from intellectual property rights and rental property. This reflects the growing accessibility of digital platforms that enable younger generations to monetize creative content and real estate, making these income streams more prominent among younger age groups.
However, a portion of respondents still expect to rely on others for financial support in the future. Both single individuals and family households are about 1.4 times more likely than partnered groups to plan for external financial support or caregiving arrangements to ensure adequate financial security throughout life.
9. When Luck Strikes: How Different Groups Use Windfall Gains
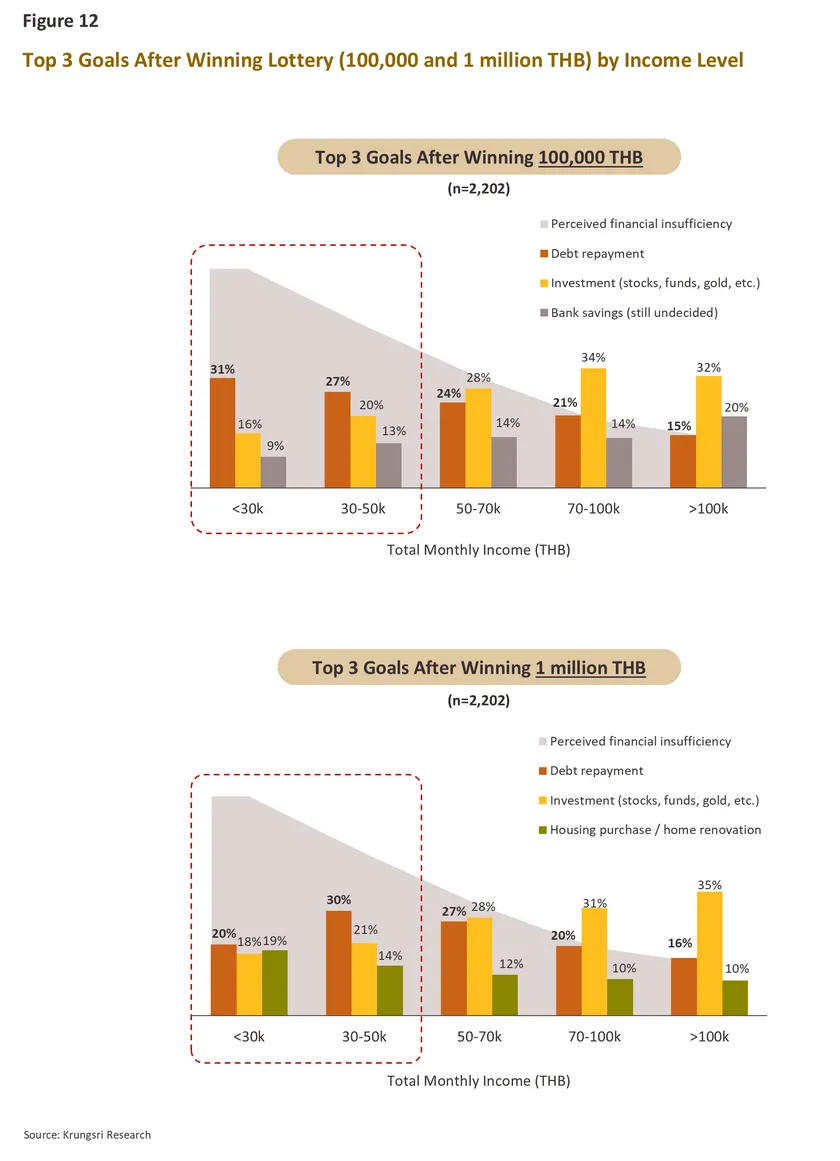
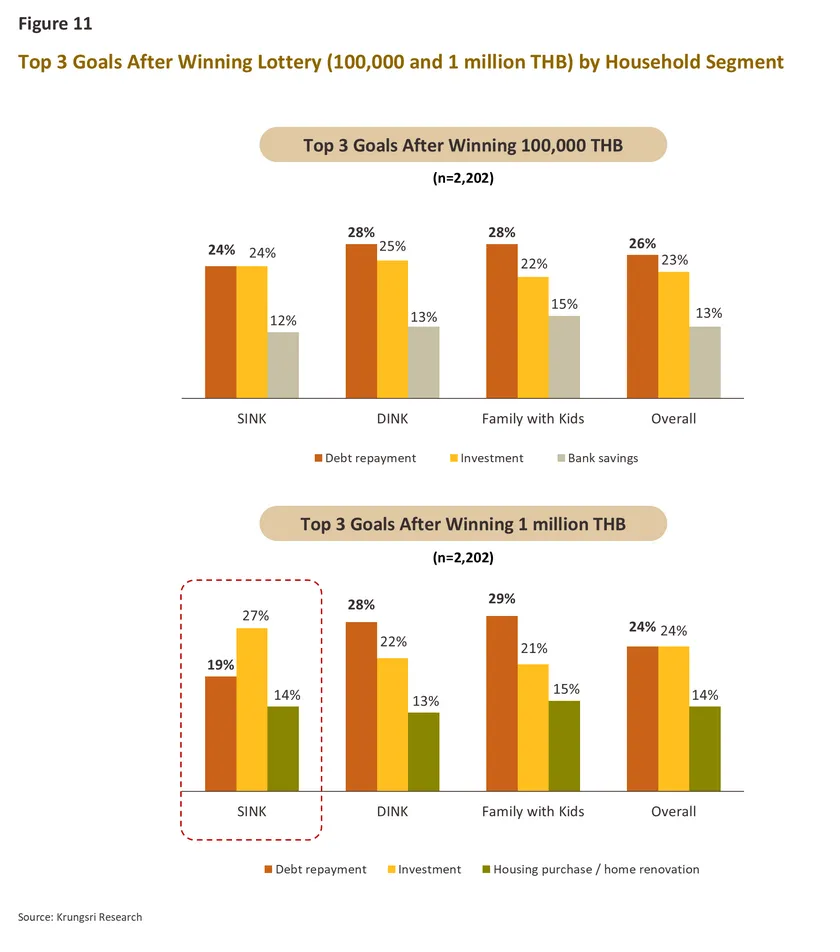
Case: Winning 100,000 THB
When asked how they would use a windfall gain of 100,000 THB, both single and family respondents most commonly prioritize debt repayment (24–28%). This is followed by investment (23–25%), saving in bank deposits (12–15%), and travel (around 10%).
However, income level significantly influences spending behavior. The proportion of respondents who prioritize debt repayment decreases as income increases. More than 34% of respondents earning 15,000–30,000 THB per month report that they would use the money to repay debt. Among family respondents in the same income bracket, this figure rises to 42%. In contrast, respondents earning more than 70,000 THB per month are more likely to invest than repay debt: 33% would invest, while only 18% would use the money for debt repayment. This reflects a lower financial burden among higher-income groups.
Case: Winning 1,000,000 THB
When the prize amount increases to 1 million THB, respondents continue to prioritize debt repayment and investment. However, behavior varies more clearly by group. Among family households, the largest share (29%) would use the money to repay debt, while among single respondents, the largest share (27%) would choose to invest.
Econometric analysis further shows that family households and DINK groups are approximately 1.5 times more likely than single individuals to allocate windfall gains toward debt repayment. Compared with the 100,000 THB scenario, respondents are significantly more likely to allocate a larger prize toward housing-related spending, such as purchasing or renovating a home. This tendency is particularly strong among family households, where the share allocating funds to housing increases threefold.
Income-level analysis also shows that 19% of respondents earning below 30,000 THB per month plan to use the 1 million THB windfall to purchase or renovate housing, a proportion close to those intending to repay debt (20%). This suggests that lower-income groups may aspire to homeownership or home improvement but may not have sufficient income to access mortgage financing or renovation funding. Further analysis of this group shows that 62% currently live with parents or rent their accommodation.
Additionally, econometric analysis shows that respondents without children are 1.6 times more likely than those with children to allocate a 1 million THB windfall toward savings or investment. This suggests that childless individuals tend to focus more on wealth accumulation and return-generating uses of lump-sum income, which may also reflect comparatively lower day-to-day financial responsibilities.
Overall, the findings from this survey indicate that even when respondents receive the same windfall amount—whether 100,000 THB or 1,000,000 THB—financial decision-making varies significantly according to life responsibilities. Individuals with debt tend to prioritize debt repayment, particularly among lower-income groups. Those with families show stronger needs related to housing and home ownership. In contrast, individuals with fewer financial obligations, such as single respondents or higher-income groups, are more likely to prioritize investment and wealth growth.
Financial Products for the Single Economy
Overall, more than half of respondents expressed interest in special banking products and services designed specifically for single lifestyles. These include deposit accounts with exclusive benefits for single customers, such as financial planning support, enhanced healthcare services for illness care, premium dating app memberships, and travel packages tailored to independent lifestyles.
Interest in these offerings varies by age group. Among single respondents aged 50 and above, interest in single-focused deposit accounts is the highest (71%), compared with those aged 24–39 (61%) and 40–49 (66%). In contrast, single respondents aged 24–39 show the strongest interest in single-themed credit cards (45%), compared with those aged 40–49 (36%) and those aged 50+ (27%). This younger group is also more interested in exclusive single-customer events (20%) than older groups (40–49 and 50+, both at 16%).
For more specialized financial products, the survey finds that
partnered respondents are approximately 1.4 times more likely than single respondents to be interested in senior housing conversion products, such as reverse mortgages. Within the family group, respondents aged 40–49 show the highest level of interest, at around 1.3–1.5 times higher than other age cohorts.
By contrast, single and DINK respondents aged 24–39 demonstrate stronger interest in identity- and lifestyle-driven financial products, such as single-themed credit cards and debit cards featuring designs like Goddess Lakshmi.
Respondents also highlighted demand for new types of banking services, including discounts on single-lifestyle activities such as solo dining, travel, concerts, workshops, fitness, and wellness programs, as well as services related to asset planning and inheritance management.
Overall, these findings point to significant opportunities for financial institutions and businesses to develop integrated offerings that connect finance, health, lifestyle, and estate planning. This reflects a broader societal shift in which “living and planning alone” is becoming increasingly normalized.
Krungsri Research view: The “Single Economy” Impacts All Life Stages
Individuals across different relationship statuses—whether single, partnered, married, or with children—exhibit distinct behavioral patterns, attitudes, and life contexts. Being single may carry certain vulnerabilities, particularly the absence of a caregiving support network during critical life events such as serious illness. In contrast, individuals with partners or families may have less personal time and often need to make decisions that consider others. Regardless of relationship status, each comes with its own advantages and limitations.
Survey findings show that single individuals are more likely to prioritize investment activities, overseas travel, and spending on self-care, including wellness and aesthetic treatments, compared with those who are partnered or have families. This reflects the emergence of a “single economy,” characterized by distinct consumption behaviors. If the trend toward single living continues to rise in Thailand, this group may become an increasingly significant consumer segment with meaningful economic implications.
In addition, the study highlights that women and younger generations are more likely to choose not to have children, reflecting Thailand’s persistently low birth rate and the likelihood of a more pronounced aging society in the future. The survey also finds that individuals without children tend to place greater emphasis on savings and long-term investment, suggesting proactive financial preparation for retirement in the absence of reliance on children for future support.
Adapting to the “3S” Economy: The Rise of the Single Economy as a Megatrend
In an era where social structures are shifting toward the expansion of the “Single Economy,” the share of individuals living alone and choosing not to have children continues to rise. This transformation is pushing the business sector to adapt toward a so-called “3S Economy” (Single–Solo–Silver Fusion), which targets single individuals, solo-living lifestyles, and an increasingly aging society.
The 3S framework reflects a growing demand for lifestyles centered on mobility, independence, and self-care. As a result, future goods and services are expected to evolve toward consumption patterns designed for one-person households. Residential spaces may need to be redesigned for convenience and ease of maintenance, with greater integration of smart home technologies. Homes may also increasingly accommodate pets, which are taking on a more prominent role as surrogate family members.
At the same time, demand for self-care products and services—including wellness treatments, aesthetic procedures, and longevity-focused healthcare aimed at maintaining long-term health and quality of life—is expected to grow rapidly and become one of the key high-growth sectors in the future economy.
Next Steps in the Single Economy Era
From a public policy and societal perspective, the survey finds that nearly four in ten young women today report that they “do not have children and do not intend to have children,” a proportion significantly higher than that of men. This reflects the continued disproportionate burden of pregnancy and childcare placed on women. If public policy can reform welfare systems and labor market structures to better support women who choose to have children—while also reducing childcare burdens in a tangible way—it may help increase confidence among women and potentially mitigate Thailand’s accelerating aging society.
At the individual level, personal preparedness is the most important form of resilience. Systematic savings and investment planning are essential to ensure financial stability in a future where self-reliance becomes increasingly important. Continuous learning is also critical to remain adaptable in a rapidly changing world. Equally important is maintaining both physical and mental health, particularly mental well-being, which is often overlooked in the planning of individuals living alone.
If balance can be achieved across these dimensions—regardless of whether one is single or has a family—individuals can lead high-quality, fulfilling lives in a society undergoing profound structural transformation.
References
กรุงเทพธุรกิจ. (2026, มีนาคม 30). ปี 68 เด็กเกิดใหม่ต่ำสุดรอบ 75 ปี เสียชีวิตมากกว่าเกิด ต่อเนื่องเป็นที่ 5. Retrieved from https://www.bangkokbiznews.com/health/public-health/1215717
Bureau of Registration Administration. (2026, มีนาคม 30). สถิติการจดทะเบียนสมรสในไทย. Retrieved from https://stat.bora.dopa.go.th/stat/statnew/statMenu/newStat/home.php
1/ Births in 2025 hit a 75-year low, with deaths exceeding births for the fifth consecutive year. | www.bangkokbiznews.com
2/ Gender and income do not have a significant effect on this aspect.


.jpg?width=100&height=100&ext=.jpg)