Executive Summary
Non-tariff measures (NTMs) are becoming an increasingly dominant instrument of global trade policy worldwide. Key trading partners of ASEAN have implemented NTMs to protect domestic industries, establish product standards, and advance sustainability objectives. The European Union has been especially prominent in this regard, enforcing stringent NTMs across nearly all categories of imports, most notably through the Carbon Border Adjustment Mechanism (CBAM) and the EU Deforestation Regulation (EUDR), both of which bear directly on ASEAN's principal export sectors.
Such measures raise compliance costs for both importers and exporting-country producers, particularly with respect to production upgrading and the Measurement, Reporting, and Verification (MRV) requirements. The impact varies across ASEAN member economies depending on each country's export-to-GDP ratio, degree of dependence on the EU market, and export structure. Countries most reliant on EU-bound exports concentrated in NTM-sensitive products face comparatively greater exposure.
Given the continued intensifying of trade protection measures, ASEAN must accelerate adaptation at both the national and regional levels. Private-sector adjustment will require capital investment and human capital development, supported by coordinated government policy—including incentives for industrial transition, infrastructure development, and upgraded production technologies—to sustain the region's trade competitiveness.
Introduction
Since the establishment of the World Trade Organization (WTO) in 1995, member economies have progressively advanced to reduce barriers to international trade, encompassing both tariff measures and non-tariff measures (NTMs), while also negotiating free trade agreements at both bilateral and multilateral levels. As a result, the global average import tariff rate declined from around 8% in 2002 to 4% in 2021 (WITS, 2023). In contrast, most importing economies have increasingly resorted to NTMs as substitute trade policy instruments. However, since Donald Trump assumed office for a second presidential term in 2025, the United States has announced the imposition of high import tariffs, raising trade costs for exporting economies, including ASEAN. These tariff-related costs have added to the already rising compliance costs associated with NTMs, which have exceeded tariff-related costs in recent years (UNCTAD, 2024).
Major economies—including the United States, China, Japan, and the European Union (EU)—have increasingly applied NTMs to imported goods to protect domestic industries through trade protectionism, while also using such measures as instruments to raise product standards and advance sustainability objectives. Among these economies, the EU has played a particularly prominent role in promoting and enforcing NTMs under stringent requirements and clearly defined implementation timelines. Its primary objective is to safeguard the domestic market through product quality standards harmonization. Accordingly, given that the EU is one of ASEAN’s key export markets, the enforcement of such NTMs inevitably exerts significant impacts on the region’s exports and broader economic performance.
This article therefore focuses on examining the European Union’s NTMs and their impacts on ASEAN economies, with particular emphasis on Thailand, Indonesia, the Philippines, Vietnam, and Malaysia. The analysis is structured into three parts: (1) an overview of the implementation of NTMs; (2) an analysis of their impacts on mentioned ASEAN economies; and (3) summary of impact levels and policy responses among five major ASEAN economies
Overview of the European Union’s Non-Tariff Measures (NTMs) Implementation
Non-tariff measures (NTMs) encompass a range of policy instruments, regulations, and requirements whose primary objectives are to regulate imports and exports, set product standards, and support sustainable development.
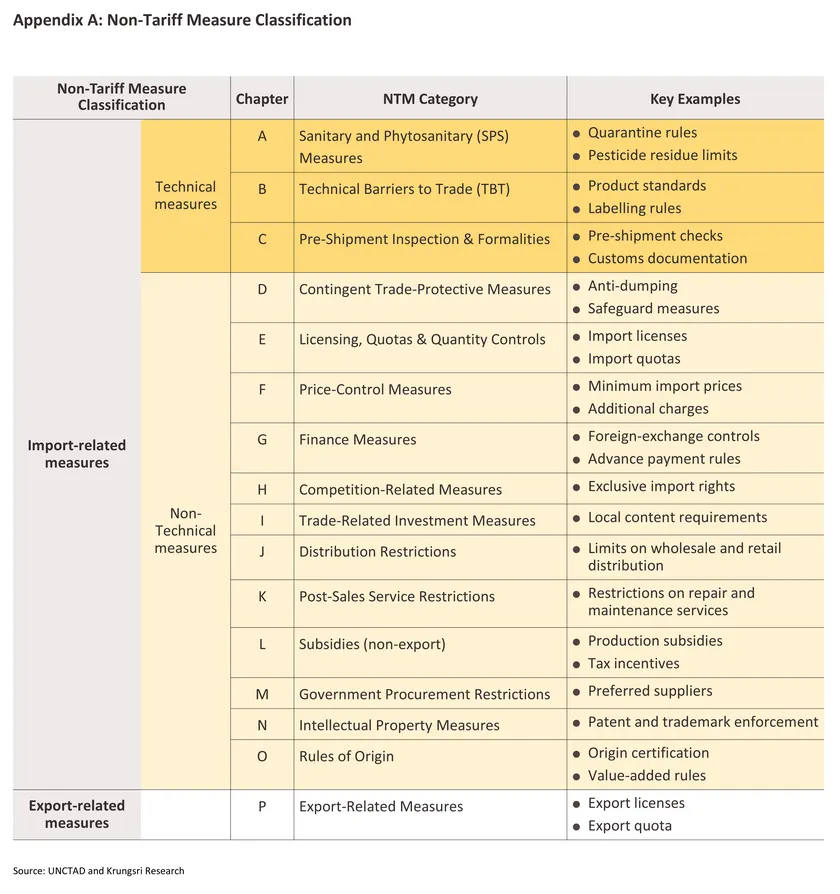
These measures are classified into import-related measures and export-related measures (see Appendix A).
Most EU NTMs are import-related measures, covering a wide range of regulatory areas. These include Sanitary and Phytosanitary (SPS) measures, which govern the trade of agricultural products, as well as Technical Barriers to Trade (TBT) related to product standards, the Carbon Border Adjustment Mechanism (CBAM), and other trade-related requirements such as import quotas and Rules of Origin.
The European Union is among the economies that apply NTMs most intensively, as reflected in two key indicators:
-
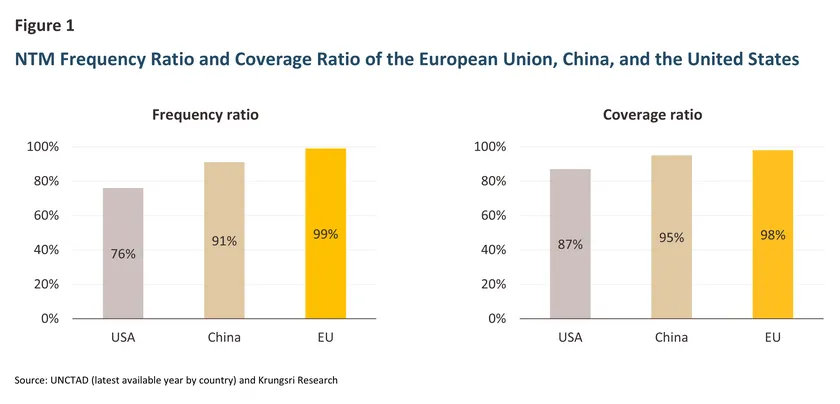
The NTM frequency ratio refers to the share of imported product lines subject to NTMs relative to the total number of imported product lines. For the EU, this ratio stands at 99%1/, indicating that almost all imported goods entering the EU must comply with non-tariff requirements. By comparison, China and the United States—also major export markets for ASEAN—record frequency ratios of 91% and 76%, respectively (Figure 1).
-
The NTM coverage ratio refers to the share of import value subject to NTMs relative to total import value. For the EU, this ratio stands at 98%, higher than those of China and the United States, at 95% and 87%, respectively.
Although both indicators are broadly comparable across these major economies, in practice the EU enforces NTMs intensively across virtually all product categories, whereas the United States and China impose stringent requirements on specific product categories. In addition, the EU continues to introduce new requirements that raise product standards on a broad scale, particularly technical measures and sanitary measures. Key examples of EU NTMs applied to major ASEAN export products—such as steel and metals, food and agricultural products—include the following:
1) Technical barriers to trade (TBT), for example:
-
The Carbon Border Adjustment Mechanism (CBAM)2/ currently imposes a carbon price on six groups of carbon-intensive imported products to level the playing field between goods produced within the EU and imported goods. As a result, importers face additional costs associated with Measurement, Reporting, and Verification (MRV) of greenhouse gas emissions, while producers in exporting countries must invest in upgrading production processes—for instance, shifting to electric arc furnaces in the steel industry to reduce carbon emissions.
-
The EU Deforestation Regulation (EUDR) is set to apply to seven product groups considered to carry high deforestation risks: rubber, palm oil, cattle, timber, coffee, cocoa, and soybeans. The regulation requires businesses to adjust production processes and submit due diligence and verification reports in compliance with EU requirements.
2) Sanitary and Phytosanitary (SPS) measures include, such as, Maximum Residue Limits (MRLs) and prohibitions on the use of hazardous chemicals in agricultural and food products. These requirements increase compliance costs for importers and operators along the production chain, who must adapt cultivation practices, product testing, and certification of residue standards.
Analysis of the Impacts of Non-Tariff Measures on ASEAN Economies
1. Transmission channels of the impacts
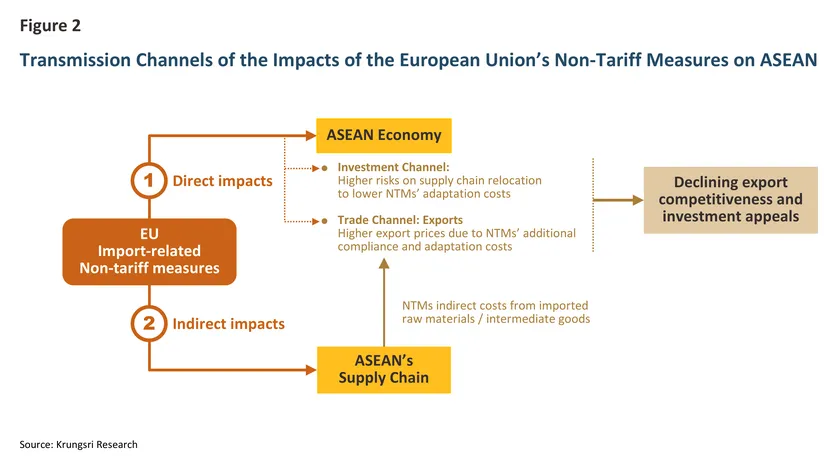
As the EU applies NTMs to imported products on a product-specific basis without discriminating by country of origin, importers must comply with the same standards regardless of where the goods are sourced. This represents a key distinction from tariff measures, which are typically applied on a country-specific basis under trade agreements. ASEAN, as an exporter to the EU, is therefore exposed to direct impacts through trade and investment channels, as businesses incur additional compliance costs to ensure that their products meet EU requirements. In addition, ASEAN economies may also face indirect impacts through the import of raw materials and intermediate goods from trading partners that are themselves affected by NTMs (Figure 2).
The magnitude of the impact is likely to vary across countries depending on key factors such as export dependence, the share of imported raw materials, and the flexibility of domestic supply chains. If ASEAN countries adapt more slowly than their competitors, they risk losing export market share and undermining long-term competitiveness.
The impacts of NTMs on ASEAN exports can be assessed across three dimensions. First, product-group impacts are considered through the Ad Valorem Equivalent (AVE), which is estimated from the price difference between imported goods subject to NTMs and domestic products, thereby capturing the additional costs passed through to import prices. Second, export exposure to the EU is assessed both in terms of overall exports and by product group exports. Third, the analysis considers the export impacts of environmental measures affecting ASEAN, such as the Carbon Border Adjustment Mechanism (CBAM) and the EU Deforestation Regulation (EUDR), the details of which will be presented in the following section.
2. Impacts of NTMs on ASEAN exports
2.1 Product-group impacts based on the Ad Valorem Equivalent (AVE)
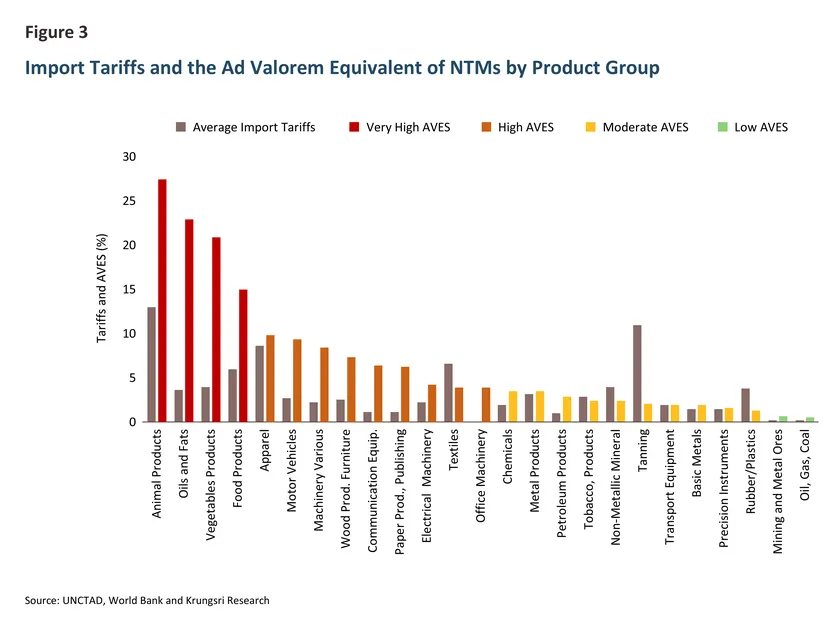
A report by UNCTAD and the World Bank (2018)3/ estimates that the average Ad Valorem Equivalent (AVE) of NTMs for agricultural products is higher than for manufactured goods (Figure 3). This reflects the fact that agricultural products are subject to more stringent trade-protective measures, including import quotas, import price controls, and product quality requirements imposed through Sanitary and Phytosanitary (SPS) measures and Technical Barriers to Trade (TBT). The average AVE for agricultural and food products is as high as 20%, implying that EU import prices for agricultural goods subject to NTMs are around 20% higher than domestic prices. By contrast, among manufactured products, machinery and electronics, automobiles, and apparel record the highest AVEs, at only around 8–10%.
Product groups can be classified into four groups according to the degree of impact on exports based on the AVE of NTMs, from highest to lowest impact, as shown in Figure 3.
-
Product groups with ‘Very High’ impacts, such as agricultural and food products.
-
Product groups with ‘High’ impacts, such as apparel and textiles, automobiles, electronics, and machinery.
-
Product groups with ‘Moderate’ impacts, such as chemicals, metals, rubber, and plastics.
-
Product groups with ‘Low’ impacts, such as minerals, oil, and gas.
2.2 Impacts arising from export dependence on the European Union
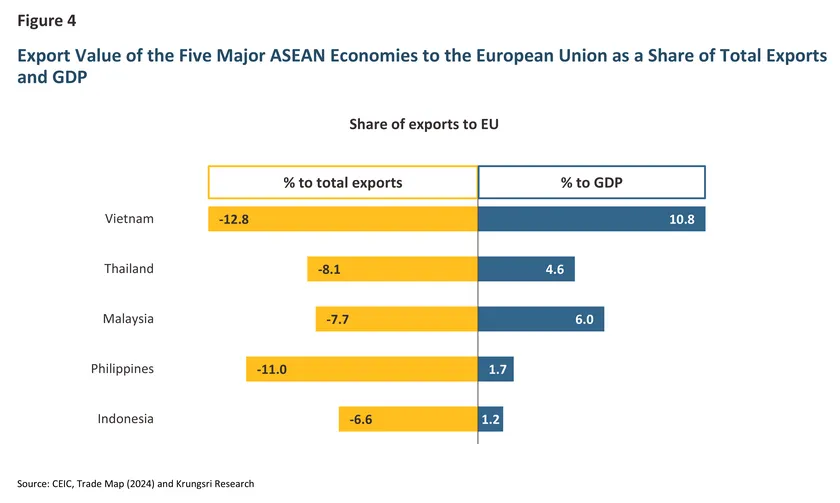
Among the five major ASEAN economies, Vietnam exhibits the highest dependence on exports to the EU (Figure 4). Vietnam’s exports to the EU account for 12.8% of its total exports, equivalent to 10.8% of GDP, followed by the Philippines, whose exports to the EU represent 11.0% of total exports. However, when EU market dependence is considered relative to the size of each economy, Thailand and Malaysia show higher exposure to the EU market than the Philippines and Indonesia.
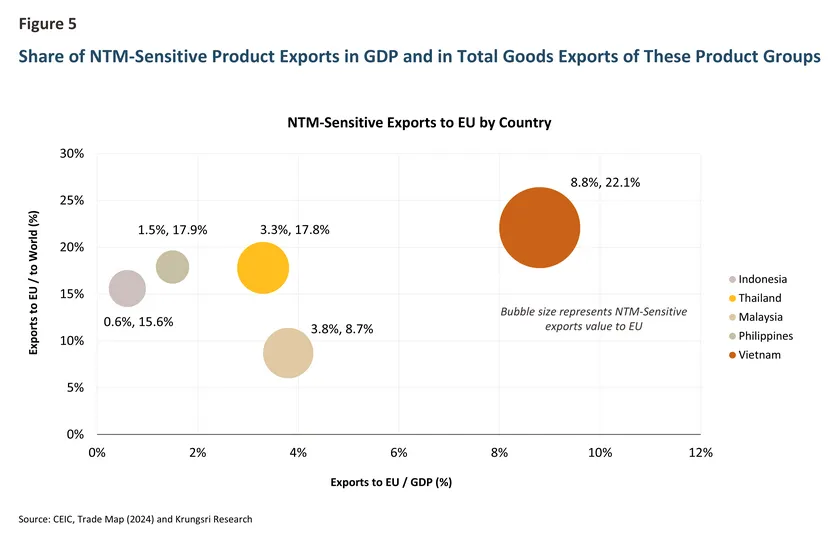
The assessment of the impact of NTMs on exports and the economy is based on the share of NTM-sensitive product4/ exports in GDP and in total export value for these product groups (Figure 5). The results suggest that Vietnam faces the highest risk of impact, as exports of these products account for 8.8% of GDP and 22.1% of total goods exports. Thailand and Malaysia follow, with NTM-sensitive product exports equivalent to 3.3% and 3.8% of GDP, respectively. The Philippines and Indonesia are relatively less affected.
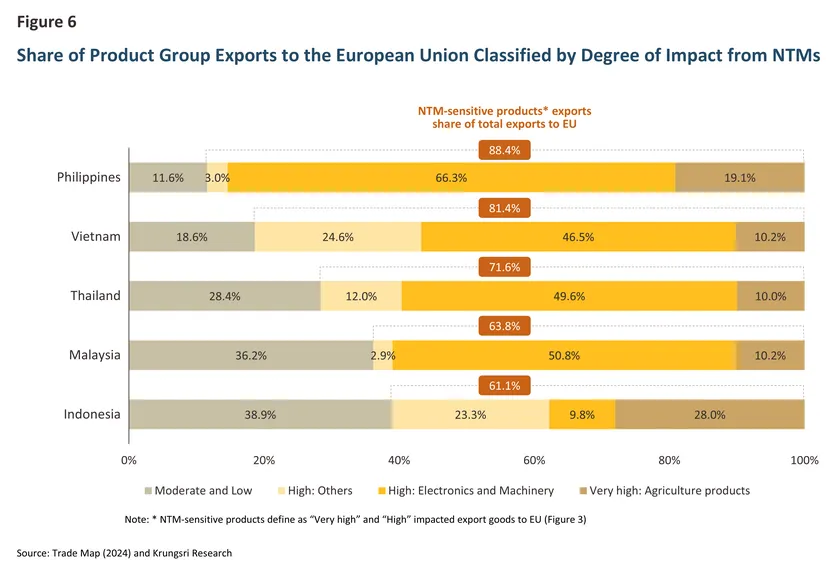
However, when considering EU market dependence specifically, the Philippines exports NTM-sensitive products amounting to 88.4% of its total exports to the EU (Figure 6). Vietnam and Thailand follow, with NTM-sensitive products accounting for around 70–80% of their exports to the EU, while Malaysia and Indonesia are relatively less affected. In addition, most major ASEAN economies, except Indonesia, depend heavily on exports of electronics and machinery to the EU, with this product group accounting for around half of total exports. Consequently, the impact of NTMs is likely to be concentrated primarily in this product category.
2.3 Impacts from environmental related measures
As the EU imposes stringent environmental standards on imported goods, these measures affect ASEAN’s major export products and supply chains. This article therefore assesses the impacts of key environmental NTMs as follows:
1) Analysis of the impacts of the Carbon Border Adjustment Mechanism (CBAM)
The EU introduced CBAM to establish parity between imported goods and goods produced within the EU in terms of carbon management costs. The measure also aims to prevent carbon leakage arising from the relocation of production to countries with lower environmental standards. CBAM covers six target product groups: iron and steel, aluminium, cement, fertilizers, electricity generation, and hydrogen production. The measure came into force on January 1, 2026, with plans to extend its scope to other carbon-intensive product groups, such as plastics and chemicals, in the next phases.
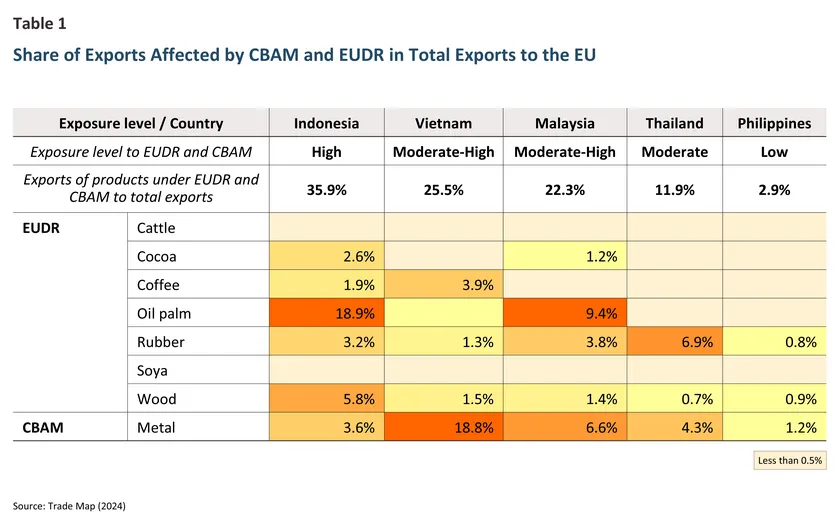
This measure directly affects exports of carbon-intensive products. At the product level, metal products (HS72–83) are likely to be the most affected. Among the five major ASEAN economies, Vietnam has the highest dependence on metal exports to the EU, at 18.8% of its total exports in this product group, followed by Malaysia (6.6%), Thailand (4.3%), Indonesia (3.6%), and the Philippines (1.2%). It can therefore be concluded that Vietnam is clearly more exposed to CBAM-related risks than other countries.
In addition, CBAM increases adjustment costs for exporters, both through the need to modify production processes to reduce carbon emissions and through the substitution of imported green steel or intermediate metal products at higher costs. This can be indicated by the CBAM Aggregate Trade Exposure Index, which measures the additional cost of carbon management, or the value of excess carbon payments, relative to the export value of CBAM-covered products for each country (Figure 7). A higher index suggests that a country faces higher additional carbon management costs, which could weaken export competitiveness. Among the five major ASEAN economies, Indonesia faces the highest adjustment-cost risk under CBAM, as its metal industry spans the entire production chain, particularly upstream smelting activities, which are highly carbon-intensive.
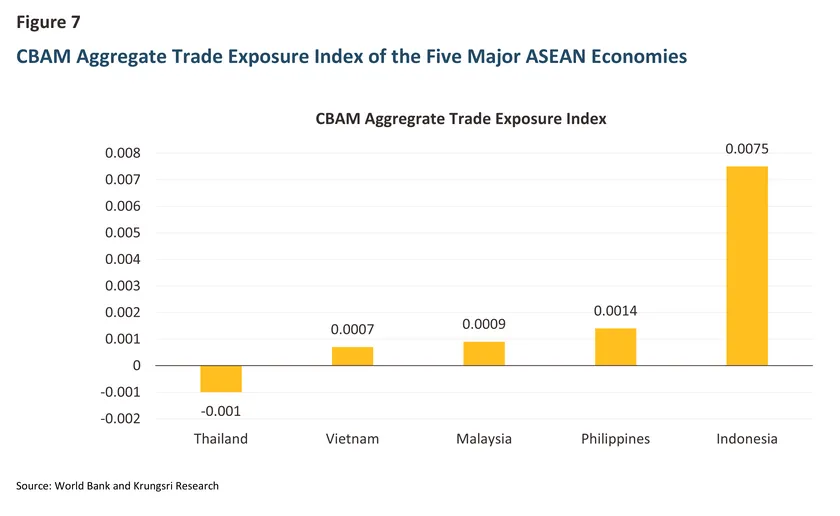
Taking into account both export dependence on CBAM-sensitive products and adjustment costs, Indonesia appears to be the most affected country, as domestic industries across the production chain face high adjustment costs. Vietnam follows, given its relatively high dependence on metal exports; however, as most of these exports consist of intermediate and finished metal products, its adjustment-cost burden is comparatively lower than Indonesia’s. Malaysia, Thailand, and the Philippines are assessed to face moderate impacts. Although Malaysia is a major steel producer in the region, the government has continuously implemented policies to facilitate industrial adjustment and promote a transition toward carbon-neutral steel production by 2050.
2) Analysis of the impacts of the EU Deforestation Regulation (EUDR)
The EUDR covers seven groups of commodities and processed products considered to carry high deforestation risks: rubber, palm oil, cattle, timber, coffee, cocoa, and soybeans. The regulation stipulates that such products must not originate from areas associated with forest encroachment and must also be produced in compliance with land-use and environmental laws, as well as fair labor practices. Operators are required to submit due diligence reports in accordance with EU requirements. At the end of 2025, the European Parliament resolved to postpone the implementation of the EUDR by one year for large enterprises, from December 30, 2025, to December 30, 2026, while implementation for small enterprises was postponed from June 30, 2026, to June 30, 2027.
The full implementation of the EUDR will affect ASEAN’s key export products to varying degrees, depending on each country’s export structure to the EU market. Indonesia is likely to be the most affected, as in 2024 palm oil and timber accounted for around 18.9% and 5.8%, respectively, of its total exports to the EU, alongside exports of rubber, cocoa, and coffee (Table 1). Malaysia is expected to be the next most affected economy, given its dependence on the EU market for palm oil and rubber exports, at around 9.4% and 3.8%, respectively. Thailand is likely to be affected mainly through rubber products, as the EU is an important export market for Thai rubber, accounting for around 6.9% of Thailand’s total rubber exports. Vietnam is affected through coffee exports to the EU, at around 3.9%, while the Philippines is likely to face limited impacts because exports of EUDR-covered products such as rubber and timber to the EU account for only 0.8% and 0.9%, respectively.
Considering the impact of EU environmental measures on exports from the major ASEAN economies, covering both CBAM and EUDR (Table 1), Indonesia is likely to be the most affected country (‘High’ impact), as the combined share of exports subject to these two measures amounts to 35.9% of its total exports to the EU, particularly palm oil products under the EUDR. Vietnam and Malaysia follow with ‘Moderate-to-High’ impacts. Vietnam has the largest share of metal exports to the EU, making it relatively exposed to CBAM, while Malaysia is more affected by the EUDR. Thailand is affected mainly through rubber and metal products, whereas the Philippines is expected to face limited impacts from both measures.
Summary of the Impact Levels and Policy Responses among Five Major ASEAN Economies
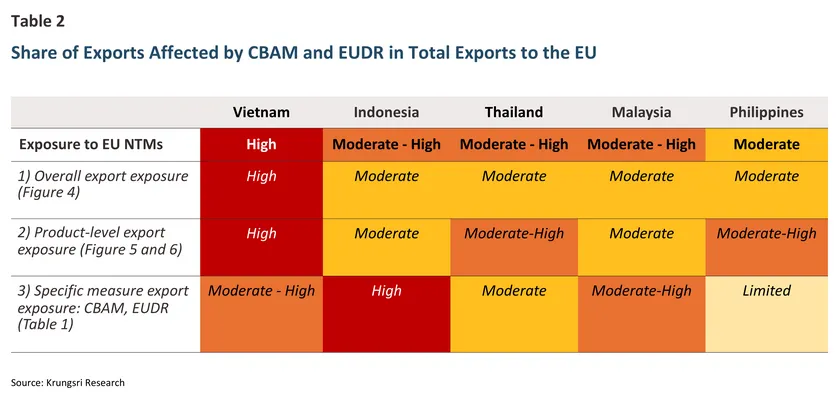
The overall level of impact from NTMs is derived by integrating the assessment findings across three dimensions: 1) overall export exposure to the EU; 2) product-level export exposure to the EU; and (3) specific-measure export exposure arising from CBAM and EUDR. The third dimension is assigned a lower weight relative to the first two dimensions because it pertains to measures covering only specific product categories and therefore has a comparatively more limited scope of impact. The overall findings across all three dimensions are summarized in Table 2.
-
Countries facing ‘High’ impacts include Vietnam, which has a higher degree of export dependence on the EU than other economies, both in overall exports and at the product-group level.
-
Countries facing ‘Moderate-High’ impacts include Indonesia, Malaysia, and Thailand. Indonesia and Malaysia are relatively more exposed to CBAM and EUDR, while Thailand is affected mainly through rubber and electronics products.
-
Countries facing ‘Moderate’ impacts include the Philippines, which relies heavily on electronics exports to the EU but is comparatively less affected by environmental measures than other major ASEAN economies.
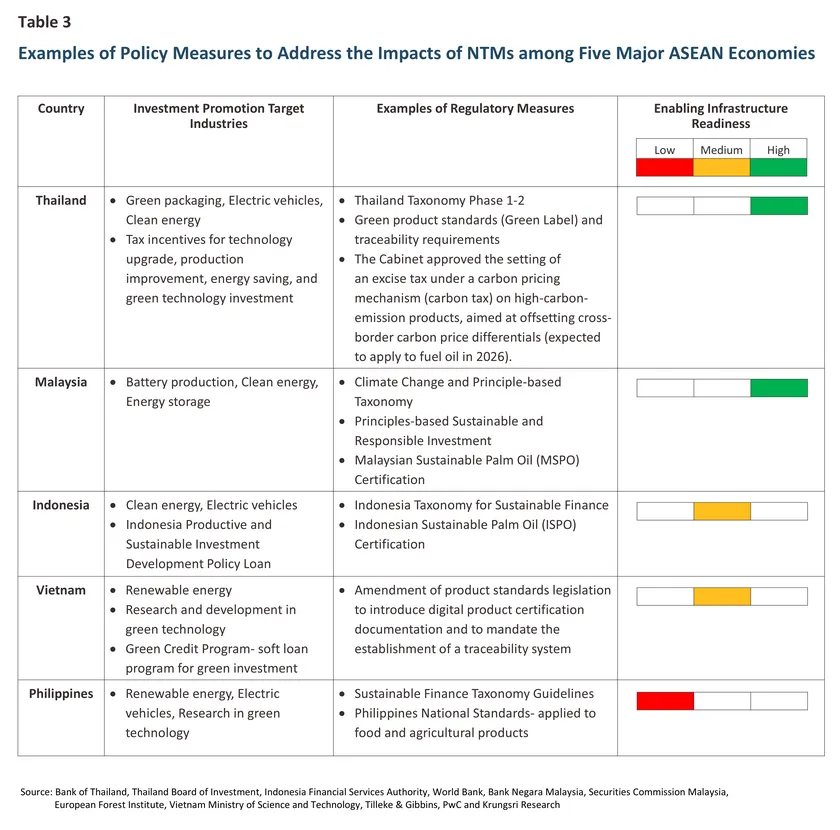
Furthermore, the region also faces an intensifying global trend of NTMs imposed by other economies. These measures are likely to raise product costs and pressure businesses to adjust their manufacturing processes and supply chains. Such adjustments require resources and time, as well as government support mechanisms through regulatory improvement and investment-promoting measures that are conducive to long-term investment, in order to mitigate the impact of NTMs. Within this context, major ASEAN economies have begun implementing various measures aiming to mitigate the impacts of NTMs and strengthen trade competitiveness. Examples of such measures are presented below (Table 3).
Overall, ASEAN economies’ measures to cope with NTMs can be grouped into two main areas:
-
Investment promotion measures. Most ASEAN economies have introduced investment-promotion measures in targeted industries, which can help reduce adjustment costs for businesses and enhance competitiveness. However, additional investment conditions are still needed to support industrial upgrading so that firms can adapt to NTMs while raising environmental standards in key economic sectors. Indonesia, Thailand, and Malaysia have particularly prominent investment-attraction measures in the region, whereas the Philippines still provides relatively limited investment incentives5.
-
Regulatory adjustment and enabling infrastructure. Thailand and Malaysia have relatively comprehensive infrastructure readiness and policy tools to support adjustment and product-standard upgrading. Vietnam and Indonesia show strengths in clean-energy investment, while the Philippines needs to further strengthen policies that support the transition of its manufacturing process.
Krungsri Research View
The enforcement of non-tariff measures (NTMs) continues to intensify progressively among ASEAN’s major trading partners, particularly the European Union and the United States, which are increasingly prioritizing environmental considerations, sustainability, and safety standards in the formulation of trade policy. The resulting impact is not confined solely to the export of final goods, but extends throughout the entire supply chain, encompassing raw material sourcing, production processes, and traceability requirements, thereby compelling businesses to adapt simultaneously across multiple levels. This inevitably leads to an increase in ASEAN's overall export costs and may constitute a structural challenge to the region's long-term competitiveness.
Accordingly, key ASEAN countries have accelerated the introduction of various measures to accommodate and mitigate the impact of NTMs. However, the production restructuring require an enabling regulatory environment, alongside investment in infrastructure such as clean energy and research and development (R&D) to advance manufacturing technologies, which will serve as key mechanisms for upgrading industries across the supply chain.
Beyond national-level adjustment, regional cooperation is considered crucial. This includes the harmonization of product standards and the integration of verification systems, which would help ASEAN sustain its export competitiveness in the European Union and other export markets that are expected to continue expanding the use of non-tariff measures. Such efforts are increasingly important in the landscape of the modern global economy, in which globalization and free trade have increasingly become a thing of the past.
References
Association of Southeast Asian Nations. (2025, November). ASEAN Taxonomy for sustainable finance Version 4 https://www.theacmf.org/images/downloads/pdf/ASEAN%20Taxonomy%20Sustainable%20Finance%20V4_06Nov25.pdf
European Commission (2024) International trade in goods – tariffs, Statistics Explained. https://ec.europa.eu/eurostat/statistics-explained/SEPDF/cache/65103.pdf
UNCTAD (2025a) From non-tariff measures data to impact Guidelines for the analytical pathway from non-tariff measures inventory to trade impact assessment https://unctad.org/system/files/officialdocument/ditctab2025d4_en.pdf
UNCTAD (2018) The unseen impact of non-tariff measures: Insight from a new database https://unctad.org/system/files/official-document/ditctab2018d2_en.pdf
UNCTAD (2024). Making sense of non-tariff measures: A user’s guide to accessing and analysing the data. United Nations publication. https://unctad.org/system/files/official-document/ditctab2024d6_en.pdf
United Nations Environment Programme Finance Initiative. (2025, March). Sustainable finance taxonomies in ASEAN: Towards regional harmonization. https://www.unepfi.org/wordpress/wp-content/uploads/2025/03/Policy_ASEAN-Taxonomies-Comparison.pdf
Appendix
1/ UNCTAD (2025), Data on Non-tariff measures
2/ Read more: Countdown to the CBAM: How prepared is Thailand for the introduction of the EU carbon tax?
3/ Simple average Ad Valorem Equivalents (AVEs) for 40 importing economies, including the European Union, and 200 exporting economies,
classified by product group according to ISIC, comprising five agricultural product groups and 20 manufacturing product groups.
4 NTM-sensitive products include product groups with ‘Very High’ and ‘High” impacts from NTMs (as shown in Figure 3)
5/ Read more: Countdown to the CBAM: How prepared is Thailand for the introduction of the EU carbon tax?