Executive Summary
The Middle East conflict that erupted in late February 2026 could lead to a “Household Cost-Income Squeeze.” “Constrained households” are more exposed to the squeeze, as they face steeper rises in the cost of living, are mainly employed in sectors sensitive to the energy crisis, and have limited financial buffers. Although the risk of the “Household Cost-Income Squeeze” among “constrained households” may weigh on aggregate consumption to some extent, other less-exposed households could help support aggregate consumption and mitigate the impact of the energy crisis. However, it is crucial not to overlook the fact that still-expanding aggregate consumption may mask the difficulties faced by “constrained households.”
Regardless of how the current energy crisis evolves, household vulnerability to simultaneous pressures on both the expenditure and revenue sides remains a key long-term challenge. We should accelerate efforts to strengthen household resilience by enhancing the social safety net, promoting financial literacy, and supporting skills development at all ages, alongside supply-side policies such as promoting investment in high-tech industries. Such supply-side policies can help create high-value-added jobs and raise wage levels in the future.
Introduction
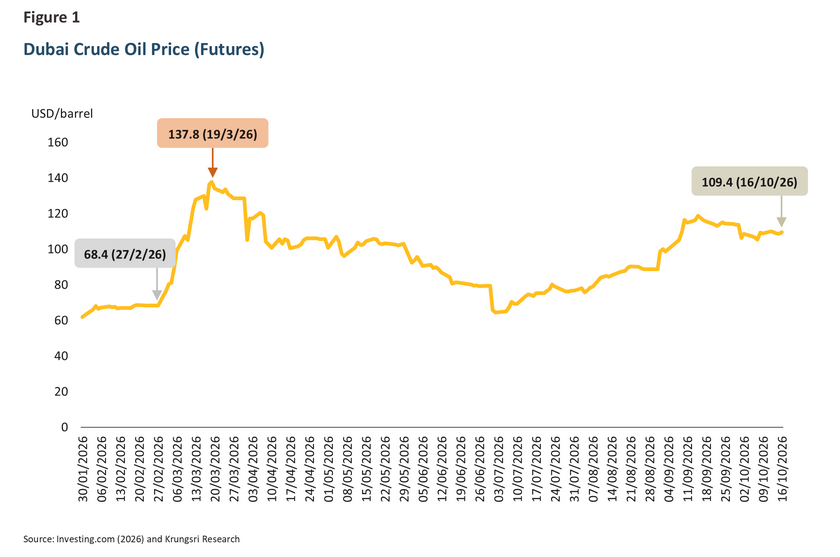
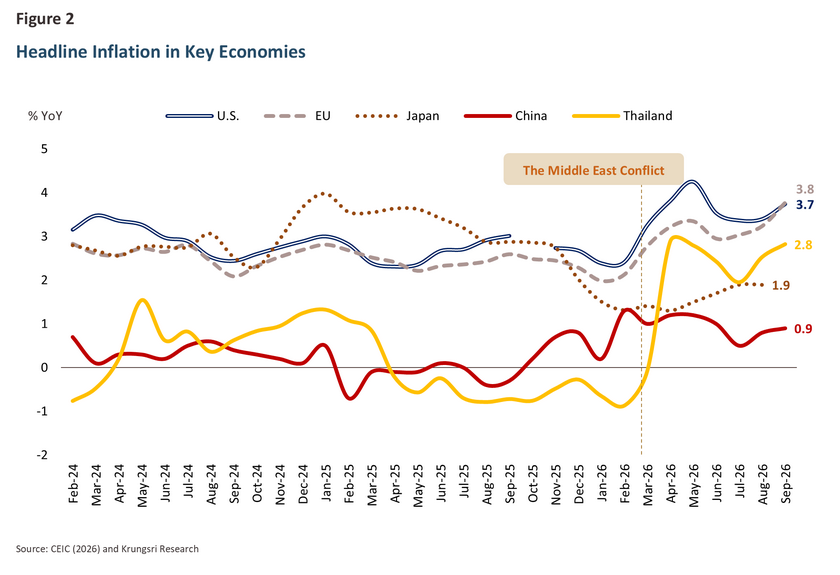
The conflict in the Middle East that erupted in late February 2026 has driven crude oil prices substantially higher (Figure 1), accelerating inflation across many countries and placing pressure on living costs (Figure 2). Meanwhile, rising production costs resulting from higher oil prices may also affect employment and household revenue. This situation may lead to a phenomenon in which households face pressure from both the expenditure and revenue sides as a result of the energy crisis, referred to as a “Household Cost-Income Squeeze.”
However, households across different income groups may differ in their exposure to the phenomenon and their ability to deal with it, depending on household characteristics and behaviors, including spending structures or primary products consumed, sources of income or sectors in which household members are employed, and emergency funds or financial buffers.
Therefore, this study aims to assess household risks and exposure to the “Cost-Income Squeeze,” which may differ across income groups, as well as its impact on Thailand’s aggregate consumption.
Pass-Through Mechanism from the Energy Crisis to Thai Inflation
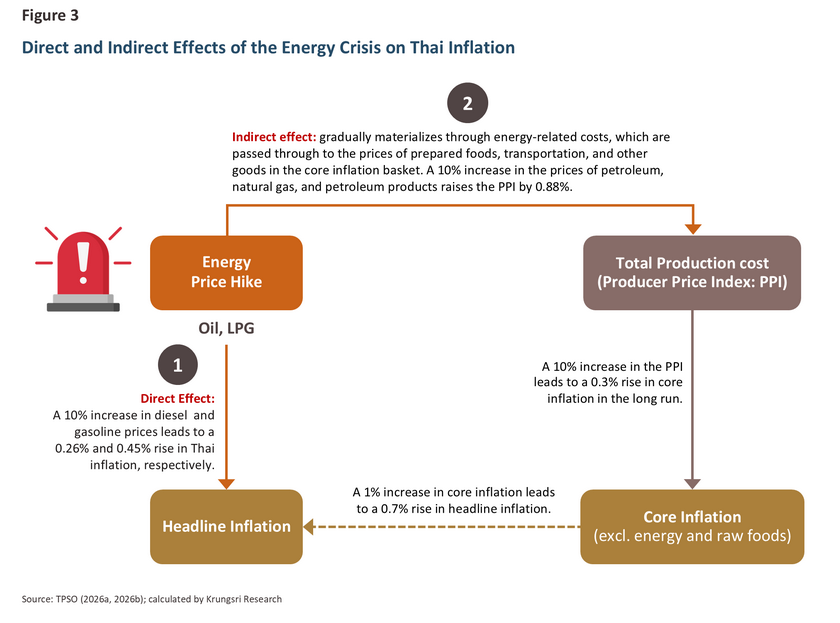
From a macroeconomic perspective, the energy crisis stemming from the conflict in the Middle East could affect Thai inflation through both direct and indirect channels (Figure 3).
-
Direct impact: The conflict in the Middle East could immediately push up fuel prices and accelerate inflation, as fuel-related items are included in Thailand’s inflation basket. However, government subsidies and price controls may temporarily mitigate inflationary pressures during the early stages of the crisis, limiting sharp increases in living costs.
-
Indirect impact: If energy prices remain persistently high and government subsidies are gradually phased out, producers may gradually raise prices to reflect higher costs. This could lead to the pass-through of higher energy costs to the prices of other goods and services, such as prepared foods and transportation. Such an impact could be assessed via the Producer Price Index (PPI). If the PPI rises at a faster pace than the Consumer Price Index (CPI), it may reflect cost pressures that producers are bearing, which may also be passed through to consumers and reflected in headline inflation in subsequent periods.
Beyond energy prices, the conflict may also exert additional inflationary pressures through supply risks of other factors of production, such as fertilizers, naphtha, and petrochemicals.
Assessment of the “Household Cost-Income Squeeze” Risk by Income Group
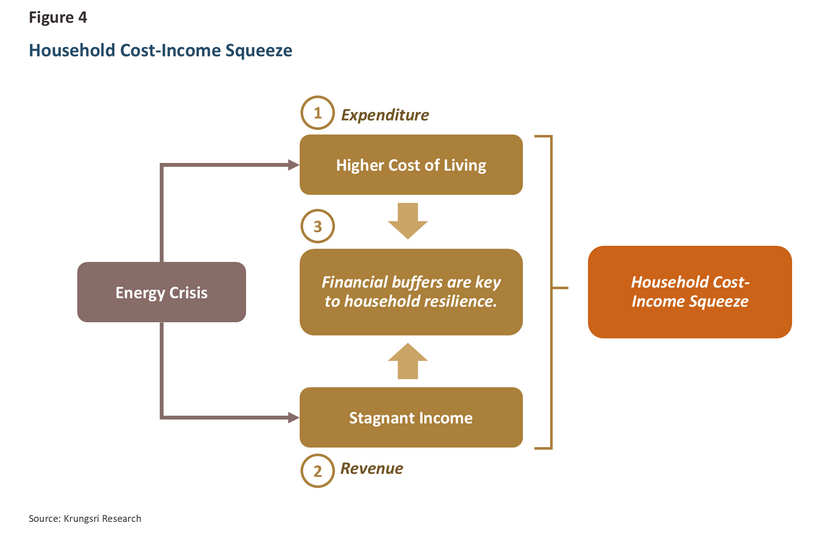
To assess the risk of the “Cost-Income Squeeze” at the household level, this study examines the impact of the energy crisis transmitted through 1)
household expenditure, by assessing the impact on the cost of living given differences in spending patterns across income groups, and 2)
household revenue, by examining occupational groups and income growth. These are considered alongside 3)
financial buffers, which reflect households’ ability to cope with unforeseen events (Figure 4).
In this assessment, data from the 2015-2025 Household Socio-Economic Survey conducted by the National Statistical Office are used. Households are classified into three groups according to income level, which to some extent reflects their overall financial position, as follows:
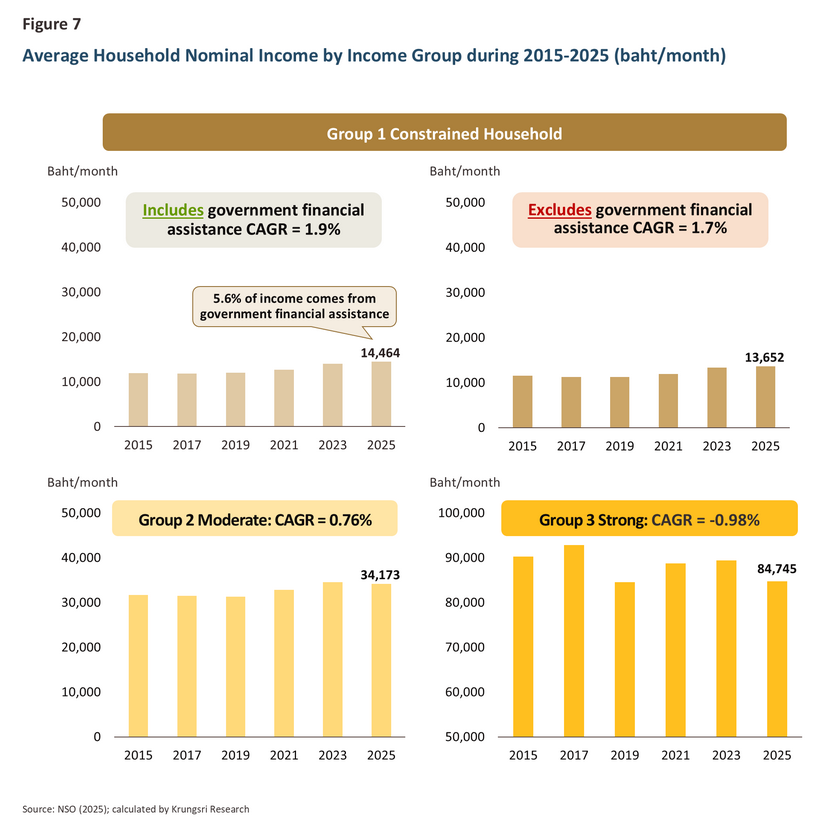
Group 1: Financially constrained households are those with a monthly income of no more than 24,000 baht in 2025 (an average of 14,464 baht/month), corresponding to the 60th percentile or below. This group accounts for 57.2% of total households.
Group 2: Households with moderate financial positions are those with a monthly income between 24,001 and 51,657 baht in 2025 (an average of 34,173 baht/month), corresponding to between the 60th and 90th percentiles. This group accounts for 32.1% of total households.
Group 3: Households with relatively strong financial positions are those with a monthly income of at least 51,658 baht in 2025 (an average of 84,745 baht/month), corresponding to the 90th percentile or above. This group accounts for 10.7% of total households.
Household Expenditure or Living Costs
As previously mentioned, the impact of higher energy prices on households’ cost of living in the initial stage is a direct effect on vehicle fuel prices. Subsequently, an indirect effect will gradually emerge through price increases in other key goods, particularly prepared foods. However, since households have different spending structures, the impact on their cost of living will also differ.
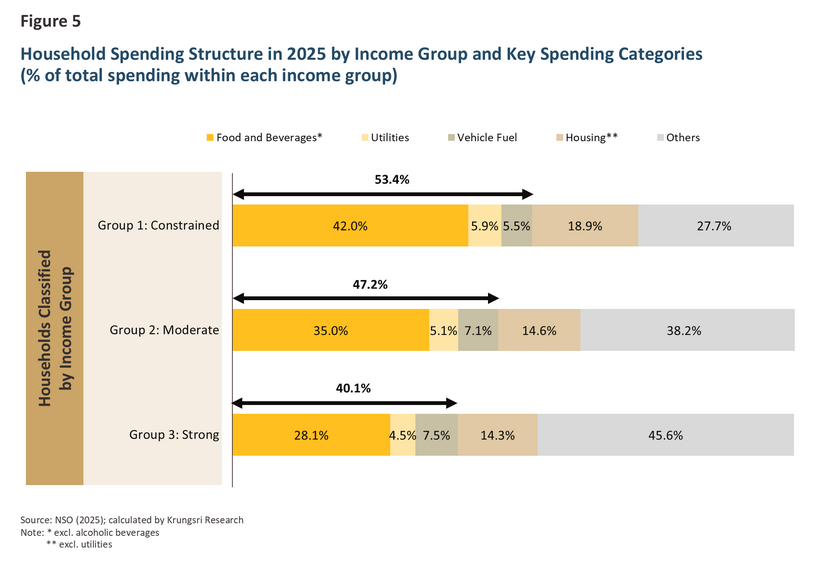
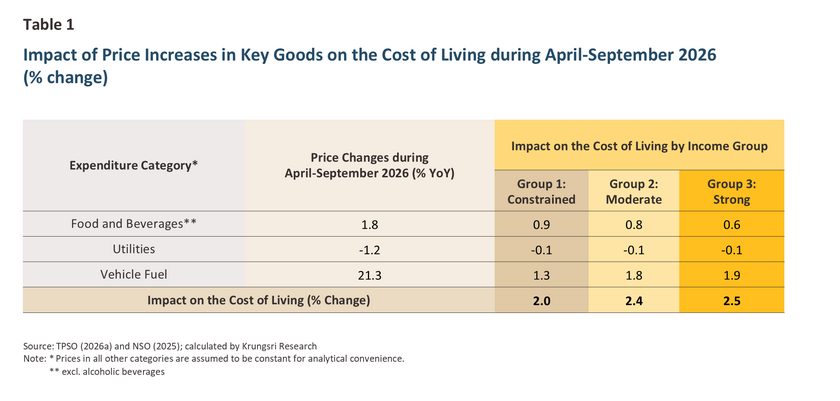
In the initial period, households with higher incomes, or “strong households” (Group 3), face greater cost-of-living pressure, since vehicle fuel accounts for a larger share of their spending basket, while prices in other categories, particularly food, have yet to change substantially due to government subsidies (Figure 5 and Table 1).
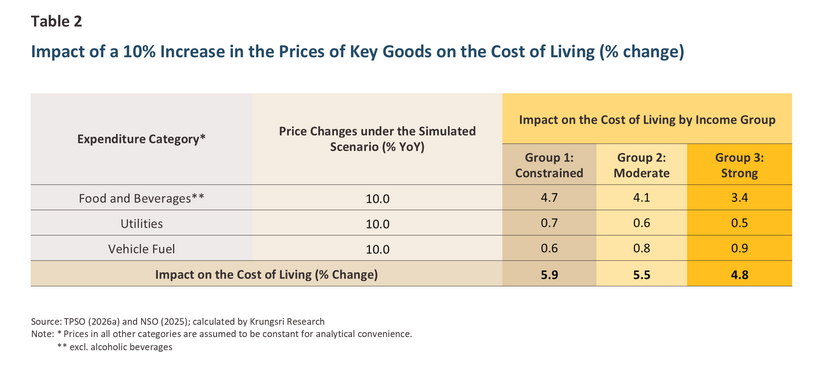
However, over time, the impact of energy cost pass-through, or the indirect effect, will become more noticeable. Groups 1 and 2 (or “constrained households” and “moderate households”) will face greater cost-of-living pressure than Group 3, as both groups have a higher share of spending on necessary goods, including food, utilities (electricity, gas, and water), and vehicle fuel. Specifically, spending on necessary goods accounts for 53.4% and 47.2% of total spending of Groups 1 and 2, respectively (Figure 5). Therefore, if prices in all three categories of necessary goods increase by 10% (Table 2), Group 1 will be affected the most, as its spending structure is more exposed to price increases in necessary goods.
In conclusion, in the early stage of the energy crisis, Group 3, or “strong households,” will be more affected on the expenditure side. However, when the impact of the energy crisis passes through to other goods and becomes more visible, Group 1, or “constrained households,” will experience the greatest pressure, as they have a higher share of spending on necessary goods and thus have limited ability to adjust their spending in response to the higher cost of living.
Household Revenue
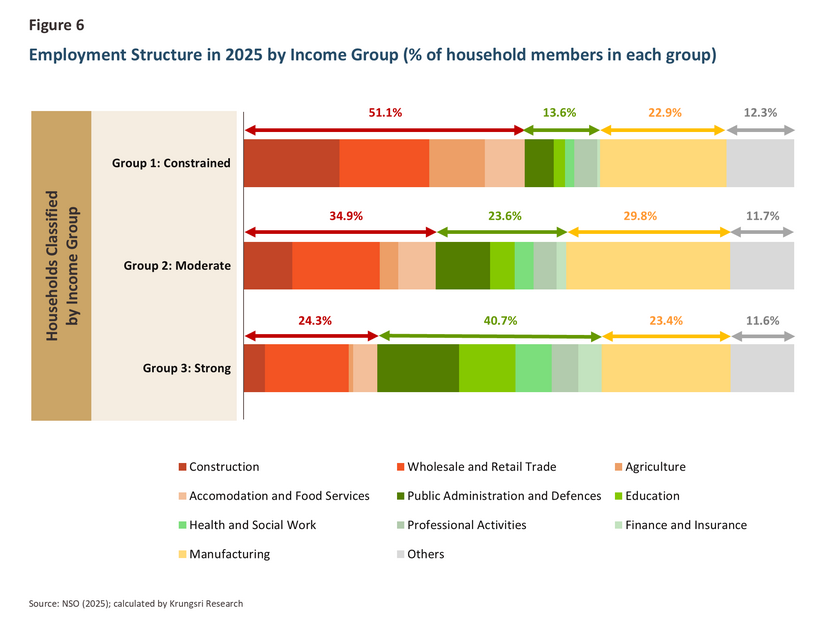
Apart from the greater pressures on the expenditure side that Group 1, or “constrained households,” face, if we consider the revenue side by examining the vulnerability of the sectors in which household members are employed, we find that Group 1, or “constrained households,” may experience reduced working hours and wage reductions, or even layoffs, during the crisis. This is because members of this group work in sectors that are more exposed to changes in demand and supply, including construction, wholesale and retail trade, agriculture, and accommodation and food services (red tone in Figure 6). Specifically, 51.1% of members of Group 1 are employed in such sectors, compared with 24.4% of members of Group 3, or “strong households.” On the other hand, around 40.7% of Group 3 members work in more stable sectors, including public administration, education, health and social work, professional services, and finance and insurance (green tone in Figure 6).
Considering the income growth trajectory over the past decade (Figure 7), we found that Group 3, or “strong households,” has recorded a decline in average nominal income growth, while Group 2, or “moderate households,” has experienced relatively limited income growth. Given that the average national inflation rate is around 1% per year, real income (nominal income adjusted for inflation) has consequently declined. In other words, despite their stronger financial positions, both Groups 2 and 3 have experienced weakening purchasing power over the past ten years.
Even though Group 1, or “constrained households,” has recorded faster nominal income growth, this growth has been partly supported by government financial assistance, whose share increased from 3.6% of total nominal income in 2015 to 5.6% in 2025. If such financial assistance is excluded, nominal income would grow by just 1.7% on average. Thus, although real income growth of Group 1, or “constrained households,” has increased, its rate has remained quite low.
Additionally, higher cost-of-living pressures from the energy crisis are likely to aggravate already weak household purchasing power, especially among Group 1. In other words, aside from low real income growth, households in this group are also more affected, as mentioned in the “Household Revenue” section. Thus, if energy prices remain persistently high and the pass-through effect on other goods becomes more visible, the real income growth of this group risks slowing down or declining, thereby weakening purchasing power.
Household Financial Buffers
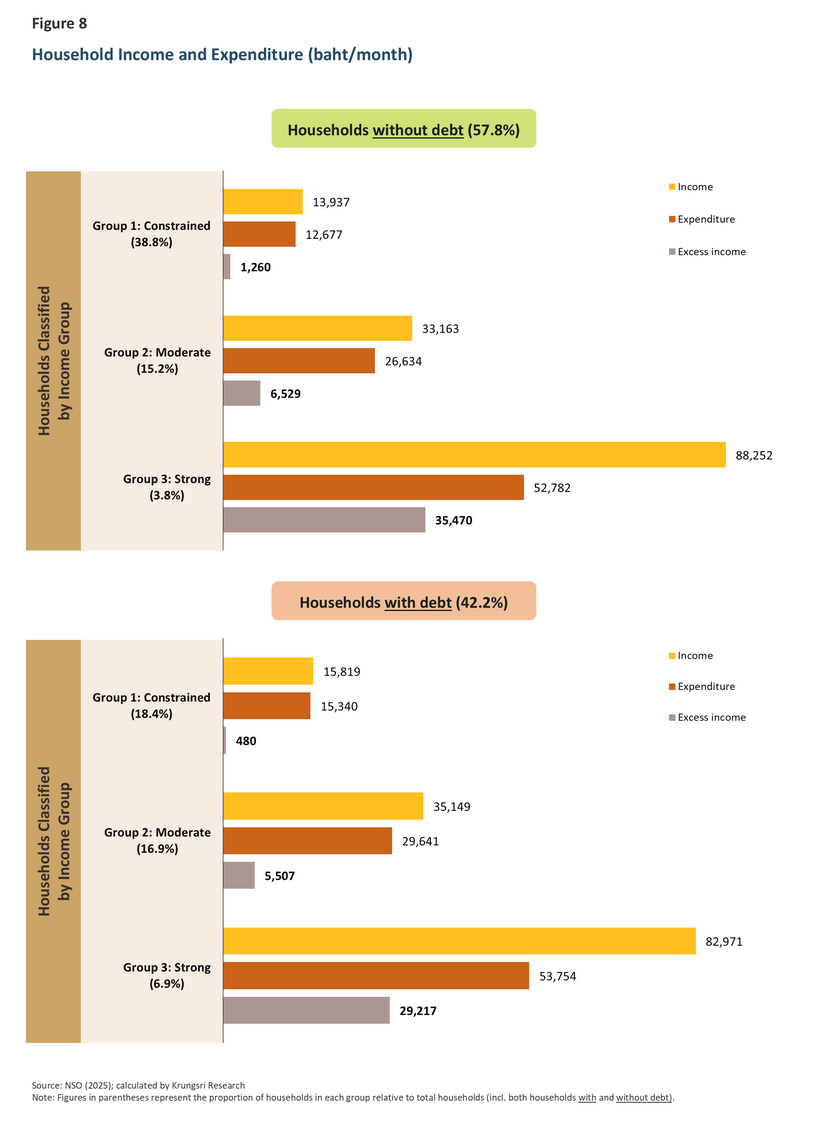
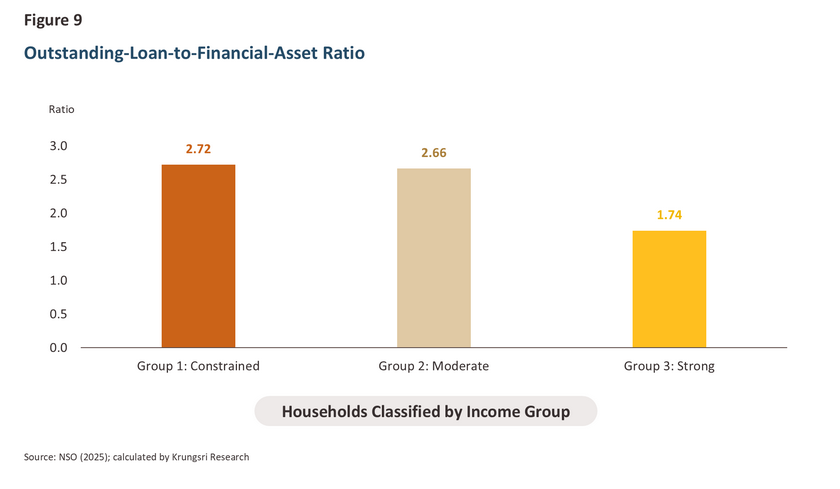
Household financial buffers serve as indicators of households’ ability to cope with price and income fluctuations during the crisis. Such buffers are assessed based on 1) excess income, measured by the difference between monthly income and expenditures, and the outstanding-loan-to-financial-asset ratio, which reflects financial liquidity and the ability to bear the debt burden during the crisis.
-
“Constrained households” (Group 1): Households in this group have almost no financial buffers to support spending when the cost of living and/or revenue abruptly fluctuate (Figure 8). “Constrained households” without debt have excess income of just 1,300 baht/month. Meanwhile, those with debt have even lower excess income of less than 500 baht/month (2.6 times lower than those without debt) and an outstanding-loan-to-financial-asset ratio that is 2.7 times higher than those without debt (Figure 9). This reflects their low liquidity and limited ability to manage expenses and debt during a crisis.
-
“Moderate households” (Group 2): Households in this group have some financial buffers, thereby enabling them to deal with fluctuations in the cost of living and revenue to some extent in the short term. However, if the crisis persists and living costs continue to rise, “Moderate households” may struggle to adjust due to limited financial liquidity and debt burden (Figure 9), as reflected in an outstanding-loan-to-financial-asset ratio that is close to that of Group 1.
-
“Strong households” (Group 3): Households in this group have relatively high financial buffers of 30,000–35,000 baht/month and face lower liquidity constraints relative to their debt burden than other groups, thereby enabling them to better withstand fluctuations during a crisis.
Krungsri Research View: The Lower the Household Income, the Harder the Hit
Considering the impact of the energy crisis on Thai households in terms of expenditure, revenue and financial buffers, we found that households across income groups face varying degrees of risk from the “Household Cost-Income Squeeze.” Households in Group 1, or “constrained households,” are more exposed to the risk. This is because they 1) face higher living costs corresponding to energy prices, especially spending on necessary goods, 2) are employed in sectors sensitive to the energy crisis, which could lead to reduced working hours and wages, or even layoffs, further aggravating their already weak purchasing power, and 3) have limited financial buffers to handle fluctuations in the cost of living and revenue, which could eventually lead them to sell assets, draw on savings, or take on additional loans.
Looking at the overall picture, the “Household Cost-Income Squeeze” may affect Thai aggregate private consumption to some extent. Although households in Group 1, or “constrained households,” with and without debt, account for 57.2% of total Thai households, their share of aggregate consumption is 34.3%. Meanwhile, other groups, such as “moderate households” (Group 2) without debt and “strong households” (Group 3), still have greater capacity to cushion the blow and maintain spending levels, thereby helping to underpin aggregate consumption and mitigate the impact of the energy crisis to some extent. However, it is crucial not to overlook the fact that aggregate consumption, while still expanding, may mask the difficulties faced by “constrained households.”
Ultimately, regardless of how the current energy crisis evolves, households’ vulnerability to simultaneous pressures from both the expenditure and revenue sides remains a key long-term challenge. Cost-of-living relief measures may help households cope with these pressures only in the short term. At the same time, to address this issue in the long term, we should strengthen household resilience to economic shocks by enhancing the social safety net, promoting financial literacy, and supporting skills development at all ages. In addition, supply-side policies, such as promoting high-technology investment, will help generate high-value-added jobs and enhance wage levels in the future, and, in turn, enable households to better withstand simultaneous pressures from both the expenditure and revenue sides.
References
CEIC. (2026). Consumer Price Index: Y-o-Y Growth: Monthly [Database]. Retrieved from https://insights.ceicdata.com/node/WORLD__WORLD&&WGEM__TP74383__SC74577__TB4201517
Investing.com. (2026). Dubai crude oil Platts [Database]. Retrieved from https://www.investing.com/commodities/dubai-crude-oil-platts-futures
National Statistical Office (NSO). (2025). The Household Socio-Economic Survey 2015-2025 [Unpublished raw data].
Trade Policy and Strategy Office (TPSO). (2026a). Consumer Price Index (CPI) [Database]. Retrieved from https://index.tpso.go.th/cpi
Trade Policy and Strategy Office (TPSO). (2026b). Producer Price Index (PPI) [Database]. Retrieved from https://index.tpso.go.th/producer-price-index