Introduction
Deglobalization has emerged as one of the key megatrends shaping the global economic and trade landscape. It is driven by a confluence of economic and social factors, most notably the international trade policy uncertainties and intensifying geopolitical conflicts. In particular, merchandise trade is likely to bear a greater impact from this trend than commercial services trade.
With global trade growth slowing and facing increasing protectionist measures, ASEAN—positioned as a critical production hub within global value chains—will inevitably encounter challenges to its export competitiveness. Nonetheless, ASEAN retains considerable strengths in the services sector, which is expected to play a growing role in driving economic activity and mitigating risks associated with reliance on goods exports.
This study therefore aims to examine the underlying drivers of deglobalization, explore the evolving dynamics of global trade in goods and services1/, and assess the role of services trade as both an economic buffer and an engine of growth for ASEAN economies in the period ahead.
Definition, Driving Factors of Deglobalization, and the Dynamics of Global Trade and Services
Globalization refers to the process through which an increasingly free flow of ideas, people, goods, services, and capital leads to the integration of economies and societies2/ Since the end of World War II, globalization has played a pivotal role in driving global economic growth, as reflected in the steady rise of the total global trade value3/ to world GDP (Figure 1).
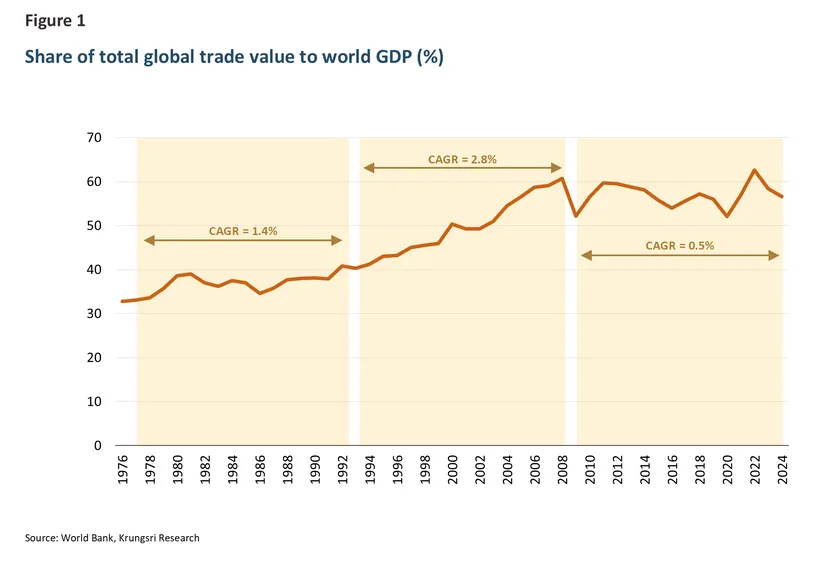
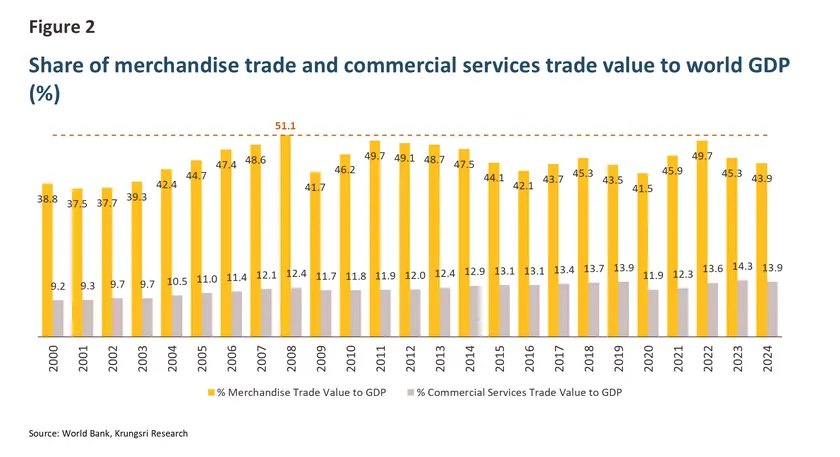
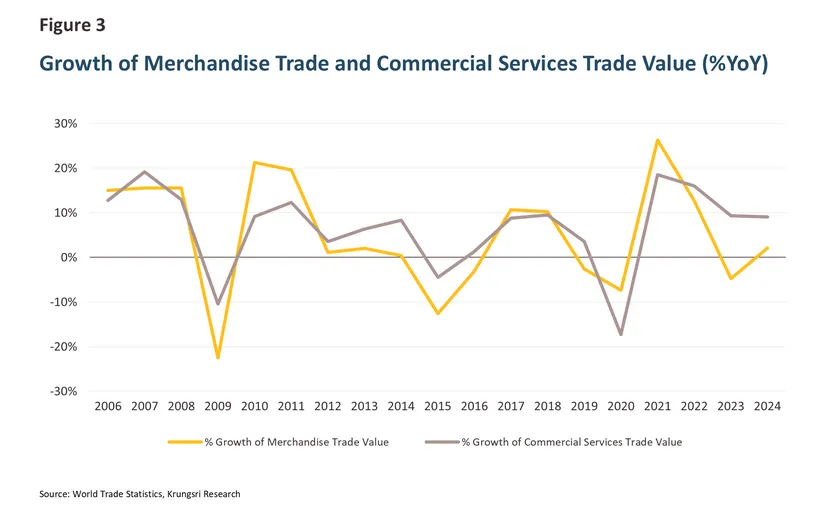
However, following the Global Financial Crisis in 2008, global trade as a share of GDP expanded at an average annual rate (CAGR) of only 0.5%, a sharp deceleration compared with the 2.8% annual growth recorded between 1993 and 2008. This slowdown has been primarily driven by weaker growth in merchandise trade (Figure 2). In contrast, trade in services has grown at a faster pace, although it still accounts for a smaller share of global GDP compared with merchandise trade. Notably, since 2022, in the aftermath of the COVID-19 pandemic, the value of global services trade has consistently outpaced the growth rate of merchandise trade (Figure 3).
The slowdown in global trade has sparked widespread discussion of “Deglobalization” in various international trade forums. The underlying causes behind the deceleration in global merchandise trade can be broadly categorized as follows:
1. The Rise of Protectionist Trade Policies
In the aftermath of the Global Financial Crisis, slower economic growth pressured many countries to adopt inward-looking policies, emphasizing domestic economic stimulus over international engagement. This shift has been accompanied by implementation of both tariff and non-tariff measures aimed at protecting domestic industries and reducing dependence on international trade. Protectionist measures, together with reshoring investment policies, have assumed a more prominent role in the current global trade arena as a means of strengthening domestic economic resilience.
2. Escalating U.S.–China Trade War
The trade conflict between China and the United States, which began in 2018, has intensified significantly under the second term of President Donald Trump . This escalation has been marked by the imposition of reciprocal tariffs and high sectoral tariffs on Chinese products as well as on goods from other countries running trade surpluses with the United States. Moreover, elevated tariff rates have been deployed as bargaining tools to secure greater market access for U.S. exports. These measures have heightened volatility in global merchandise trade and amplified risks stemming from the uncertainty of international trade policy.
3. The Shift of Global Supply Chains
The restructuring of global supply chains, with the objective of enhancing resilience and reducing vulnerabilities to supply chain disruptions, has become more pronounced. Such concerns came to the forefront during the COVID-19 pandemic, when shortages of goods and logistical bottlenecks became widespread. Moreover, intensifying geopolitical tensions have reshaped the patterns of global trade and production networks. This has led to greater emphasis on friendshoring—shifting production to allied economies—and regionalization, whereby supply chains are increasingly concentrated within regional blocs. These adjustments aim to lower transportation costs while reinforcing the stability of trade partnerships.
Looking ahead, if global trade tensions persist and protectionist measures continue to focus primarily on goods exports and imports, the merchandise trade sector will remain the most exposed. By contrast, trade in services is likely to be relatively less affected—a point that will be elaborated in the following section.
Why Services Trade Is Relatively More Resilient to Deglobalization?
Beyond the fact that trade in services has continued to expand at an accelerating pace—underscoring its strong growth potential—this trend also reflects the sector’s resilience and adaptability in the face of deglobalization pressures and trade policy uncertainty. A key reason lies in the distinctive characteristics of services trade, which set it apart from merchandise trade:
1. Lower Degree of Substitution Relative to Goods Trade
Services trade is less exposed to substitution effects, meaning it is inherently more difficult to substitute than goods trade. Many types of services possess unique characteristics that make them hard to replace. Examples include: (1) Services tied to a specific location, such as tourism, personal services, and transport services, which must be delivered on-site. (2) Language and cultural barriers, which reinforce consumer loyalty to local providers. (3) The importance of credibility and reputation linked to the provider’s location, which further raises switching costs. By contrast, merchandise trade typically faces intense competition from substitute goods with similar properties, which can be produced in other countries at relatively low cost. This substitution effect has become more evident following the imposition of higher U.S. tariffs, which has altered global trade patterns in merchandise.
2. Technological Advancements and Shifts in Consumer Behavior
Rapid technological progress and increasing consumer acceptance of digital services have enhanced the adaptability of the services sector. As a result, services trade is less vulnerable to uncertainties in international trade policy compared with goods production. Digital services, particularly in finance and business process outsourcing, can serve global clients without geographic limitations, leveraging distributed labor and service delivery systems across multiple countries. In contrast, manufacturing sector remains heavily reliant on physical investment—such as factories, warehouses, and other location-specific infrastructure—making it less flexible and more exposed to trade policy disruptions.
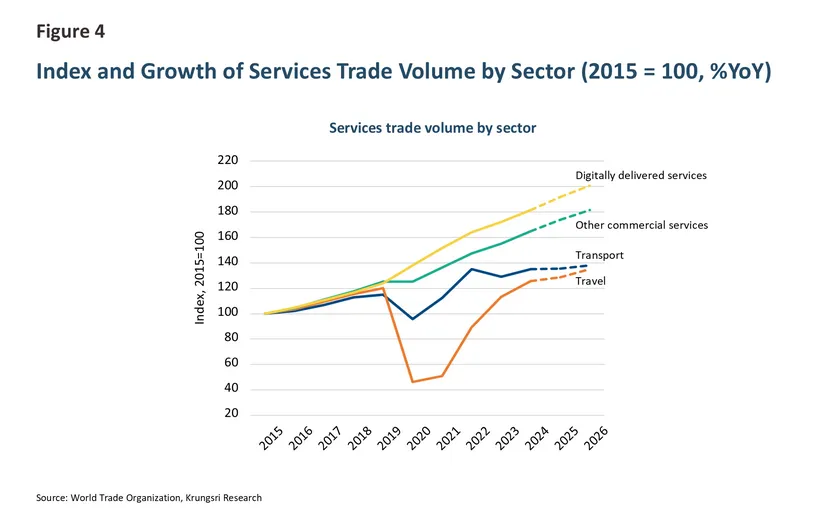
In the near term, services trade is expected to remain on a solid growth trajectory, even though certain subsectors may face some impact from U.S. reciprocal tariffs. According to the World Trade Organization (WTO)4/ , transportation services, for instance, could experience such effects. Nevertheless, aggregate services trade5/ is projected to grow by 4.0% in 2025 and 4.1% in 2026, outperforming merchandise trade, which is forecast to contract by 0.2% in 2025 before recovering to 2.5% growth in 2026. Within services, digitally delivered services—notably in technology, finance, and insurance—are expected to post the most dynamic expansion (Figure 4).
The services sector is set to play an increasingly important role in driving the global economy over the next 1-3 years, particularly as merchandise trade continues to face heightened risks from uncertain trade policy. At the same time, services trade is being bolstered by the ongoing transition toward a digital economy.
In the ASEAN context, services trade represents a key regional strength, especially in tourism and transportation. Moreover, ASEAN holds significant opportunities to further develop high value–added digital services, which will become another crucial driver of the region’s economic growth in the coming years.
Services Trade: ASEAN’s Economic Buffer and Growth Engine
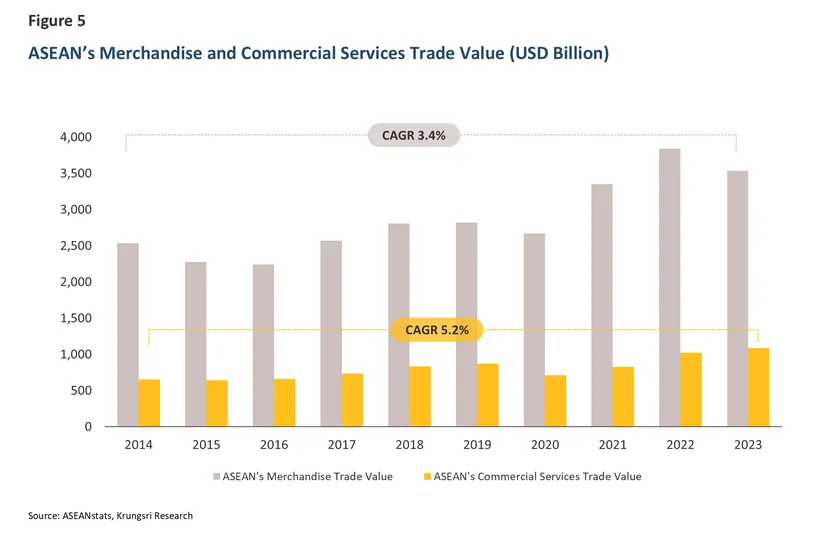
ASEAN’s services trade has exhibited robust growth. In 2023, the region’s total services trade6/ reached USD 1.1 trillion, equivalent to only about one-third of ASEAN’s merchandise trade value.7/ Nevertheless, between 2014 and 2023, services trade expanded at a compound annual growth rate (CAGR) of 5.2%, outpacing merchandise trade, which grew at an average annual rate of 3.4% over the same period (Figure 5). This performance is consistent with the broader global trend, where services trade has also demonstrated strong and sustained growth.
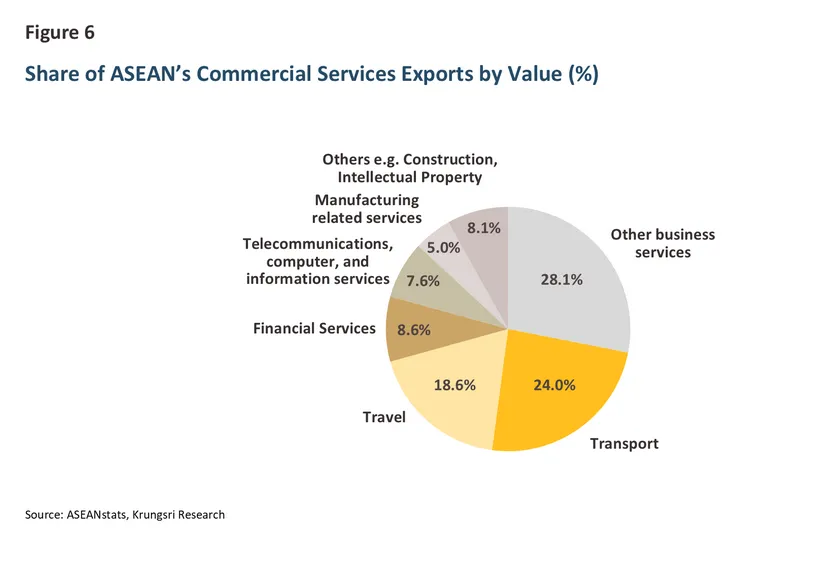
Focusing on exports, services exports stand out as another strength of the ASEAN economy. In 2023, ASEAN’s services exports amounted to USD 550 billion, having grown at a compound annual growth rate (CAGR) of 7% since 2015. The largest contributor is business services—including business consulting and professional services—which account for about 28% of ASEAN’s total services exports. This is followed by transport services (24%) and tourism (19%), respectively (Figure 6).
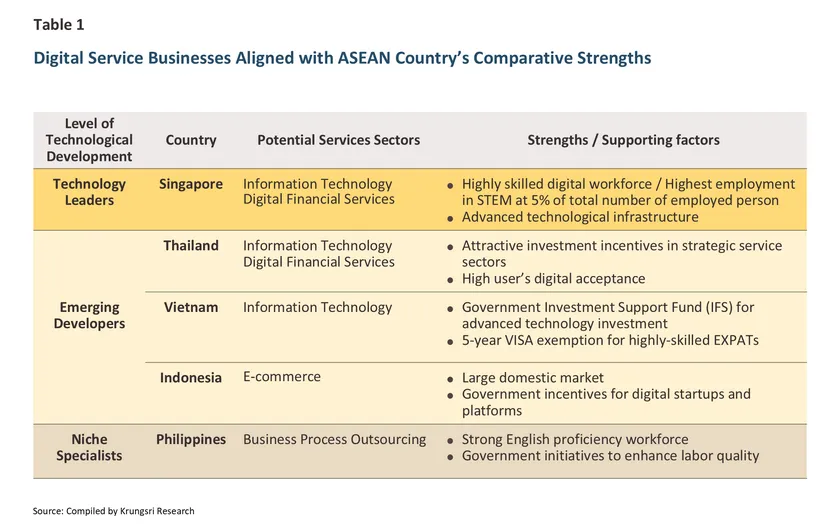
Digital services aligned with global megatrends—such as online financial services, business services, and computer-related services—are set to play an increasingly important role in driving ASEAN’s economic growth. Many ASEAN countries are actively promoting investment in digital service industries in line with their respective national strengths (Table 1). These can be broadly categorized into three groups based on the level of technological development:
Group 1: Technology Leaders
Singapore, with its advanced technological infrastructure and highly skilled digital workforce, has established itself as the region’s leading provider of information technology and financial technology (FinTech) services.
Group 2: Emerging Developers
Thailand, Vietnam, and Indonesia are in the process of building their digital infrastructure, with governments playing a pivotal role in encouraging investment—particularly in computer-related industries such as data centers and cloud services. Indonesia, in particular, benefits from a large domestic population that underpins the rapid growth of e-commerce and digital platforms.
Group 3: Niche Specialists
The Philippines has positioned itself as a hub for business process outsourcing (BPO), leveraging its workforce’s strong English proficiency and government initiatives to enhance labor quality. While the Philippines has placed relatively less emphasis on large-scale infrastructure investment, its specialized capabilities in BPO remain a competitive strength.
Regional cooperation frameworks aimed at deepening integration in the services sector have become a critical enabler of ASEAN’s services trade. Key initiatives include the ASEAN Trade in Services Agreement (ATISA) and the ASEAN Services Facilitation Framework (ASFF), both of which seek to reduce barriers and expand opportunities for trade and investment in services. In addition, ASEAN has set ambitious targets under the Digital Economy Framework Agreement (DEFA), which aims to raise the value of the region’s digital economy to USD 2 trillion by 2030, thereby fostering the expansion of ASEAN’s digital services sector.
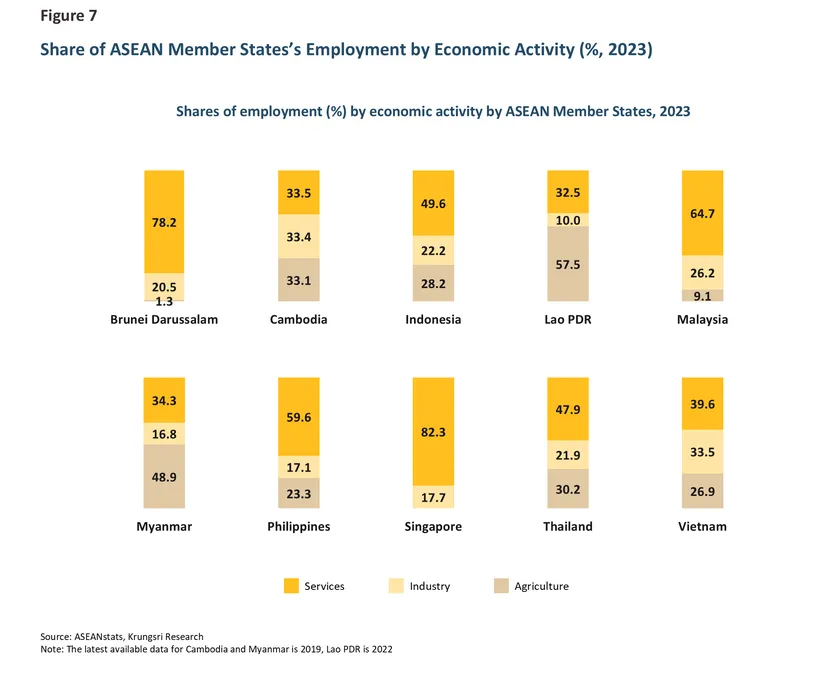
Beyond its importance to ASEAN’s trade, the services sector also contributes the largest share of value added to the regional economy compared with agriculture and manufacturing8/ This is because services generate more localized economic activity, whereas manufacturing supply chains are increasingly fragmented. Moreover, the services sector accounts for the highest share of employment in nearly all ASEAN countries (except Lao PDR) (Figure 7). This underscores the sector’s potential to serve as an internal driver of ASEAN’s economic resilience, particularly amid escalating trade tensions and uncertainty surrounding global trade policies.
Krungsri Research View
Deglobalization is one of factors contributing to the slowdown in global trade growth, particularly in the merchandise sector, which is facing intensifying risks from trade tensions and heightened uncertainty in international trade policy. In contrast, although services trade still accounts for a smaller share compared with merchandise trade, it has expanded robustly—especially since 2022, in the aftermath of the COVID-19 pandemic. Services trade has consistently outpaced merchandise trade growth, underscoring its potential to serve as an alternative engine of economic growth and a means of diversifying risks away from heavy dependence on goods trade.
From a regional perspective, ASEAN is not only a major production base within global value chains but also possesses notable strengths in services exports, particularly in the fast-developing digital services sector. Krungsri Research has assessed ASEAN’s services trade potential through a SWOT analysis, as shown in Table 2.
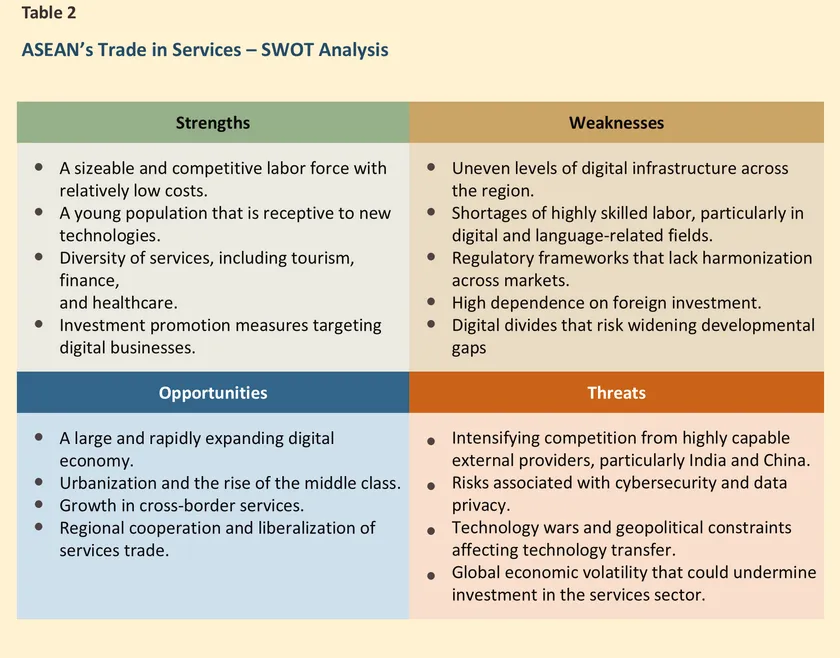
According to SWOT analysis, ASEAN’s services sector offers significant potential, driven by its strengths and opportunities, yet important constraints remain that could become bottlenecks to enhancing competitiveness. Accordingly, ASEAN should prioritize three strategic areas:
-
Upgrading core services strengths—such as digital financial services, medical services, and wellness tourism—to create greater value-added.
-
Strengthening foundational enablers—including investment in human capital, digital and physical infrastructure, and harmonization of service-related regulations across the region.
-
Promoting technology-driven services—such as IT outsourcing and computer-related services—to capture opportunities arising from global megatrends.
Accelerating the development of high-potential services, alongside investment in technological infrastructure, will elevate the role of services as a key driver of ASEAN’s economic growth. This will not only reduce reliance on merchandise exports but also enhance regional value creation. Ultimately, services development will function both as a “buffer” and a “new engine” of growth, strengthening ASEAN’s resilience in the face of rising global trade uncertainty.
References
Asian Development Bank. (2020, April). Services, Value Added in Asia and the Pacific, Asian Development Outlook. Retrieved from https://data.adb.org/dataset/services-value-added-asia-and-pacific-asian-development-outlook
The Association of Southeast Asian Nations (ASEAN). (2024, December). ASEAN Key Figures 2024. Retrieved from https://asean.org/serial/asean-key-figures-2024/
World Trade Organization. (2025, April). Global Trade Outlook and Statistics. Retrieved from https://www.wto.org/english
/res_e/publications_e/trade_outlook25_e.htm
1/ Data on the services sector are subject to several limitations, as existing collection methods may not fully capture the actual scope of services provided—particularly small-scale activities that take place within the informal sector. Moreover, the measurement of the volume and value of services activities varies considerably across service categories. In addition, the compilation of services trade data within ASEAN remains incomplete and may not yet provide a fully comprehensive picture.
2/ IMF,2002
3/ Total exports and imports of merchandise and commercial services trade
4/ Global Trade Outlook and Statistics, World Trade Organization (April 2025)
5/ Trade Volume
6/ Sum of total exports and imports
7/ ASEAN’s total merchandise trade value in 2023 was at USD 3.5 trillion
8/ ข้อมูลปี 2018 Value Added in Asia and the Pacific, Asian Development Outlook 2020