2026-2028 THAILAND INDUSTRY OUTLOOK
The overall outlook for Thailand’s industries considers both opportunities and challenges that reflect the business attractiveness of each sector. This assessment is based on macroeconomic conditions and structural shifts that are expected to influence business and industry trends over the next three years.
The macroeconomic environment
-
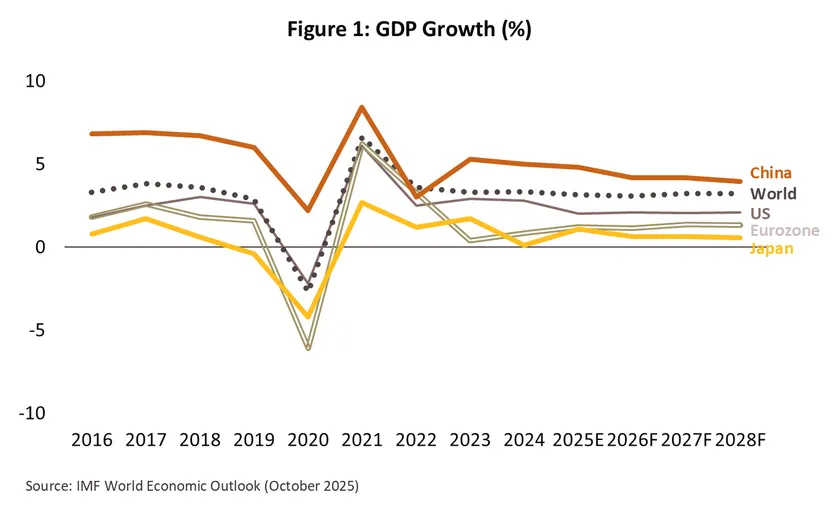
Global economy in 2026-2028 may grow modestly amid trade wars and geopolitical tensions: The global economy in the next 3 years is expected to remain subdued at 3.2%, close to 2025 growth rate and below the pre-COVID average of 3.7% recorded during 2011–2019. Although fiscal stimulus measures in many countries, along with rising investment in digital sectors and AI, will provide some support, multiple factors continue to weigh on growth. These include trade protectionism, geopolitical tensions, elevated debt levels, and country-specific structural challenges. The U.S. economy is projected to expand modestly by an average of 2.1% per year during 2026–2028, compared to 2.0% in 2025. Higher tariffs and tighter immigration measures will pressure production, jobs, and consumption. AI-related investment should lift productivity over the longer term, but it also carries risks of bubble in speculation market. The Federal Reserve may end its rate-easing cycle by 2026 as inflation edges up, staying within a contained range. Eurozone growth is expected to hover at a low 1.3% per year during 2026-2028, compared with 1.2% in 2025. Germany’s fiscal support and a gradual recovery in tourism and consumption will support growth momentum. However, the drag from U.S. tariff increases and the persistent weakness in manufacturing will limit momentum. The European Central Bank (ECB) may also face increasing constraints in delivering further rate cuts as inflation moves closer to the 2% target. Japan’s economy is projected to grow by only 0.6% per year on average during 2026–2028, down from 1.1% in 2025. The manufacturing sector is expected to remain weak, and exports are likely to slow amid heightened trade tensions and intensifying competition in the automotive industry. Nonetheless, proactive fiscal policies—aimed at easing living costs and promoting investment in strategic industries—should help reinforce Japan’s longer-term growth potential. Chinese economy is projected to grow at a slower pace from 4.8% in 2025 to an average of 4.1% during 2026–2028, as it continues to face multifaceted pressures. These include the real estate crisis, public and private sector debt, excess supply, an aging society, and trade and technology wars. However, key measures to support growth momentum include stimulating consumption and investment, supporting “New Productive Forces,” curbing intense price competition (Anti-Involution), alleviating the government debt, easing monetary policies, investing in infrastructure, and accelerating the recovery of the real estate sector.
-
Thailand’s Economy in 2026–2028: Slow and below potential growth amid both domestic and external headwinds: During 2026–2028, the Thai economy is expected to grow at an average pace of 2.1% per year (Figure 2), close to the subdued growth rate projected for 2025. This marks a significantly lower rate compared with Thailand’s pre-pandemic average of 3.6% during 2010–2019. Several headwinds continue to weigh on medium-term growth momentum:
-
The 19% U.S. tariff on Thai exports, effective since August 2025, combined with the payback effect following front-loaded orders in 2025, is expected to lead to a slowdown in exports. Meanwhile, rising uncertainty of U.S. tariff policy and trend of trade protectionism add further pressure on Thailand’s export-oriented manufacturing and employment.
-
Domestic political uncertainty during the caretaker-government period and the general election in 2026 may disrupt government spending, particularly capital budget expenditure in the first half of the year and may delay the formulation of the FY2027 budget bill.
-
High public debt levels continue to narrow fiscal policy space, limiting the government’s ability to implement additional stimulus measures during 2026–2028.
-
Although household debt has begun to decline, it remains elevated at over 86% of GDP as of the second quarter of 2025—the highest in ASEAN-5—while household income recovery remains slow. This will weigh on private consumption and reduce the effectiveness of future stimulus measures.
-
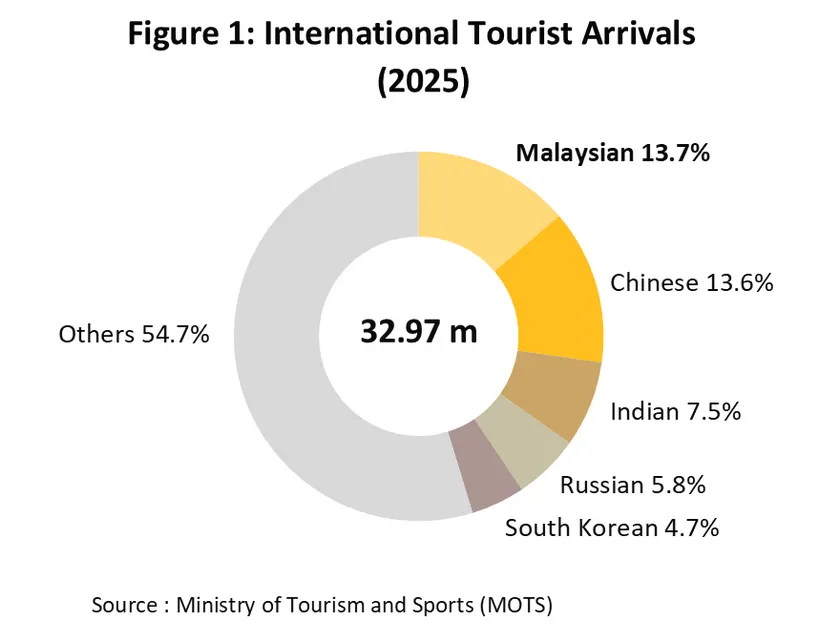
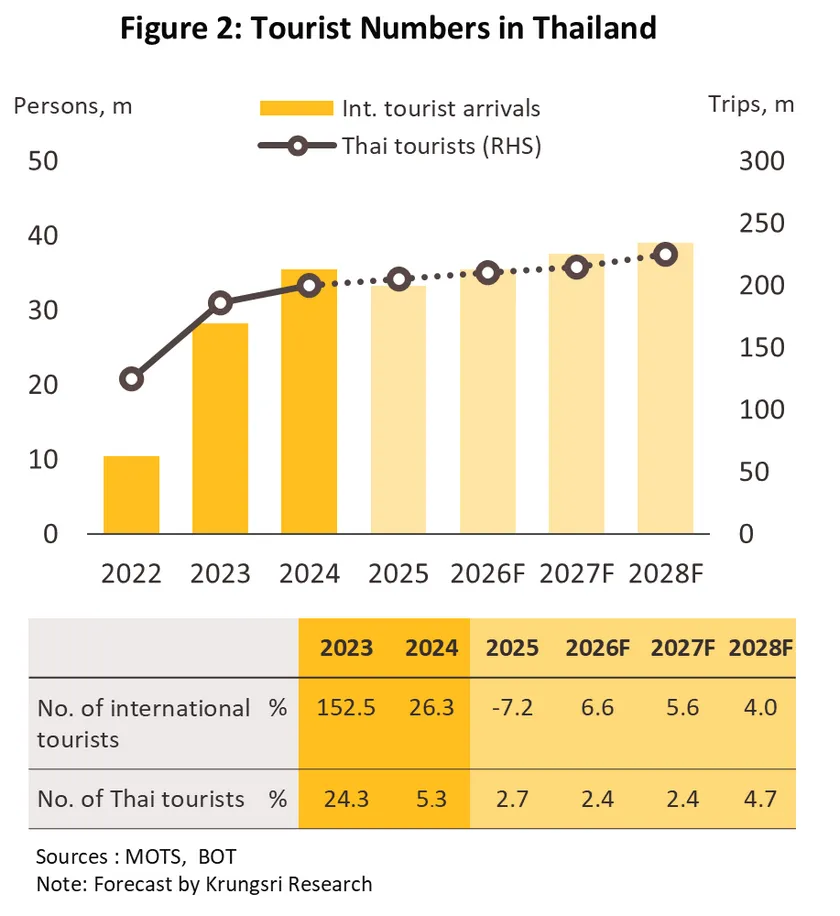
Despite these structural and cyclical challenges, some supportive factors remain. (1) Tourism is expected to recover gradually after contracting in 2025 due to weakened Chinese arrivals driven by safety concerns. A stronger global tourism momentum, together with rising international flight frequencies and new routes from China and India, is projected to boost foreign tourist arrivals to 35.5 million in 2026 and further to 37.5–39.5 million in 2027–2028. (2) Private investment shows some positive signs, supported by a nearly twofold increase in investment applications for BOI incentives to a record-high level, driven by digital industries, electric vehicles, and renewable energy. In addition, the BOI’s “Thailand FastPass” initiative aims to accelerate the realization of roughly THB 480 billion worth of promoted projects approved between 2023 and early 2025, helping to support investment growth in the foreseeable future.
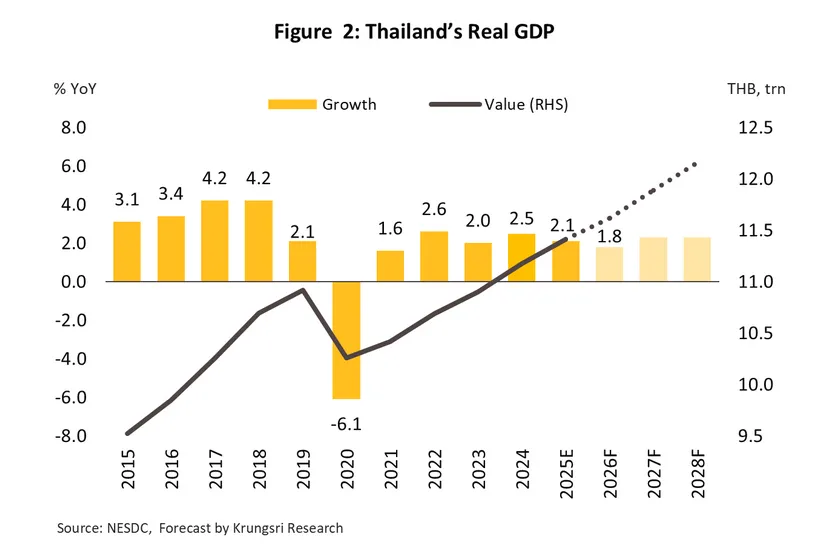
Thailand’s economic outlook over the next three years (2026–2028) points to a gradual and subdued recovery, with growth remaining below the ASEAN-5 average. The IMF projects ASEAN-5 economies to expand by around 4.2% per year, while Thailand is expected to grow at a noticeably slower pace. The outlook is weighed down by several external headwinds, including uncertainty over U.S. trade policy, a slowdown in the Chinese economy, and prolonged geopolitical tensions. Domestically, structural challenges persist—such as declining industrial competitiveness, labor shortages and low labor productivity, as well as elevated household and public debt levels. These factors will continue to constrain private consumption and reduce fiscal policy flexibility. In addition, political uncertainty remains a key risk. Although a general election is scheduled for 2026, any lack of continuity in economic policy or slippage in fiscal discipline could undermine growth momentum and potentially affect Thailand’s sovereign credit rating. Taken together, these pressures suggest that Thailand will continue to operate below its potential growth rate over the medium term.
The Structural shifts shaping the future business and industrial landscape.
-
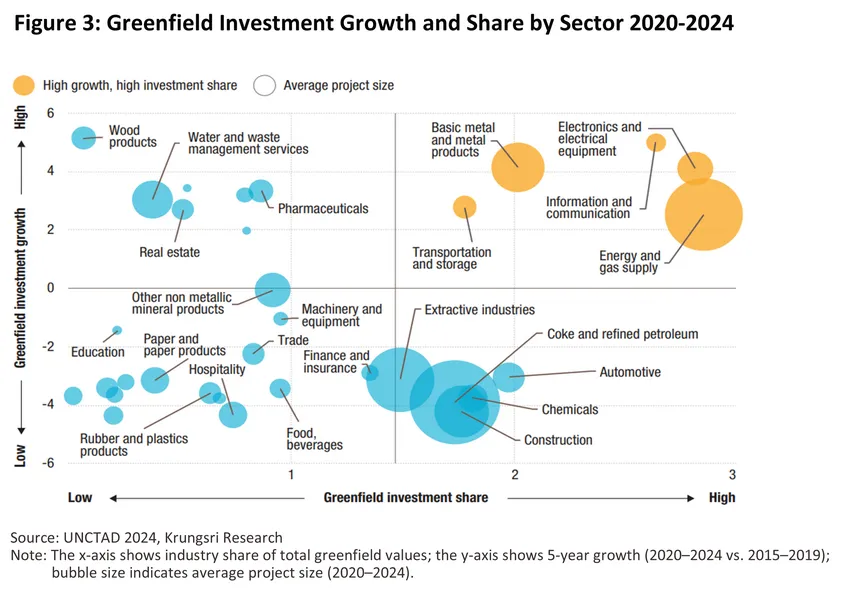
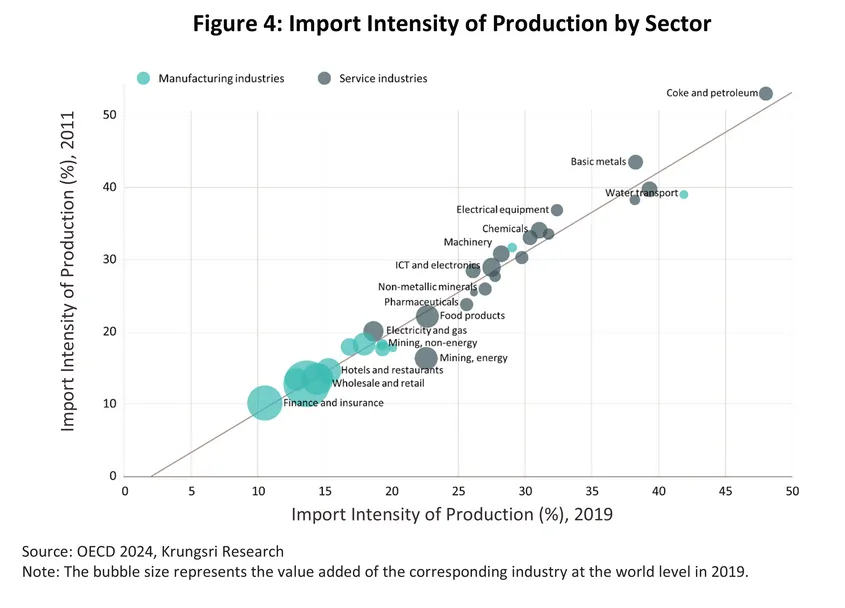
A sustainable-oriented supply chain with a stronger focus on upstream industries: Rising global economic uncertainty and persistent trade protectionism—particularly from the U.S.’s reciprocal tariff policies against multiple trading partners beyond China—along with recurring geopolitical conflicts, have heightened instability in global supply chains. These dynamics are prompting major economies to expand investment bases into developing Asian countries. High-potential industries attracting primarily new (greenfield) investments include modern, technology-driven, and sustainability-oriented sectors such as electronics, IT and digital services, clean energy, and advanced materials supporting smart devices and next-generation vehicles (Figure 3). Most of these industries are in the upstream segment of modern production chains, helping developing Asian countries become more self-reliant—whereas such upstream products previously relied heavily on imports. This trend aligns with the global supply-side adjustment observed even before the COVID-19 crisis, as reflected by the declining import intensity of production for these product groups between 2011 and 2019 (Figure 4). In the subsequent period, foreign direct investment (FDI) flowing into developing Asian countries, including Thailand, has continued to concentrate on upstream industries rather than downstream ones. China has rapidly emerged as a leading source of FDI, rivaling the United States amid intensifying technological competition.
Looking ahead, investment in upstream segments of the production value chain is expected to play an increasingly critical role for developing economies across Asia, to enhance sustainability and resilience amid mounting trade policy uncertainties and escalating technology rivalries.
-
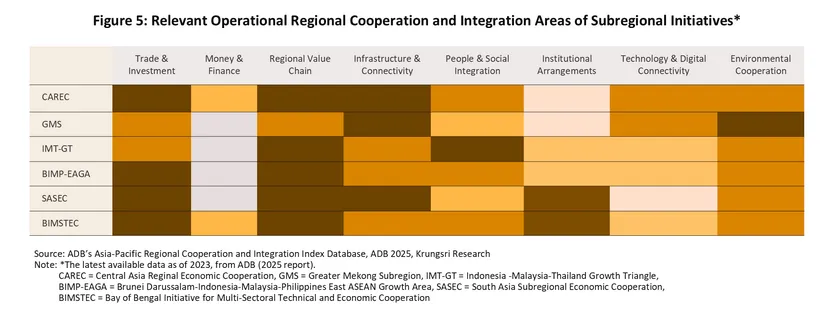
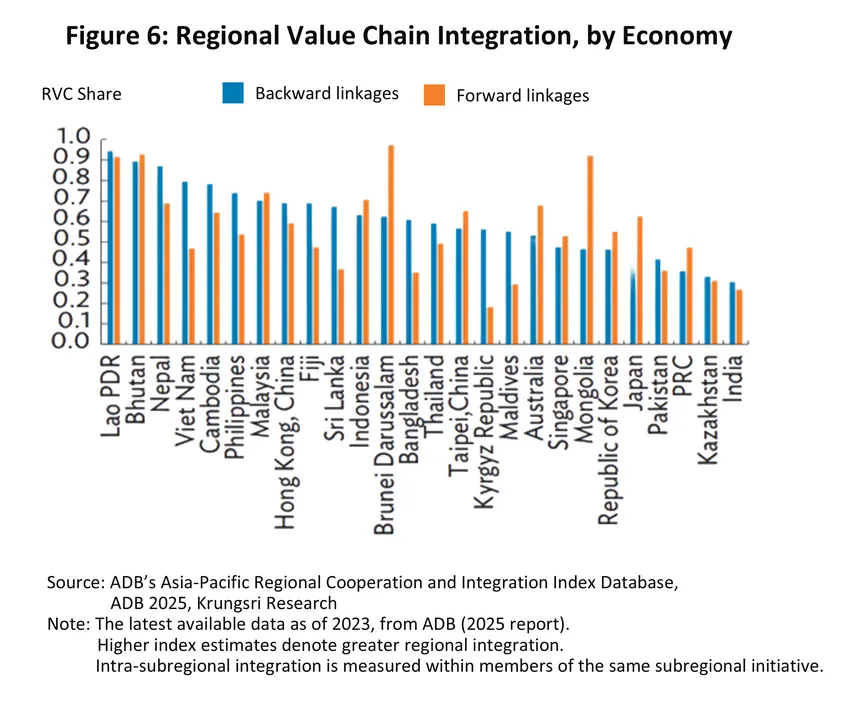
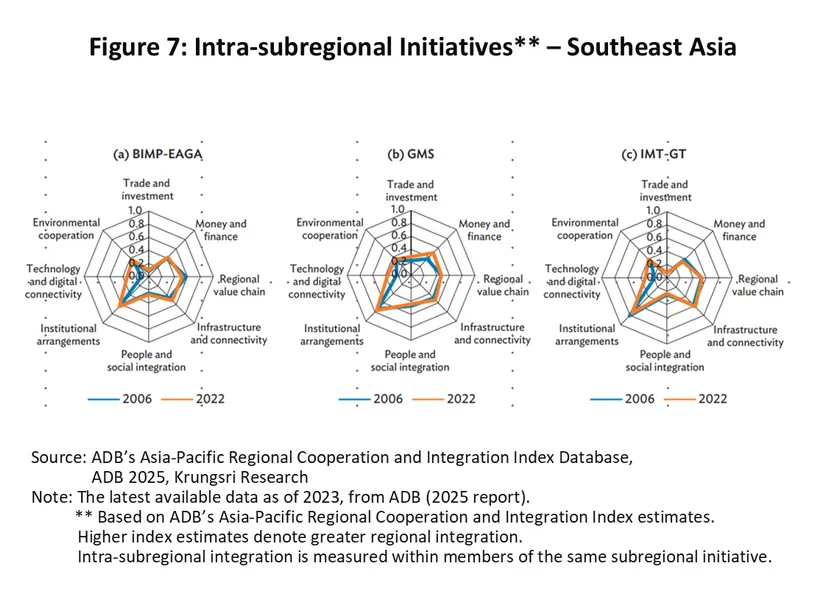
Building value chains through regional cooperation and integration (RCI): Regional alliances and integration are expected to become increasingly important to strengthen collective bargaining power and sustain competitiveness amid intensifying inter-regional trade protection measures. Such regional cooperation will primarily focus on reinforcing regional value chains (Figure 5). Beyond trade collaboration, this also requires broader cooperation in other key areas, including investment, infrastructure, logistics, and environmental management. In the case of Asia, current regional value chain alliances primarily focus on linking strategic industries, including semiconductors, IT and digital technologies, clean energy equipment, medical products, and basic raw materials. The cooperation model emphasizes strengthening the production base in upstream industries (Figure 6). Nevertheless, while trade, investment, and physical infrastructure remain the core pillars of regional cooperation to enhance collective competitiveness, future collaboration is expected to increasingly emphasize technology and digital connectivity within the region. This trend is particularly evident in ASEAN, where cooperation in these areas among member countries has expanded in recent years (Figure 7). Such initiatives aim to support investment in emerging, technology-intensive industries, focusing primarily on fiber-optic telecommunications networks, cross-border data exchange, and other joint digital projects. However, cooperation in this area remains relatively limited, as it is still in the early stages of development.
In the context of the ASEAN Summit 2025, held in late October 2025, discussions emphasized the expansion of digital cooperation among member states. Key priorities included integrating cross-border e-commerce and digital payment systems, enhancing data interoperability, and establishing AI standards to strengthen ASEAN’s readiness for a fully integrated digital economy.
-
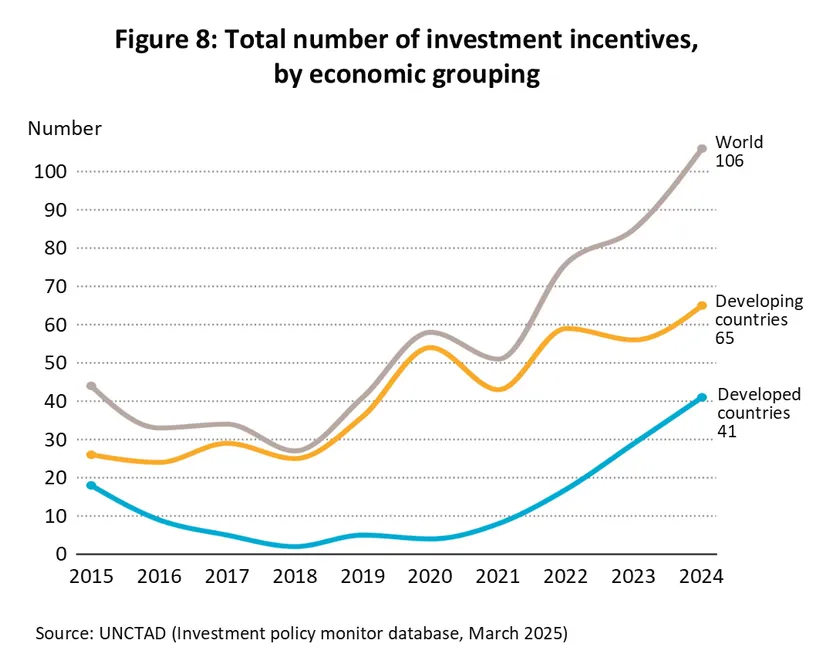
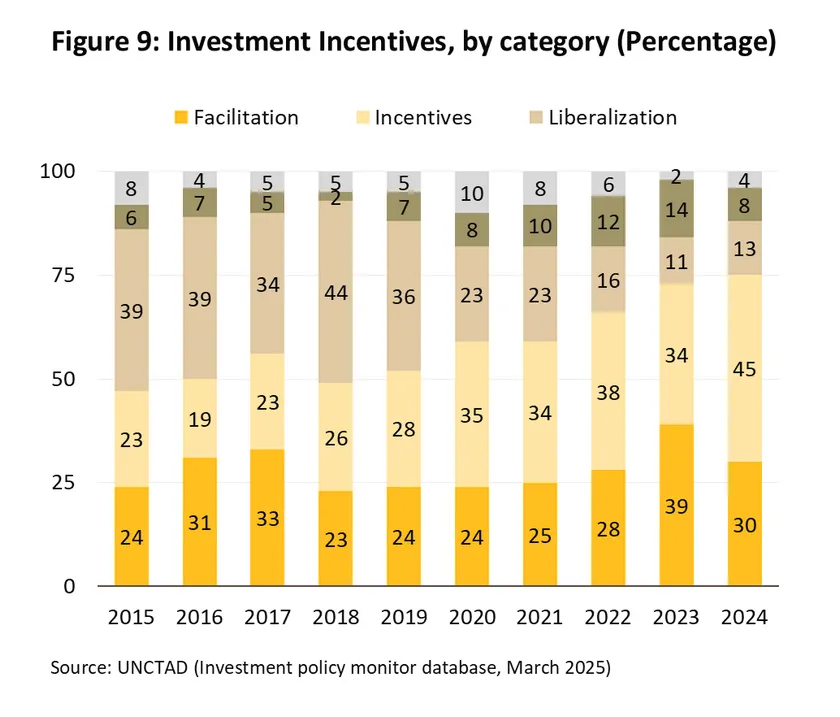
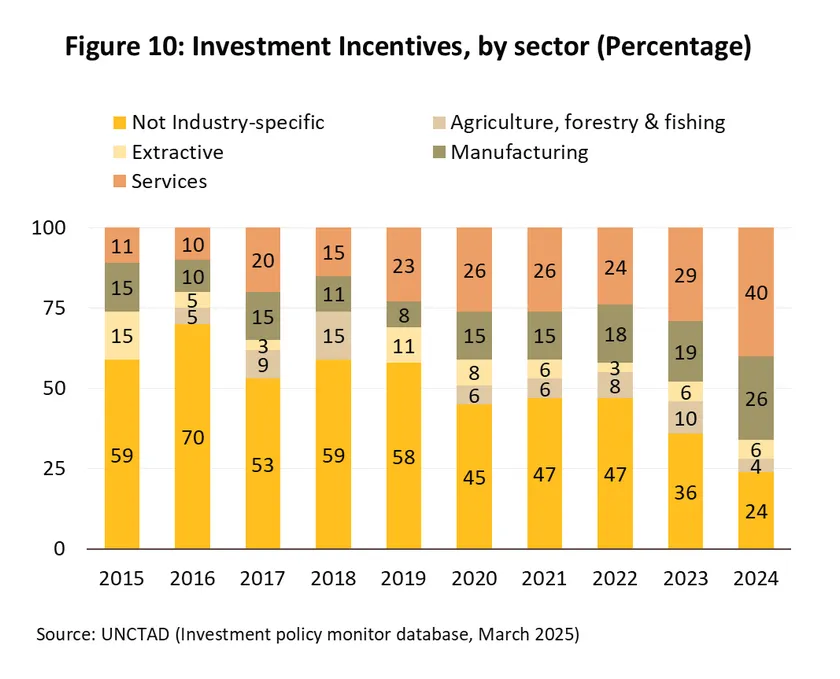
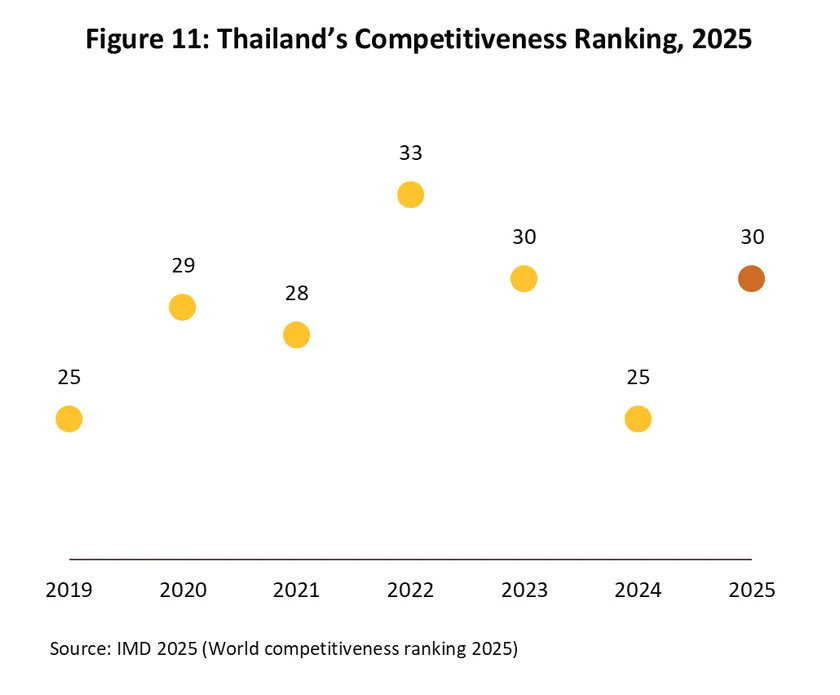
An intensifying investment incentive war to attract investment (Investment incentive war): With major global powers increasingly retreating behind trade barriers, economies that are dependent on their manufacturing base (and especially those in Asia) are having to fight ever more fiercely to attract investment inflows. Countries that find themselves engaged in this new ‘war’ are thus being forced to fight for space using an ever-growing list of tax breaks and financial inducements; data on the incentives offered by developing and newly industrialized countries (Figure 8) shows a global trend towards expanding tax holidays, rate reductions and extensions of preferential periods for investors in both the manufacturing and service sectors (Figure 9 and Figure 10). This race to the bottom is the backdrop to the Organization of Economic Cooperation and Development’s (OECD) decision to introduce the Global Minimum Tax (GMT), which requires participating nations to impose a minimum 15% tax on multinational enterprises with an annual turnover in excess of EUR 750 million. The tax is being rolled out over 2024 and 2025 according to countries’ individual circumstances, but it is hoped that this will help to level the playing field and to promote fairer competition between nations. However, although the GMT should help to deescalate the war over investment incentives, competition between nations to attract investment inflows will continue. In the particular case of Thailand, declining competitiveness will have a strong impact on future policy decisions. Thus, in the 2025 IMD World Competitiveness Ranking, Thailand slipped to 30th position, down from 25th a year earlier (Figure 11), with declines seen in: (i) economic performance (from 5th to 8th), (ii) infrastructure (from 43rd to 47th), (iii) business efficiency (from 20th to 24th), and (iv) government efficiency (from 24th to 32nd). This will therefore likely mean that as it competes on the world stage, the country will have little option but to continue to lean heavily on the use of investment-promotion tools.
-
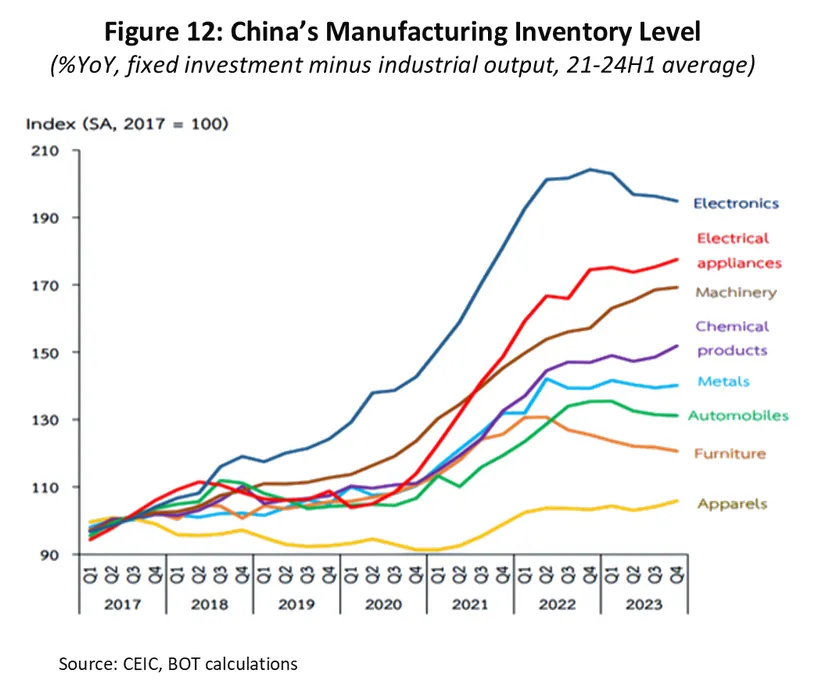
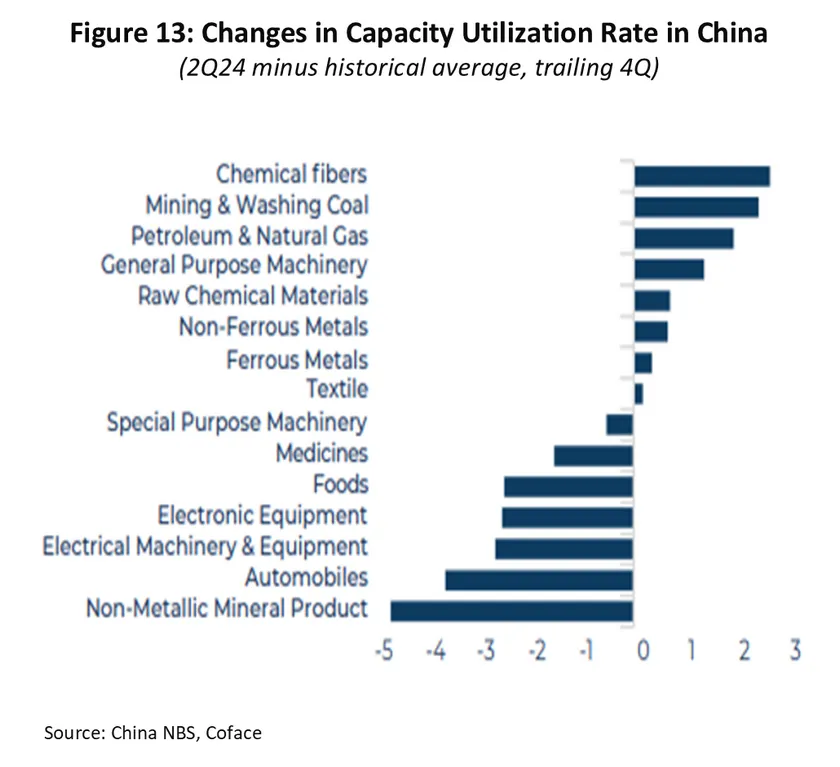
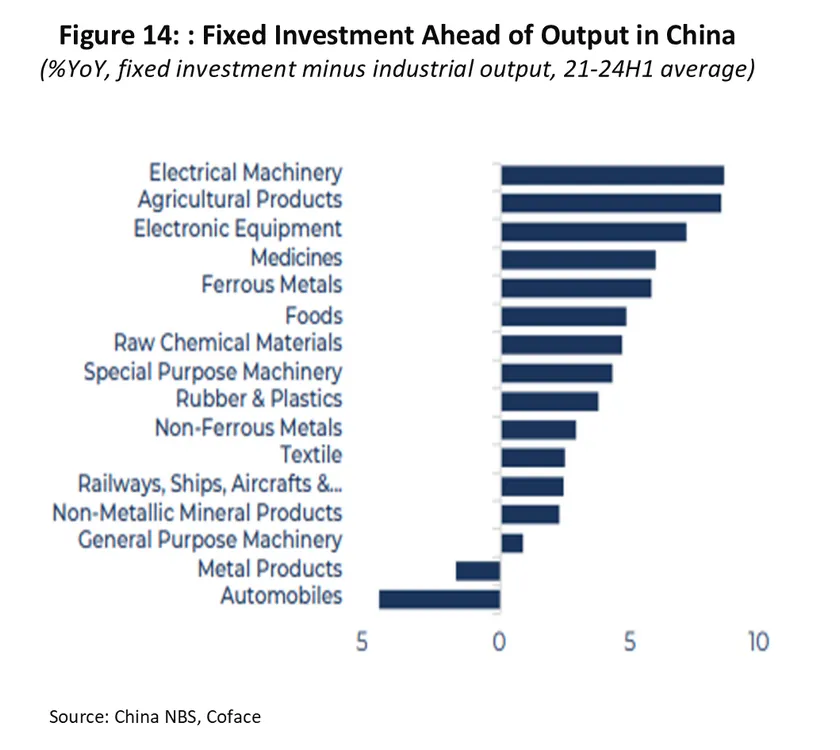
Chinese overcapacity and pressure on local markets: The surge of Chinese goods released to offload excess supply continues to exert pressure on local products around the world. The extent of Chinese industrial overcapacity can be seen in the steady run up in domestic inventories (Figure 12). This aligns with a decline in the capacity utilization and an excess investment in fixed assets. These imbalances are especially clear in technology-intensive parts of the economy, including electronics, EV production and their components, and electrical machinery. It also extends into food processing, pharmaceuticals, and certain chemical products (Figure 13 and Figure 14). This differs from earlier periods, when Chinese overcapacity was largely restricted to the production of commodities (e.g., textiles, steel, and aluminum). Combined with its significant economies of scale and mounting pressure from the intensifying US-China trade war, China has accelerated the export of these excess goods to global markets. As a result, many countries have imposed tariffs to protect their domestic industries. Notably, the US raised import tariffs on Chinese EVs to 102.5%, up from 27.5% (effective September 27, 2025), while the EU increased tariffs on Chinese EVs by 7.8–38.1%, up from 10% (effective July 4, 2025). In addition, both anti-dumping and countervailing duties have become more stringent, particularly on commodities such as metals and plastics.
Going forward, Thai businesses will face two key challenges. (i) The influx of low-cost goods from China will continue to weigh on local manufacturers, especially SMEs that struggle to achieve economies of scale. In addition, there are rising concerns over problems with transshipments, in particular with regard to both Chinese players using Thailand as a re-export base for Chinese goods and the possibility of Thai manufacturers becoming excessively reliant on inputs and materials sourced from China. In either case, there is a risk that US authorities could decide that Thai companies are guilty of ‘origin circumvention’, which would then open them up to potentially harsh retaliatory measures. (ii) China’s relocation of production bases to ASEAN countries, including Thailand, to offload its industrial overcapacity may create opportunities to strengthen certain supply chains but also poses risks to existing domestic industries that cannot compete on costs. Moreover, if Thailand serves merely as an assembly hub dependent on Chinese parts and labor, the benefits to the local value chain will remain limited.
-
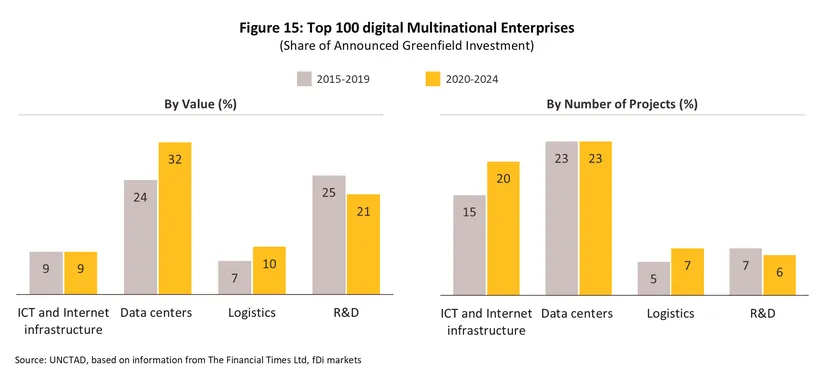
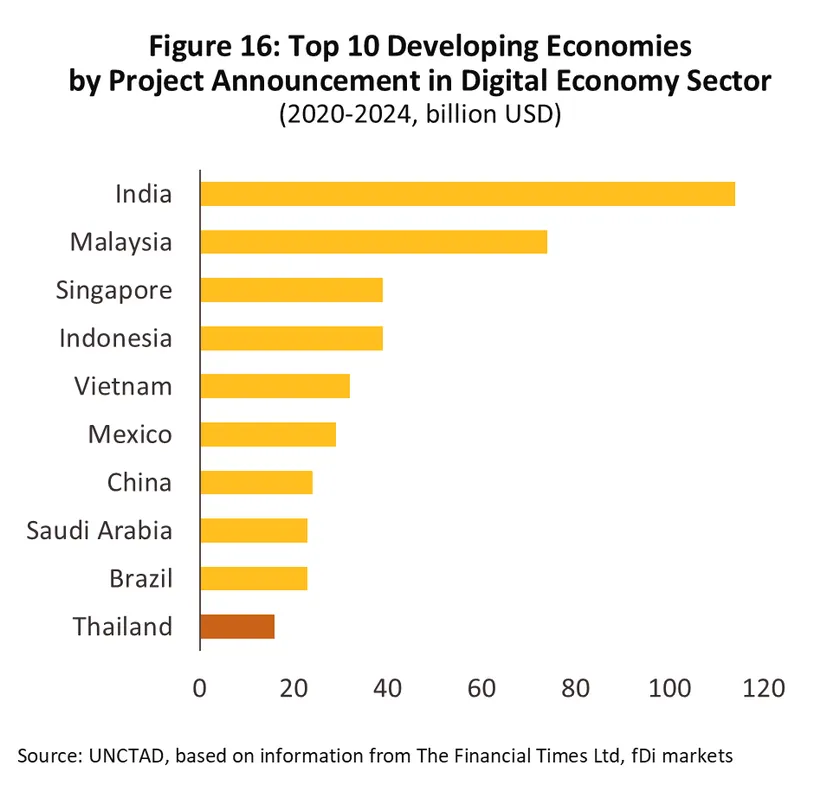
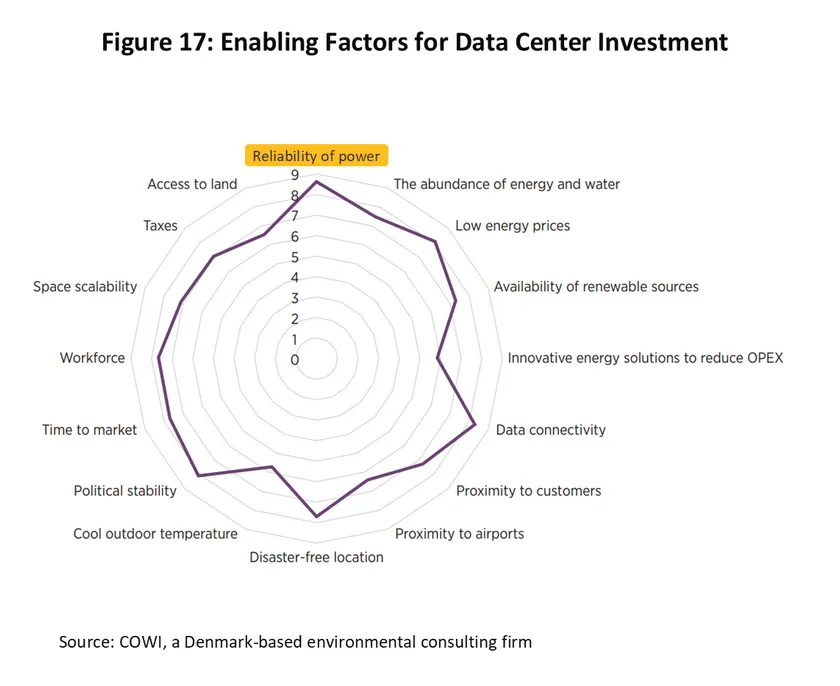
The digital economy as a key driving force behind modern industrial development. Although global foreign direct investment (FDI) has shown signs of deceleration, digital investment continues to expand at an average annual rate of 10–12%, exceeding the growth rate of global GDP. In particular, investment in data center businesses has recorded a higher number of projects and investment value than other new (greenfield) investment projects by multinational corporations in developing countries during 2020–2024 (Figure 15). During this period, Thailand ranked among the top 10 countries with the highest value of data center investment under multinational corporations’ investment plans (Figure 16) (Source: UNCTAD, 2025). Such investment aims to drive new technologies such as AI, cloud computing, and big data analytics, while supporting upstream industries such as electronic devices, semiconductor components, and digital infrastructure, as well as e-commerce businesses to strengthen supply chains in advanced technology industries, including smart electronics, next-generation vehicles, and digital services, in line with Thailand’s targeted industrial strategy. However, alongside these investment opportunities, operational challenges remain, particularly the adequacy of energy supply, which is a critical enabling factor for the success of data center investment (Figure 17). The industry requires clean energy to align with sustainability goals aimed at achieving a fully green society in the future. Yet, Thailand’s renewable energy supply still needs further development to reach sufficient levels that can reduce the unit cost of electricity. Achieving this goal also faces obstacles, including the increasing severity of climate change, such as natural disasters, and delays in establishing clear regulatory frameworks to implement direct power purchase agreements (Direct PPAs) in a timely and practical manner.(Source: Direct PPA: A New Opportunity to Enhance Business Sustainability in Thailand, Krungsri Research, 2025).
-
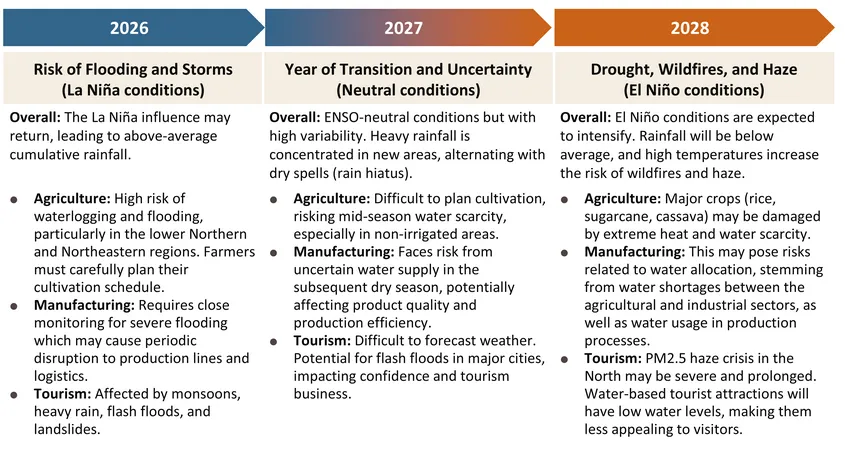
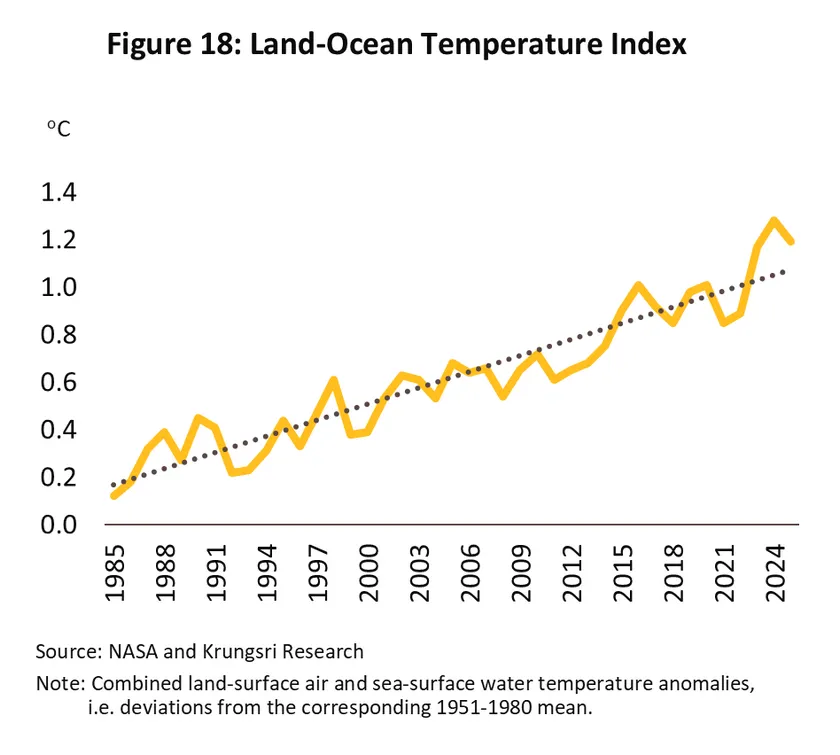
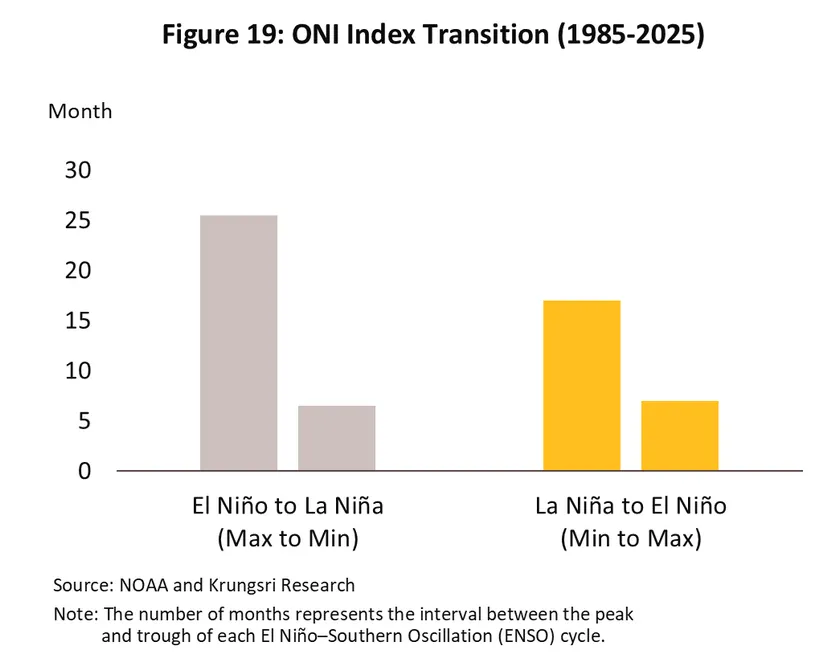
Global climate disruption (GCD), stemming from the shortening cycle of La Niña and El Niño events: The increasing intensity of climate variability due to the accumulation of greenhouse gases in the atmosphere, is not only driving a continuous upward trend in global temperatures (Figure 18) but is also a phenomenon that is currently destroying the balance of the Earth's hydrological cycle. The disruption manifests as a rapid acceleration in the cycle of water evaporation and condensation into rain. The effect of greenhouse gases allows the atmosphere to absorb significantly more moisture before releasing it as severe heavy rainfall (flooding), while simultaneously accelerating the rate of water evaporation (drought). This trend is consistent with the Oceanic Niño Index (ONI) values over the past 40 years (1985-2025), which indicate that the interval between an El Niño event and a subsequent La Niña event has decreased to only 6–8 months (2002-2025) from the previous 24–26 months (1985-2001). Similarly, the interval between a La Niña event and a subsequent El Niño event has also decreased to 6–8 months from the previous 16–18 months (Figure 19).This signifies an alarming risk of extreme, alternating fluctuations between "flooding" and "drought" occurring over shorter timescales and with greater severity.
Between 2026 and 2028, Thailand is likely to face GCD that could severely damage the public and economic sectors. Krungsri Research has assessed the potential impacts of GCD across various industries, from the agricultural sector to related downstream industries, as follows:
- The silver economy and growing wellness trend driving the expansion of modern health-related service value chains.
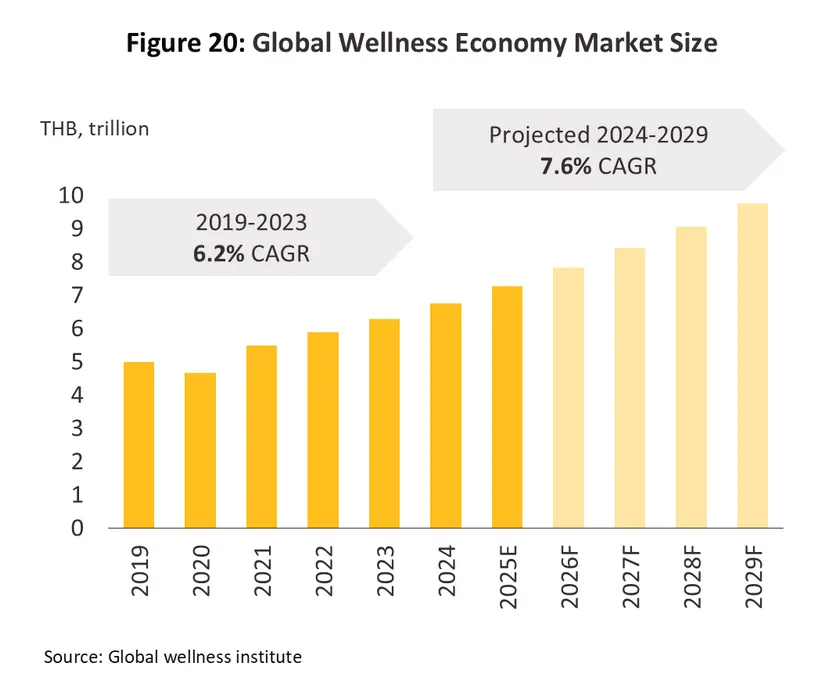
The aging of societies is boosting the development of the ‘silver economy’, while growing demand for health, financial, residential, technology and tourism services targeting the elderly will generate both opportunities and threats for businesses worldwide. On present trends, the global population of over-65s will more than double between 2024 and 2054, rising from the current 0.83 billion to 1.7 billion over this period, with over 1 billion of these in Asia. The latter will thus comprise a major market and businesses targeting this demographic will see opportunities multiply, especially in areas related to healthcare. In line with this, the worldwide value of the silver economy will surge from USD 2.8 trillion in 2024 to USD 5.5 trillion by 2033, which would translate into annual growth of 7.9%4/. These trends are also adding to demand for wellness services, and businesses targeting the silver market will increasingly integrate these into their offerings. As a result, the wellness economy, which encompasses holistic healthcare, physiotherapy and rehabilitation, and lifestyle services, will see strong growth, and the total market should thus expand from a value of USD 6.8 billion in 2024 to USD 9.8 billion by 2029, or by 7.6% annually.
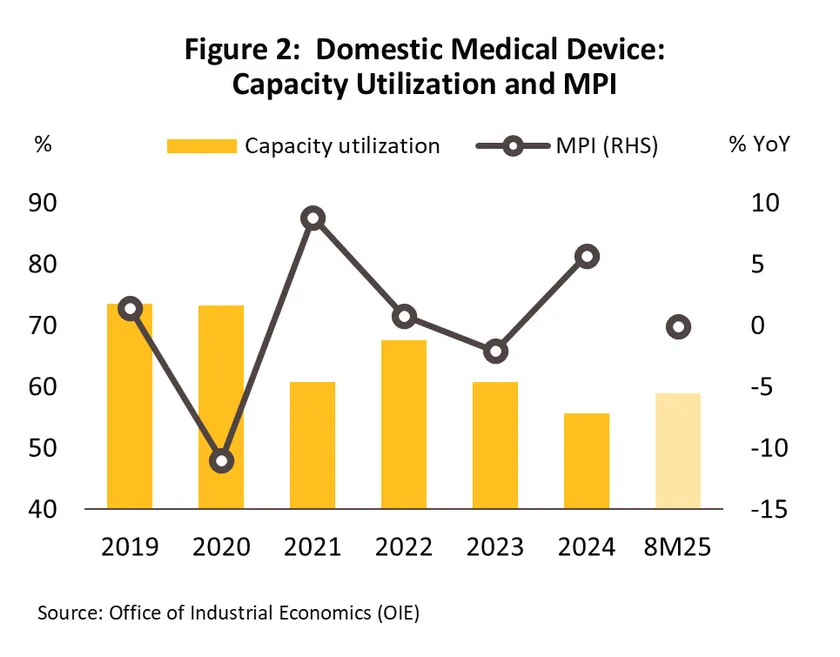
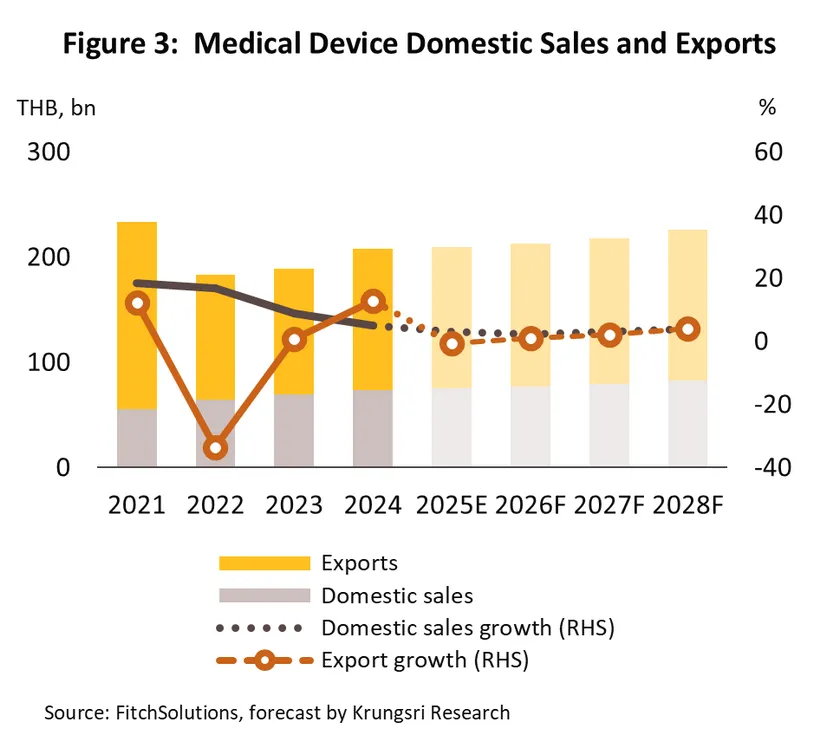
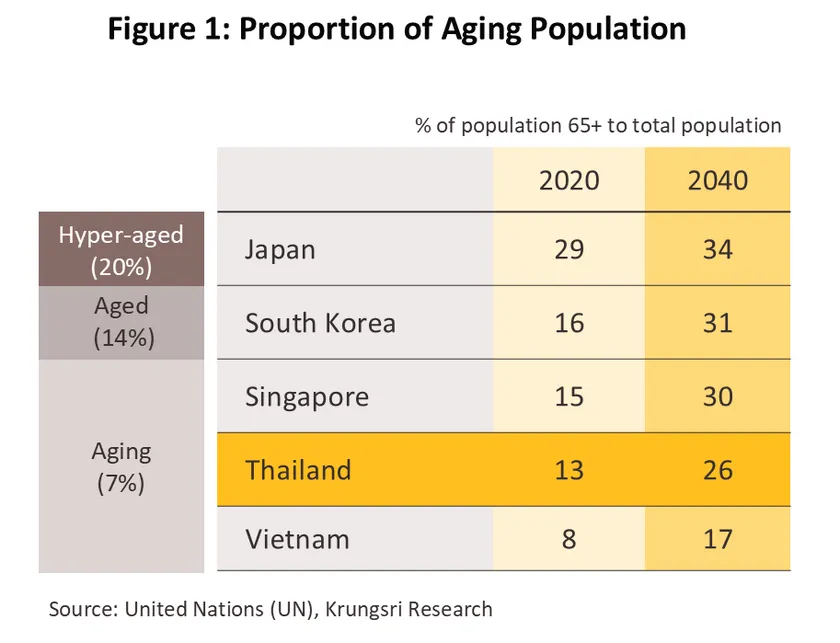
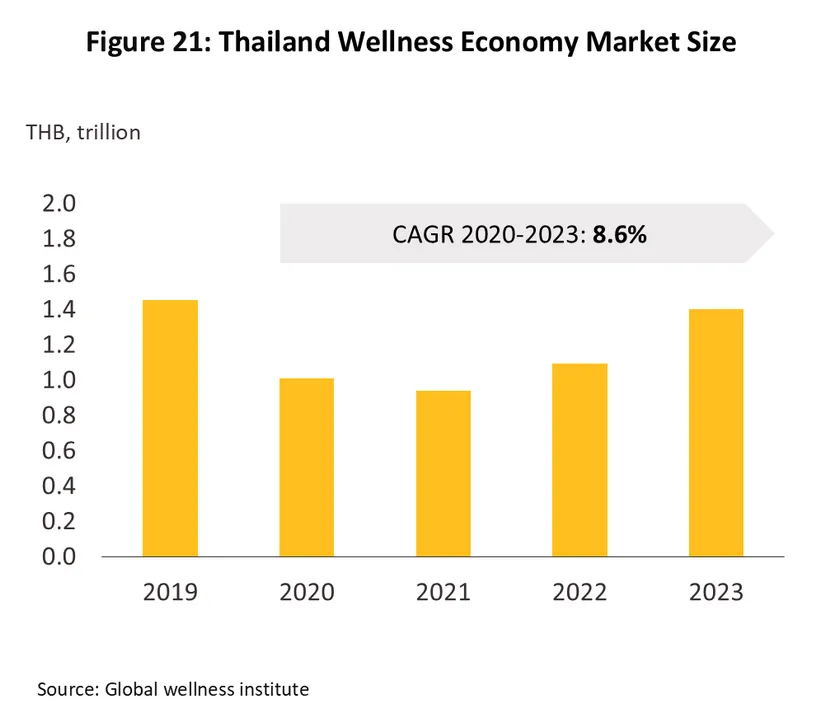
Thailand is on track to become a super-aged society (i.e., at least 25% of the population will be over 60) by 2030, and this will then expand opportunities within the healthcare and wellness value chain. As of 2023, the market for these services was worth USD 40.5 billion, a 28.4% jump from a year earlier, but within this, health and medical tourism has particular potential for growth given the government push to establish Thailand as an international medical and wellness hub. This is being achieved through support for traditional Thai massage, Thai herbal medicines, health tourism, the manufacture of medical devices and advanced therapy medicinal products (ATMPs), personal health and beauty treatments, wellness real estate (forecast to grow by 15% annually), and health foods, which are increasingly popular thanks to their protective effects. The government is also supporting the industry through tax incentives targeting investors in medical services, healthcare, and health-product R&D. Nevertheless, the industry will have to face a number of challenges, including the high cost of medical technology, which will drag on spending and investment by SMEs, intensifying competition from domestic and international players, and a shortage of skilled professionals, including physicians, nutritionists, and wellness specialists. In light of these problems, businesses will need to act proactively, embrace innovation, and invest in capability development if they are to sustain long-term growth.
-
The need to meet net zero goals will both necessitate a change in business operations and add to overheads as environmental regulations tighten and extend to include responsibility for social and environmental issues across supply chains. At present, regulations in this area can be split into the following two groups.
-
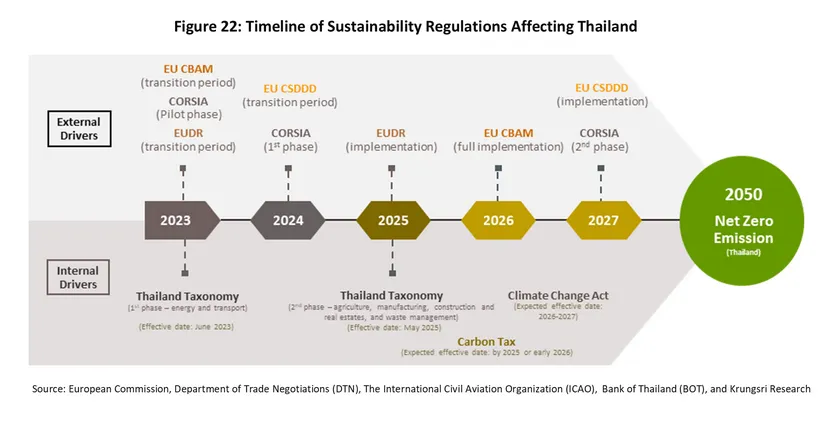
Measures that require companies to report their carbon emissions and pay a carbon price include: (i) The EU’s Carbon Border Adjustment Mechanism (CBAM), which came into force in October 2023, covering six product groups—cement, electricity, fertilizer, iron and steel, aluminium, and hydrogen. Exporters of these will need to pay a carbon fee starting in 2026. Other countries, including the UK, Australia and Canada, are also considering implementing their own CBAMs; (ii) The Carbon Offsetting and Reduction Scheme for International Aviation (CORSIA), which will become mandatory from 2027 onwards, adding costs for the international aviation industry.
-
Measures that require companies to ensure the sustainability of their operations across supply chains include the EU Deforestation Regulation (EUDR) and the EU’s Corporate Sustainability Due Diligence Directive (CSDDD), which will be fully implemented within the next 1-2 years. In particular, the CSDDD is expected to be adopted by other jurisdictions (e.g., Norway and the state of California), which will then require companies selling into these markets to comply with the new regulatory requirements.
Thai businesses are expected to face increasingly stringent domestic regulations in line with global trends and Thailand’s newly revised net zero target for 2050 (moved forward from 2065). These include:
-
Mandatory mechanisms: The government is in the process of drafting the Climate Change Act, which will require companies to report their greenhouse gas emissions. It also aims to accelerate the introduction of mandatory carbon pricing instruments, including a carbon tax (initially on oil products) and an emissions trading scheme (ETS), particularly for carbon-intensive industries such as cement, metals, and petrochemicals.
-
Voluntary mechanisms: The authorities have introduced the Thailand Taxonomy, which defines criteria for environmentally sustainable economic activities. The current version covers six sectors—energy, transport, agriculture, manufacturing, real estate, and waste management—encouraging businesses in these sectors to align their operations with the Taxonomy. Doing so will help maintain competitiveness and enhance access to sustainable finance.
Krungsri Research assesses that both global and domestic sustainability measures will present both challenges and opportunities for Thai businesses. Key challenges will stem from rising costs related to: (i) measuring, reporting and verification (MRV) and conducting due diligence; (ii) paying carbon prices; and (iii) transitioning to more sustainable business processes. Firms that adapt more quickly than their peers will benefit from greater opportunities in trade, investment, and access to ESG finance. Meanwhile, businesses operating in sustainability-related fields such as MRV services, sustainability consulting, and climate tech will gain from the growing drive toward net zero across all sectors.
Thai businesses therefore need to recognize the importance of these developments and accelerate their transition toward sustainable practices to stay competitive in a global economy increasingly shaped by environmental imperatives.
Changes to policies and regulatory frameworks and their impact on businesses
-
Real estate
-
Rules regulating the loan to value ratio for real estate credit have been relaxed and so lenders are now authorized to issue loans of up to 100% of the value of the assets against which they are secured when: (i) the collateral is valued at less than THB 10 million and the loan is for the purchase of a second home, or (ii) the collateral is valued at more than THB 10 million and the loan is for either a first or a second home. These changes will be in effect from May 1st, 2025, until June 30th, 2026. It is hoped that this will provide additional support for the real estate sector and associated industries, ease problems with a significant supply glut, improve access to home loans, and stimulate the economy more broadly.
-
The fees charged for registering property-related transactions have been cut. In detail, charges have been reduced for: (i) registering changes of ownership of a property, which have been cut from 2% to 0.01% of the property’s value; and (ii) registering mortgages secured against a property, which have been reduced from 1% to just 0.01% of its value. These changes apply to new and pre-existing homes valued at up to THB 7 million when bought by a Thai national. These measures will be in effect from the date of their announcement in the Royal Gazette until June 30th, 2026, and should stimulate home sales, help developers sell-off unsold inventory and so improve their cashflow, and encourage lenders to extend more home loans, thereby injecting additional liquidity into the economy.
-
Changes to laws and regulations that are under way or being considered
-
The proposed Property Rights Act (draft) will extend the maximum permissible lease on a property from 30 to 99 years. It is proposed that: (i) the initial lease would be for a maximum of 50 years (up from the current 30), and (ii) when this expired, it would be possible to extend this once for up to 49 years, giving a total length of 99 years, though to be valid, it would be necessary for the second contract to be registered at the Land Office. Currently, the Ministry of the Interior is seeking public consultation on the new legislation, and opinions can be lodged via the Land Office website and other public channels. By allowing more efficient planning of how land and property will be used, the new act will help to underpin long-term business confidence among property developers and overseas investors. In addition, the law will also support growth in large-scale real estate projects such as mixed-use and extended commercial developments that have distant payback horizons and through this, stimulate increased investment in the real estate sector overall.
-
The new Condominium Act (draft) will raise the maximum area of a condominium block that may be owned by non-Thais from 49% to 75% of the total, though with the following restrictions: (i) This will apply in the three provinces of Bangkok, Phuket and Pattaya only (all popular with overseas buyers); (ii) developments should have a footprint of no more than 5 rai (0.8 hectares); (iii) companies owning or managing condominiums may be no more than 49% foreign owned; and (iv) local authorities are free to impose additional restrictions (e.g., prohibiting building on agricultural land or in areas that are militarily sensitive). As with other similar measures, the authorities hope that this will encourage developers to start work on new projects and to further stimulate sales in the three target provinces, accelerate the run down in the backlog of unsold stock, and boost developers’ cashflow. Moreover, while these changes will have a beneficial impact on labor markets and the economy overall, the restrictions on the size and location of properties that will fall within the scope of the law will prevent excessive disruption to property markets and ensure that Thai citizens are still able to access these.
-
Manufacturing
-
The US has imposed anti-dumping and countervailing duties on solar cells imported from Thailand, Malaysia, Vietnam and Cambodia. These came into effect on April 21st, 2025, and for Thailand, these were set at the very high rate of 375.19-972.23%. As such, there is a significant risk that Thai players will lose competitiveness and market share in the US, though manufacturers are transitioning to a greater focus on the domestic market and this will help to offset losses overseas.
-
The Ministry of Industry has announced industrial standards for hydraulic cement, prompting manufacturers to enhance their products through improved production processes and quality control. The move aims to build consumer confidence and align with the government’s environmental and sustainable development policies.
-
New regulations from the Ministry of Industry targeting manufacturers of roofing tiles made from concrete, reinforced concrete, terracotta, and cement-fiber aim to improve the thermal performance of these products, thereby reducing heat transfer to the interior of buildings and cutting energy consumption from cooling. To meet these new standards, manufacturers will need to improve the production technologies that they use, though doing so will enhance product quality and raise consumer confidence.
-
The Ministry of Industry has also banned the construction or expansion of foundries producing rebar and billet, with effect from September 10th, 2025. The measures aim to tackle the current supply glut, address problems with the underutilization of current manufacturing capacity, and stabilize the market. Businesses currently involved in the production of these goods will also need to improve product quality to ensure compliance with ‘green steel’ standards. This will then help players better compete against imports (especially from China, where standards are similarly being raised) and on the global stage more widely.
-
The Anti-Dumping and Subsidy Review Committee has agreed to impose retaliatory measures targeting the dumping of coil, sheet and strip cold-rolled stainless steel with a thickness of 0.3-3.0 mm and a width of up to 1,320 mm. The measures will affect 33 product categories and will run from October 11th ,2025 to October 10th , 2030. This has been prompted by dumping by Vietnamese producers that has caused material damage to the Thai steel industry. Thai manufacturers should now be able to grow their sales and expand their market share, and at a minimum, this will reduce their losses.
-
Auto industry
-
Changes have been made to vehicle excise rates with the goal of reducing greenhouse gas emissions. These consist of the following.
-
The bands for CO2 emissions have been tightened and so to improve energy efficiency and reduce emissions, these have been split into the 5 (up from the earlier 4) groups of: CO2<100 g/km, 100-120 g/km, 121-150 g/km, 151-200 g/km, and >200 g/km.
-
Emissions-based excise rates for HEVs (hybrid electric vehicles) and PHEVs (plug-in hybrid electric vehicles) are now as follows:
-
Excise rates for HEVs and MHEVs5/ that emit fewer than 120 g/km of CO2 are held at 6-9 and 10-12% respectively. Manufacturers that have taken advantage of the BOI’s investment promotion schemes are required to invest in the domestic production of hybrids, source high-value parts manufactured within the country, and install advanced driver-assistance systems (ADAS).
-
PHEVs with an engine capacities of up to 3,000 cc, a range of at least 80 km per charge, and a petrol tank capacity of no more than 45 liters will see excise rates set at 5%. For PHEVs with a similar engine capacity but a range of less than 80 km/charge or a petrol capacity of more than 45 liters, excise doubles to 10%, while for PHEVs with an engine capacity greater than 3,000 cc, excise rates are set at 30%. This is with effect from January 1st, 2026.
-
Excise duties will be levied on traditional internal combustion engine (ICE) powered vehicles according to their CO2 emissions. These will rise in stages, beginning in 2026.
-
For autos with an engine capacity of not more than 3,000 cc, in phase 1 (January 1st, 2026 - December 31st, 2027) excise rates will be in the range of 13-34% as per vehicles’ CO2 emissions. Phase 2 will run from January 1st, 2028, to December 31st, 2029, when the rate will increase to 14-36%, and from January 1, 2030, onwards, excise duty will be set at 15-38%.
-
For autos with engines larger than 3,000 cc, excise rates will be fixed at 50% from January 1st, 2026, onwards. It is hoped that this will encourage the development of more environmentally friendly technology.
-
Excise tax on BEVs will be cut from 8% to 2% to encourage their manufacture and use, as per the resolution of the national committee on EV policy, which has set a target of 30% of cars coming off Thai production lines being zero emission vehicles (ZEVs) by 2030.
-
To increase the competitiveness of Thai-made pickups and similar vehicles and to help Thailand maintain its position as a regional center of auto production, the authorities are supporting the use of alternative energy other than biodiesel and promoting the production and use of BEVs and FCEVs (fuel cell electric vehicles). As part of this strategy, excise duties on these will be set at respectively 2% and 0%.
-
As with autos, excise duties for motorcycles, both ICE-powered and HEV and PHEV models, will be set according to their CO2 emissions. The first stage of the new regime will run from January 1st, 2026, to December 31st, 2029, with excise rates set at: 4% (CO2 emissions < 50 g/km), 6% (CO2 emissions 51-90 g/km), 10% (CO2 emissions 91-130 g/km), and 20% (CO2 emissions > 130 g/km). In phase 2 (from January 1st, 2030, onwards), rates from 5-25%.
-
The EV Board has revised the rules on the number of EVs that need to be manufactured in Thailand for companies participating in the EV3 and EV3.5 schemes, and so to help boost exports, from 2025 onwards, every EV manufactured in Thailand and then exported counts as 1.5 EVs for the purpose of meeting the BOI requirements. This change should then help to lift exports by 12,500 vehicles in 2025 and a further 52,000 vehicles in 2026. Beyond this, to better align with operating procedures and to allow companies to be more flexible in their planning, the deadline for registration for the two schemes has been extended by a month. Thus, the deadline for EV3 and EV3.5 registration is now January 31st, 2026, and January 31st, 2028, respectively.
-
Energy
-
The action plan for the transition to a carbon-neutral economy should be rolled out in 2026. This will entail the enforcement of: (i) the 2024 Power Development Plan; (ii) the Gas Plan; (iii) the Alternative Energy Development Plan; (iv) the Energy Efficiency Plan; and (v) the Oil Plan. This will help Thailand meet its goal of reaching carbon neutrality by 2050 and net-zero GHG emissions by 2065. These measures should also help to increase investment in electricity generation, natural gas extraction and importation, and oil refining.
-
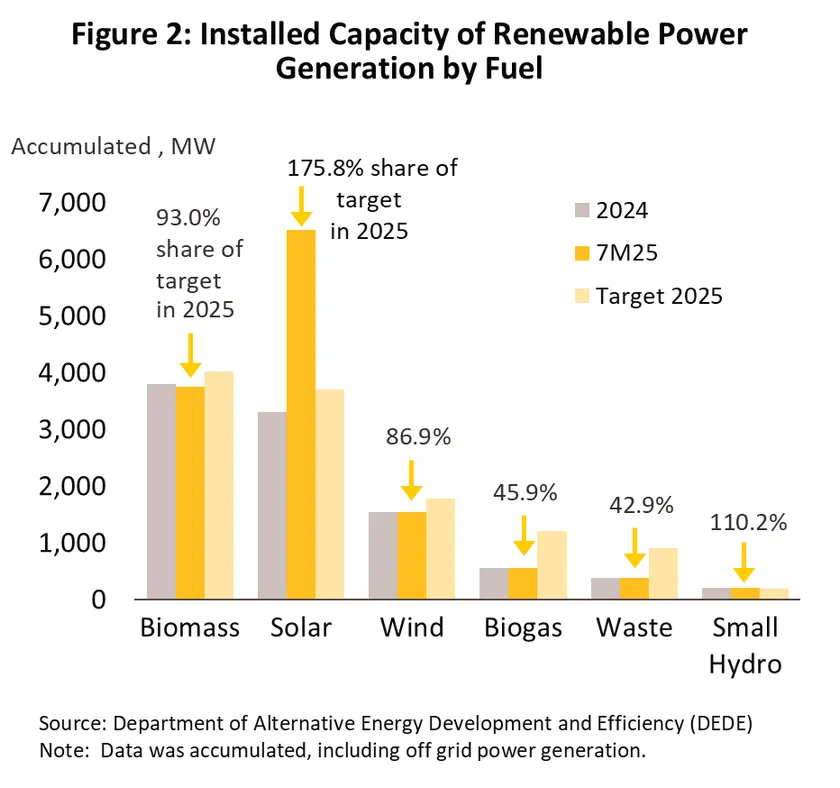
Revisions to the Power Development Plan (the draft PDP2024) and the Alternative Energy Development Plan (AEDP2024) divide the expansion in renewables generation into two phases: 2021-2030 and 2031-2037. These plans call for at least 50% of electricity supply coming from clean energy/renewables by 2037 (source: draft PDP 2024, EPPO), and these targets will help to support an increase in investment inflows into the industry and the buildout of new private-sector generating capacity in: (i) production from sources such as wind, biogas and solar (rooftop, ground-mounted, and ground-mounted with energy storage) for which there are no associated fuel costs; and (ii) biomass and municipal and industrial waste-to-energy generation.
-
Agriculture
-
The Department of Fisheries has revised 71 provisions under the draft amendment to the Royal Ordinance on Fisheries B.E. 2558 (2015), which is expected to be submitted for consideration by the new Cabinet in 2026. These include expanding the areas where artisanal fishing is permitted, restricting the issuing of fishing licenses to Thai nationals, updating penalties for legal infringements, and streamlining legislation by repealing redundant laws. This process should be completed before the end of 2025, and it is hoped that these changes will better regulate fishing, protect marine resources, strengthen labor rights, and revitalize the industry. By helping to raise competitiveness and reduce barriers to trade (a result of Thailand’s earlier problems meeting international labor and environmental standards), the industry as a whole will benefit. Additional positive impacts will include deepening cooperation between state organizations and local fishing communities, and a much fairer and sustainable redistribution of income across the fisheries supply chain.
-
Services
-
Hotels - The Ministry of the Interior has suspended the payments normally required for businesses to legally operate as a hotel for the 2 years between July 1st, 2024, and June 30th, 2026. This has been motivated by a desire to provide support for hoteliers hurt by the only sluggish recovery in the tourism industry, and the move will help smaller businesses continue to operate through challenging conditions. Alternatively, some businesses may be able to use the resulting savings to invest in renovations or other areas.
-
Environments
-
The EU’s Carbon Border Adjustment Mechanism (EU CBAM) entered its transition period on October 1st, 2023. Exporters of the six product categories (cement, electricity, fertilizer, iron and steel, aluminum, and hydrogen) are required to report the greenhouse gas emissions embedded in products exported to the EU. Full enforcement started on January 1st, 2026, when exporters must both report product emissions and potentially pay for the associated carbon costs. This will raise operating costs, particularly for exporters of carbon-intensive goods.
-
The International Civil Aviation Organization (ICAO) is introducing the Carbon Offsetting and Reduction Scheme for International Aviation (CORSIA) for all 193 member states, including Thailand. The scheme has two principal components: (i) measuring, reporting, and verifying (MRV) carbon emissions arising from international aviation on an annual basis; and (ii) offsetting emissions that exceed agreed quotas through the purchase of carbon credits. CORSIA will be enforced on a voluntary basis from 2024 to 2026, but from 2027 onwards, compliance will be mandatory, leading to higher costs for airline businesses.
-
The EU Deforestation Regulation (EUDR) has established new laws requiring that importers and exporters of seven products (rubber, oil palm, cattle, wood, coffee, cocoa, and soy, together with their derived products such as gloves and wooden furniture) will need to demonstrate that any products placed on or exported from the EU market are deforestation-free. The EUDR entered its transition phase on June 29th, 2023, with full enforcement beginning on December 30th, 2025. Rubber exports will be the most seriously affected, followed by wood and palm oil.
-
The EU's Corporate Sustainability Due Diligence Directive (CSDDD) requires large businesses to assess and report on their environmental and social responsibilities throughout their supply chains. This includes monitoring emissions and protecting labor and human rights. The directive entered its transition phase on July 25th, 2024, and will be fully implemented across all EU member states from July 26th, 2027. This should increase compliance costs for Thai businesses within European supply chains—i.e., those exporting to or investing in the EU—particularly in the electronics, automotive, rubber, and retail sectors.
-
Thailand is preparing to advance its net zero target to 2050, 15 years earlier than the previous goal of 2065. This will likely expose businesses to stricter environmental policies and regulations, particularly in the energy and transport sectors, which together account for roughly two-thirds of the country’s greenhouse gas emissions and will need to transition to lower-carbon energy sources. Next in line are hard-to-abate industries, such as cement, chemicals, and steel, which must modify their production processes to reduce carbon emissions.
-
The Department of Climate Change and Environment is drafting the Climate Change Act (approved in principle by the Cabinet and expected to take effect in 2026). Its key provisions require that businesses report their carbon emissions and set targets for climate actions. The law will also promote the development of a carbon pricing mechanism including a carbon tax, an emission trading scheme (ETS), and a carbon credit market, to encourage all sectors to take concrete action to control carbon emissions.
-
The Ministry of Finance is preparing to introduce a carbon tax by issuing a ministerial regulation on excise tax rates for carbon pricing mechanisms (approved in principle by the Cabinet, with collection expected to begin in 2026), initially targeting oil products at a rate of THB 200 per tonne of carbon dioxide equivalent. The tax will be implemented through a restructuring of the excise tax system, so it will not increase the overall tax burden for consumers. For example, the current diesel excise tax of THB 6 per liter will be adjusted to include a carbon tax of THB 0.5 per liter. This measure is intended to help exporters to countries implementing CBAM, such as the EU, which allows the carbon tax paid in the country of origin to be credited against CBAM costs.
-
The Ministry of Commerce issued a notification banning the import of plastic waste from abroad in order to reduce impacts on the environment and domestic plastic prices. This law applies to products classified under the Harmonized Code 39.15 (waste, parings, and scrap, of plastics) and came into effect on January 1st, 2025.
-
Finance
-
The Ministry of Digital Economy and Society6/ on Measures for the Prevention and Suppression of Technological Crimes (No. 2) BE 2568 (2025) came into force on April 13th, 20257/. This requires financial institutions, providers of payment services, telecoms companies, operators of social media platforms, and businesses offering services related to digital assets to: (i) prevent customers and clients from opening accounts and using mobile banking services under false pretenses or with assumed identities; and (ii) halt financial transactions and prevent customers opening new accounts when existing accounts are flagged as ‘black’, ‘dark gray’ or ‘light gray’ money mule accounts (i.e., the account has been identified with varying degrees of certainty as having been opened using a false or assumed identity) and investigate further when accounts are flagged as ‘dark brown’ or ‘light brown’ (i.e., there is a suspicion that this is a money mule account). To minimize the disruption suffered by legitimate account holders, the Bank of Thailand now also requires that account locks be lifted within 4 hours (down from the earlier 72 hours)8/.
-
The Bank of Thailand (BOT) has rolled out its ‘Your Data’ project, which under the tagline ‘Your data: building financial services that meet your needs’ allows consumers to easily and securely transfer their financial data from one service provider to another, for example when applying for credit or using a personalized financial management system. This improvement in data interoperability allows consumers to access more personalized financial products at more appropriate price points, while also boosting access to financial planning and management services. On the other side of the market, the costs associated with data processing and verification will fall, and service providers will be better placed to develop new and enhanced data-driven financial products.
-
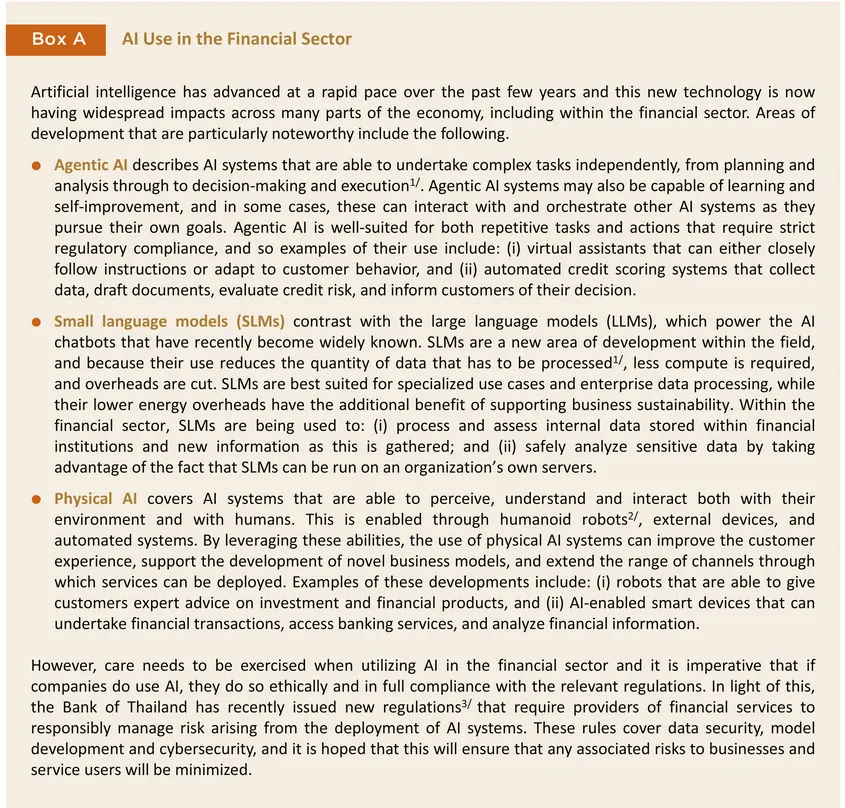
The BOT has issued guidelines on the management of risk arising from the use of AI in the financial sector9/ (in effect from September 12th, 2025). (i) Governance: Financial service providers are required to clearly identify responsibilities related to AI use, including deciding whether to implement ‘human in the loop’ or ‘human over the loop’ approaches to human involvement in or oversight of strategies or processes that may impact clients, and to inform customers when AI systems are tasked with client communication. (ii) Security and business development: Providers should implement measures to prevent unauthorized data disclosure, conduct model testing both before and after deployment, monitor the performance and reliability of outputs, and continuously test for potential cyberattacks. They should also update their threat-prevention frameworks in accordance with international standards.
-
The Ministry of Finance10/ bringing auto and motorcycle hire-purchase and leasing businesses within the scope of the Financial Institution Business Act comes into force on December 2nd, 202511/ , thereby giving the BOT the power to investigate these businesses and to order corrective actions or if necessary that they cease operations altogether. These measures recognize the fact that these companies provide credit to their customers and given their volume, these activities have a broad impact on the public and on Thai economy more generally.
-
The BOT has approved the establishment of three virtual banks. These will be run by: (i) ACM Holdings Ltd.; (ii) a consortium comprised of Krungthai Bank PLC, Advanced Info Service PLC, and PTT Oil and Retail Business PLC; and (iii) a second consortium consisting of SCB X PLC, WeTechnology Limited, and KakaoBank Corp. These will be able to offer financial services to the public from June 19th, 202612/ , Virtual banks are expected to expand financial access to a customer base that will encompass SME and retail accounts, though this will especially include currently underserved parts of the market among low-income earners, those in irregular employment, and underbanked and unbanked groups. By delivering financial services entirely through digital channels that take advantage of the possibilities offered by agile modern technologies, these banks should be able to reduce costs and meet customer needs more directly.
Krungsri Research sees the macroeconomic factors described above presenting both opportunities and challenges to businesses and industries, and companies will thus have to adapt rapidly to changing macroeconomic and social conditions. Players will also have to adjust to a regulatory framework that is evolving as the authorities look to build a robust foundation for businesses and create an environment conducive to long-term sustainable growth.
1/SLMs may operate with up to 30 billion parameters, or around a fifth of the size of an LLM (OpenAI’s GPT-4 is based a 100-billion-parameter model).
2/A robot designed with a human-like shape and movement
3/For more details, please see https://www.bot.or.th/content/dam/bot/fipcs/documents/FOG/2568/ThaiPDF/25680178.pdf
4/https://www.businessresearchinsights.com/market-reports/silver-economy-market-119281
5/MHEVs, or mild hybrid electric vehicles, are HEVs that have low-voltage direct-current motors that draw fewer than 60 volts.
6/On 8 April 2025, the Cabinet approved the draft Emergency Decrees on the prevention and suppression of technology-related crimes and on the regulation of digital asset businesses.
7/BOT media briefing on enforcement of Royal Decree on Measures for the Prevention and Suppression of Technology Crime
8/Joint Media Briefing: Progress on measures to suppress money mule accounts
9/In accordance with the Notification of the Bank of Thailand on the Management of Risks Associated with the Use of Artificial Intelligence Systems (12 September 2025).
10/The Ministry of Finance has issued a royal decree placing the business of hire purchase and leasing of cars and motorcycles
11/Oversight of vehicle hire-purchase and leasing operations
12/Results of applications to operate a virtual bank
AGRICULTURE
Rice
Situation in 2025
-
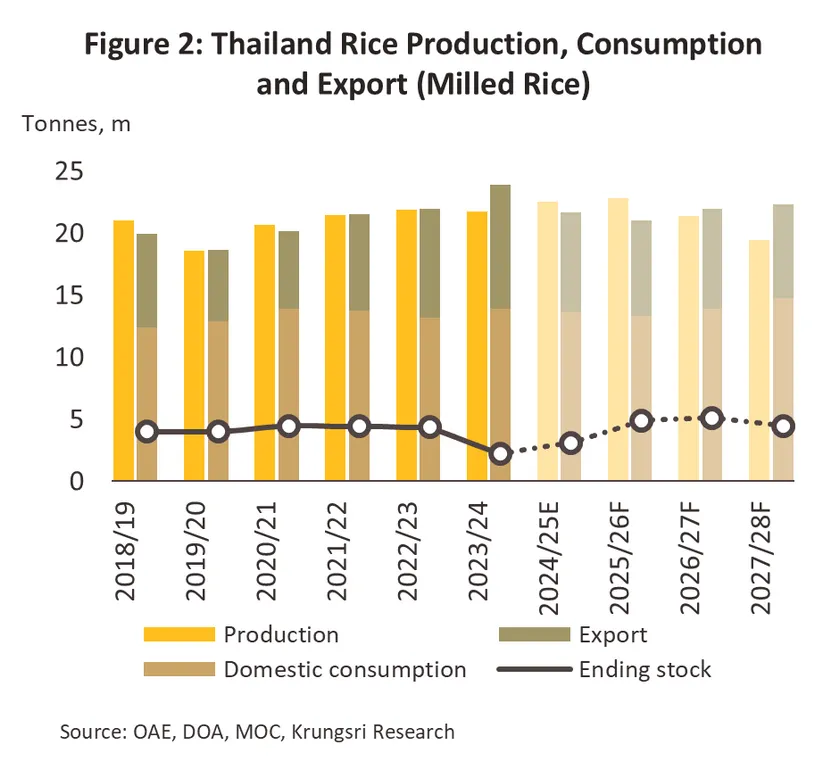
Over 9M25, the paddy rice output index expanded 17.6% YoY, driven by (i) global climate conditions returning to normal and La Niña conditions, fostering favorable weather and rainfall for cultivation in Thailand, thus increasing overall output and yield per rai, and (ii) farmers increasing rice cultivation due to price incentives from the previous year. Consequently, full-year 2025 paddy rice output is projected to expand 2.9-3.9%, reaching 34.4-34.8 million tonnes (MT) of paddy or 22.4-22.6 MT of milled rice.
-
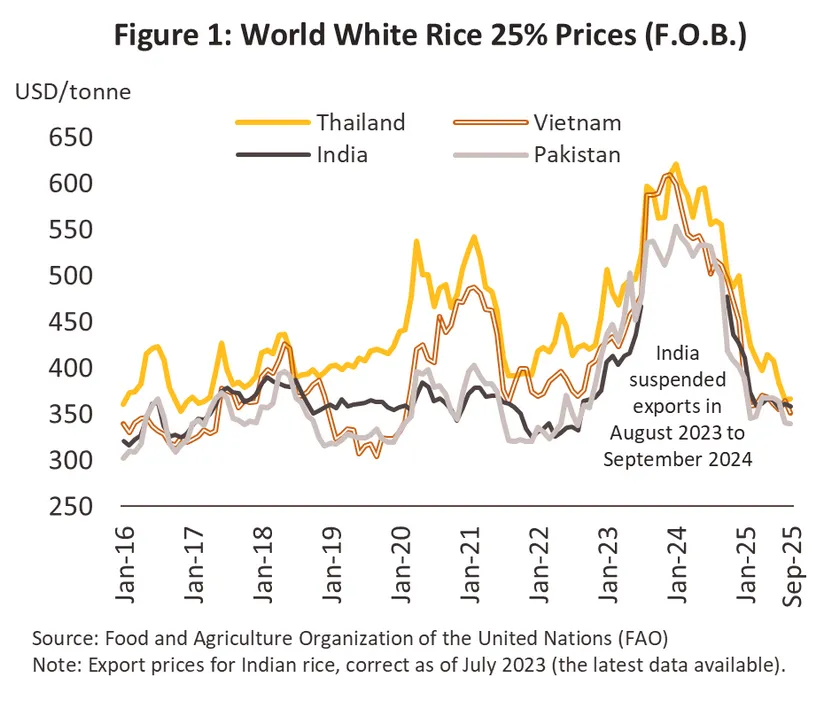
Export volume contracted -23.1% to 5.8 MT of milled rice during 9M25, constrained by (i) favorable global climatic conditions for cultivation have led major producing countries to increase rice output supplied to the global market, (ii) reduced import demand from trading partners like Indonesia and the Philippines due to sufficient domestic rice production, and (iv) a strengthening Thai Baht reducing the price competitiveness of Thai rice. For the remaining year, Thai rice export volume is expected to continue contracting due to increased competition from high global market supply, particularly for white rice. Consequently, full-year 2025 export volume is projected to contract approximately -19.9% to -20.9%, reaching 7.9-8.0 MT of milled rice.
-
Domestic rice consumption in 2025 is projected to contract by approximately -1.3% to -2.3%, totaling 13.6-13.7 MT of milled rice. This contraction is driven by expected decreases in the food and animal feed industries, which is projected to shrink by -9.1% to -10.1%, reaching 2.5-2.6 MT of milled rice. Conversely, direct consumption demand is expected to remain flat or increase slightly at 0.0-1.0%, totaling 11.0-11.2 MT of milled rice. Overall domestic market constraints stem from weakened purchasing power due to economic conditions and a slowdown in the tourism sector and restaurant businesses.
2026-2028 Outlook
-
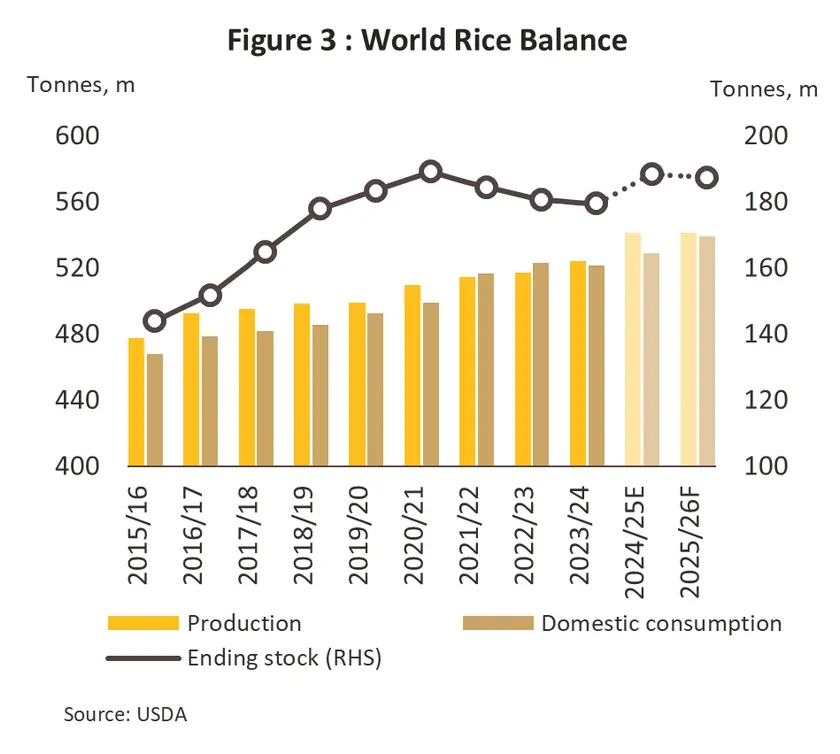
In 2026, output is projected to expand 0.8-1.8%, reaching 34.9-35.2 MT of paddy rice or approximately 22.7-22.9 MT of milled rice. Positive factors include La Niña and normal climate conditions expected to provide favorable weather, rainfall, and sufficient reservoir water for cultivation. Conversely, 2027-2028 rice output is projected at 29.9-32.9 MT of paddy rice or 19.4-21.4 MT of milled rice, a decline of -7.2% to -8.2% p.a., primarily due to the anticipated return of El Niño conditions causing damage and reduced yield.
-
Rice exports are projected to contract an average of -1.3% to -2.3% p.a., totaling 7.5-8.0 MT of milled rice p.a.. Constraints include (i) severe competition from increasing global rice supply, particularly from key competitors (e.g., India, Vietnam, and Pakistan), and (ii) reduced import demand from trading partners due to higher domestic production and significant prior advance/stockpiling purchases.
-
Domestic rice consumption is projected to grow 2.1-3.1% p.a., totaling 13.3-14.8 MT of milled rice p.a.. Demand-side drivers include (i) gradually increasing tourist numbers boosting demand from restaurants and hotels, (ii) demand from other downstream industries, particularly food manufacturing, which will require more rice for processing raw materials, and (ii) gradual recovery in consumption demand supported by improving purchasing power aligned with employment trends across business sectors. Supply-side support comes from domestic high rice stock drawdown (Destocking).
Rubber
Situation in 2025
-
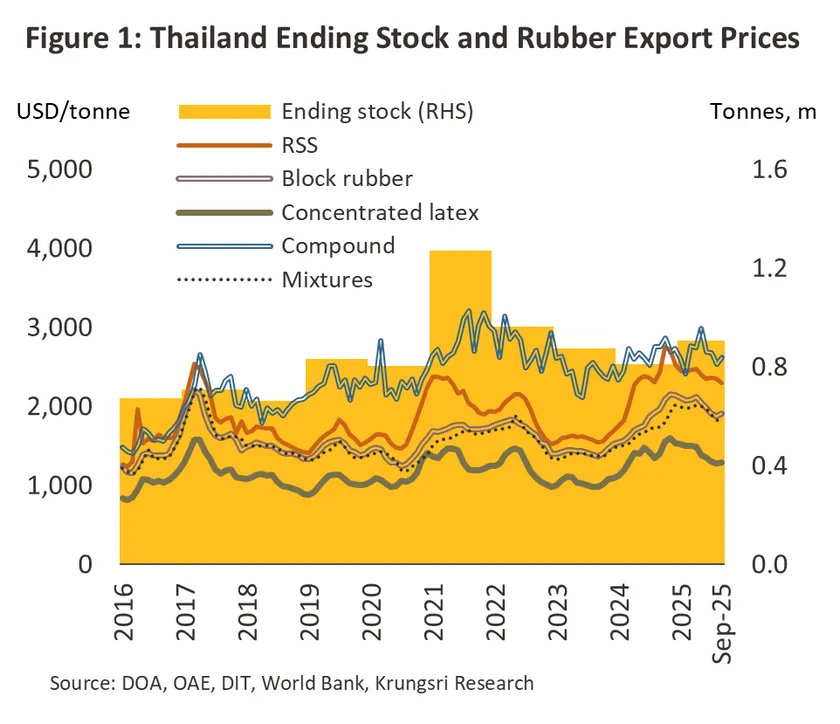
Over 9M25, the natural rubber output index declined -0.5% YoY, primarily due to government and private-sector measures to slow rubber tapping—by postponing the opening of the tapping season from May to June—significantly reduced raw rubber output in the first half of the year. However, in the second half, favorable weather conditions led to a gradual increase in primary rubber supply entering the market. Although flooding occurred in southern Thailand toward year-end, the impact on raw material supply remained limited. Together with partial imports of raw materials, this supported continued growth in output from midstream rubber processing plants. The intermediate rubber production index grew approximately 5.7% YoY, mainly driven by sheet rubber (+28.4% YoY) and mixed rubber (+30.6% YoY). This expansion catered to rising foreign downstream industry demand and increased inventory build-up to replenish stocks depleted in prior years. Consequently, full-year intermediate rubber output is projected at 5.1-5.2 million tonnes (MT), representing 2.4-4.4% growth.
-
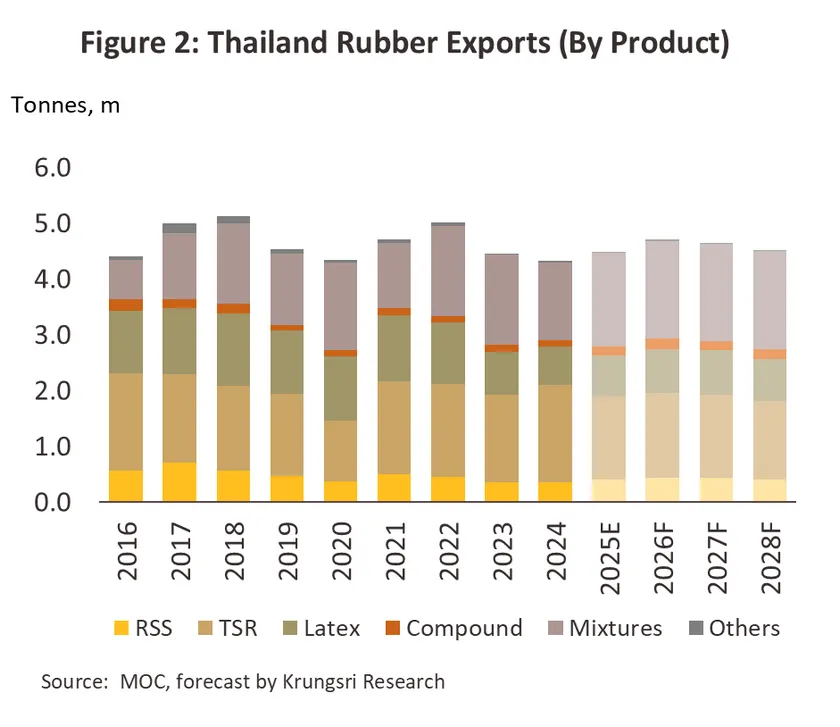
9M25, export volume expanded 6.9% YoY to 3.4 MT, with growth across almost all key products: sheet rubber at 0.3 MT (+22.4% YoY), concentrated latex at 0.6 MT (+10.0% YoY), mixed rubber at 1.3 MT (+39.3% YoY), and compound rubber at 0.1 MT (+46.0% YoY). This momentum was bolstered by demand from the automotive and parts industry, particularly in China and Japan, driving export prices up over 14.8% YoY and supporting export value expansion to reach USD 6.6bn (+22.7% YoY). However, export momentum is expected to moderate for the rest of the year due to (i) the impact of US tariff policy potentially dampening orders from both the US and other trading partners amid a slowing global economy, and (ii) lower synthetic rubber prices following global crude oil price declines. Full-year export volume is projected to grow modestly at 2.6-4.6%, totaling 4.4-4.5 MT. Similarly, export price growth is expected to slow to 8.3-10.3%, leading to an overall export value expansion of 12.3-14.3%, estimated at USD 8.7-8.8bn.
-
9M25, domestic intermediate rubber consumption contracted across key products: sheet rubber (-3.7% YoY), concentrated latex (-9.5% YoY), and mixed rubber (-9.5% YoY). This was attributed to operators utilizing existing raw material stocks or importing intermediate rubber for downstream production to fulfill orders from trading partners. Consequently, full-year domestic rubber consumption is projected to contract by -6.4% to -8.4%.
2026-2028 Outlook
-
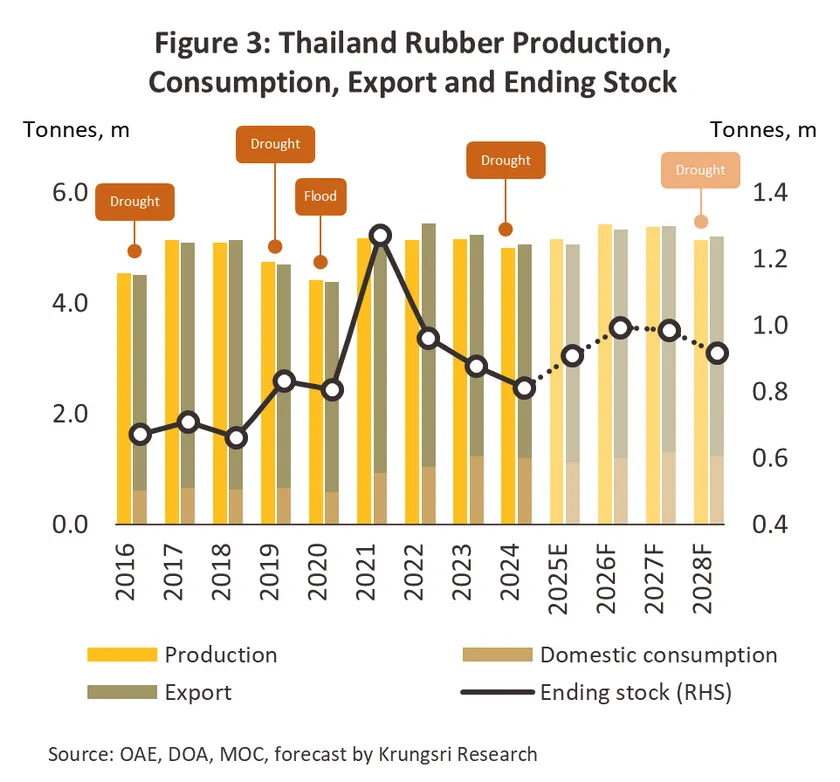
In 2026, rubber output is projected to expand 4.1-6.1%, supported by (i) favorable weather and rainfall, leading to higher yield, and (ii) elevated prices incentivizing farmers to tap and maintain trees for increased production. Conversely, output is anticipated to contract by an average of -1.6% to -3.6% p.a. in 2027-2028, constrained by warmer weather and reduced rainfall associated with the onset of El Niño conditions, and the new strain of natural rubber leaf fall disease.
-
In 2026, export volume is projected to expand 3.8-5.8%, driven by restocking demand in related industries of trading partners, particularly automotive, tires, and parts, supporting an anticipated market recovery trend. Volumes are expected to contract by -0.8% to -2.8% p.a. in 2027-2028, constrained by (i) the return of El Niño conditions causing raw input supply shortages, and (ii) downstream rubber product manufacturers delaying purchases due to having already built advance reserves and to manage raw material cost risk from anticipated higher rubber prices resulting from the shortage.
-
Domestic consumption is projected to grow 2.2-4.2% p.a., supported by (i) downstream industries, particularly automotive parts and tires, which are expected to recover gradually, (ii) gradual recovery in both public and private construction sectors, and (ii) anticipated continued government measures to absorb output and maintain price stability.
Cassava
Situation in 2025
-
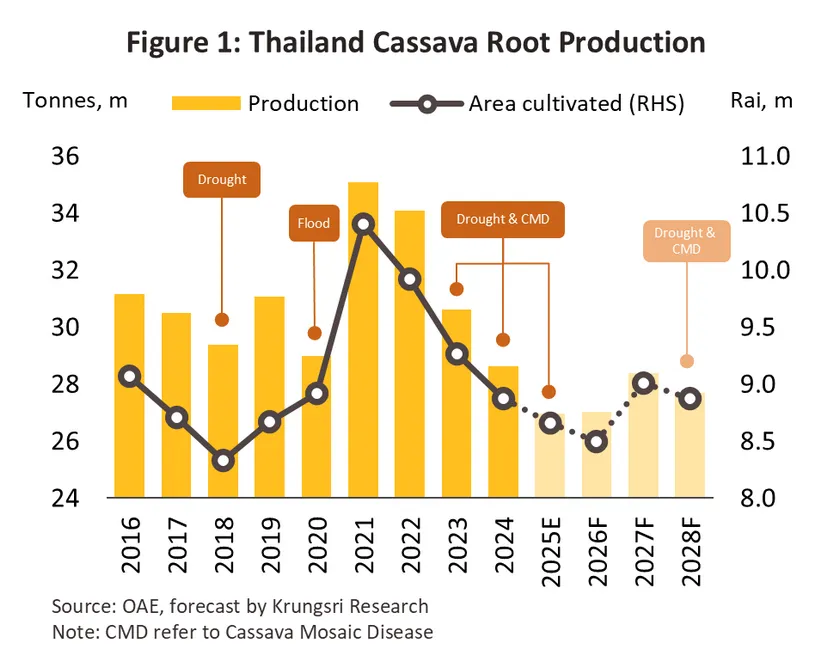
Over 9M25, the Fresh Cassava Output Index contracted -5.4% YoY, constrained by i) drought conditions and below-average rainfall in H1 2024 due to El Niño, followed by flooding in H2 2024, leading to reduced 2025 harvests; ii) persistent Cassava Mosaic Disease (CMD) outbreaks, lowering output and yield per rai, and causing planting stock shortages for farmers; and iii) some farmers shifting to higher-yield or lower-risk crops. Consequently, 2025 fresh cassava root output is projected at 26.8-27.3 million tonnes (MT), contracting -4.5% to -6.5% after a -6.5% contraction in 2024.
-
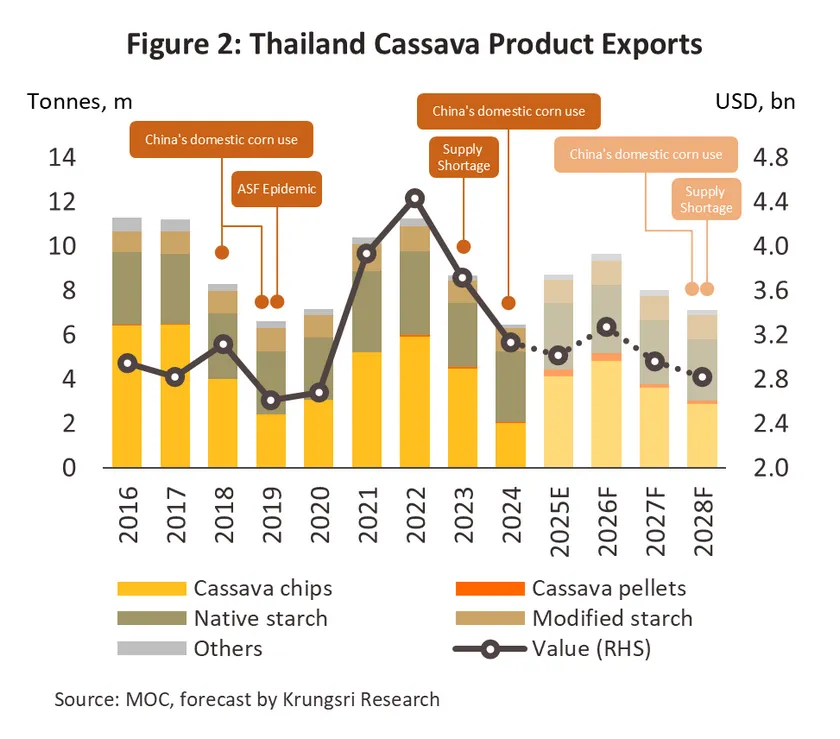
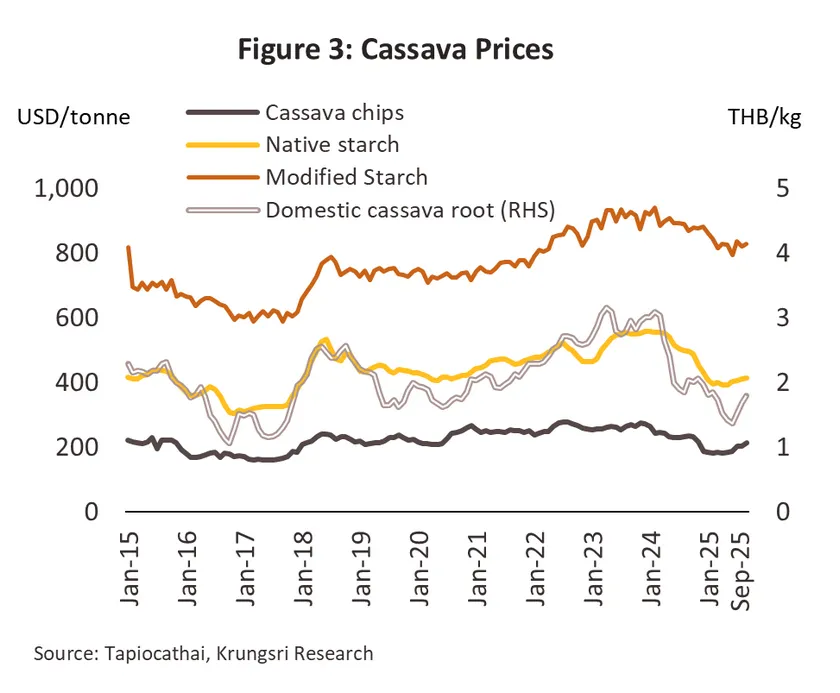
Cassava product export volume increased 36.6% YoY to 6.9 MT during 9M, while export value declined -5.8% YoY to USD 2.3bn, tracking a price reduction (-31.1% YoY) due to intense competition. Export volumes of key products are as follows:
-
Cassava chip export volume reached 3.4 MT (+97.5% YoY), driven by a 91.3% YoY increase in Chinese cassava chip demand. This was fueled by i) heightened usage in the feed and energy industries, and ii) downstream industries substituting cassava chips for corn when the latter's price exceeded that of chips.
-
Cassava starch export volume reached 3.1 MT, contracting -4.5% YoY, mainly due to a -6.2% YoY shrinkage in the raw starch export market. This decline stems from severe price competition against both substitute products and competitors, notably Vietnam. Conversely, modified starch exports saw marginal growth (+0.7% YoY) as operators adapted by focusing on exporting higher-value, innovative products supported by diversified market channels.
For the remainder of the year, demand in the Chinese market is expected to remain strong, particularly for cassava chips. Consequently, full-year cassava product export volume is projected to expand 33.7-35.7%, reaching 8.6-8.8 MT.
-
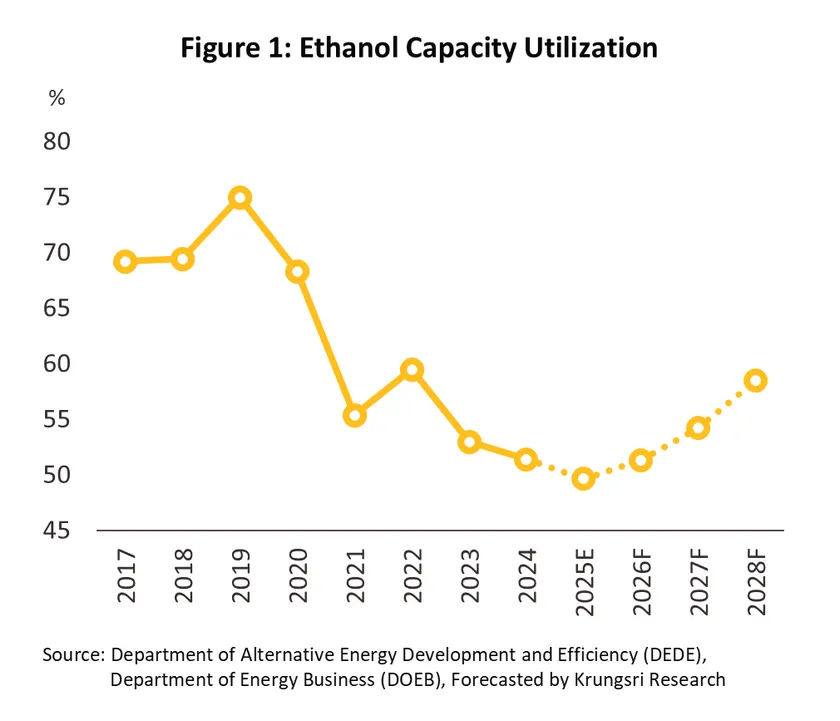
Domestic market sales volume is projected to contract by -2.0% to 0.0%, primarily constrained by a reduction in cassava usage for ethanol production, projected to shrink -8.4% to -10.4%. This decline is attributed to reduced fuel consumption across economic, transport, and tourism activities, despite expected growth of 1.5-3.5% in cassava usage by other downstream industries.
2026-2028 Outlook
-
Fresh cassava root output is projected to expand 1.6-3.6% p.a. in 2026, driven by favorable weather, sufficient rainfall, and adequate reservoir water levels resulting from La Niña and neutral climate conditions. Conversely, output is expected to contract -1.5% to -3.5% during 2027-2028 due to the anticipated return of drought conditions, coupled with the ongoing issue of CMD.
-
Export volume is projected to expand an average of 9.5-11.5% in 2026, driven by i) rising Chinese cassava chip demand to compensate for declining domestic corn stocks, ii) recovering downstream industries aligned with trading partners' economies, and iii) sustained demand for food security. Conversely, export volume is anticipated to contract -13.1% to -15.1% p.a. in 2027-2028, constrained by i) supply shortages resulting from the return of El Niño conditions, and ii) the projected increase in corn output (a substitute product) in both Chinese and global markets.
-
Domestic market demand volume is projected to expand 1.1-2.3% p.a., driven by expected recovery in downstream industries aligned with economic activity trends. Specifically, the ethanol production industry is set to benefit from the gradually recovering transport business in the tourism sector, government infrastructure investment, and an increasing cumulative fleet of gasoline vehicles utilizing gasohol.
Sugar and molasses
Situation in 2025
-
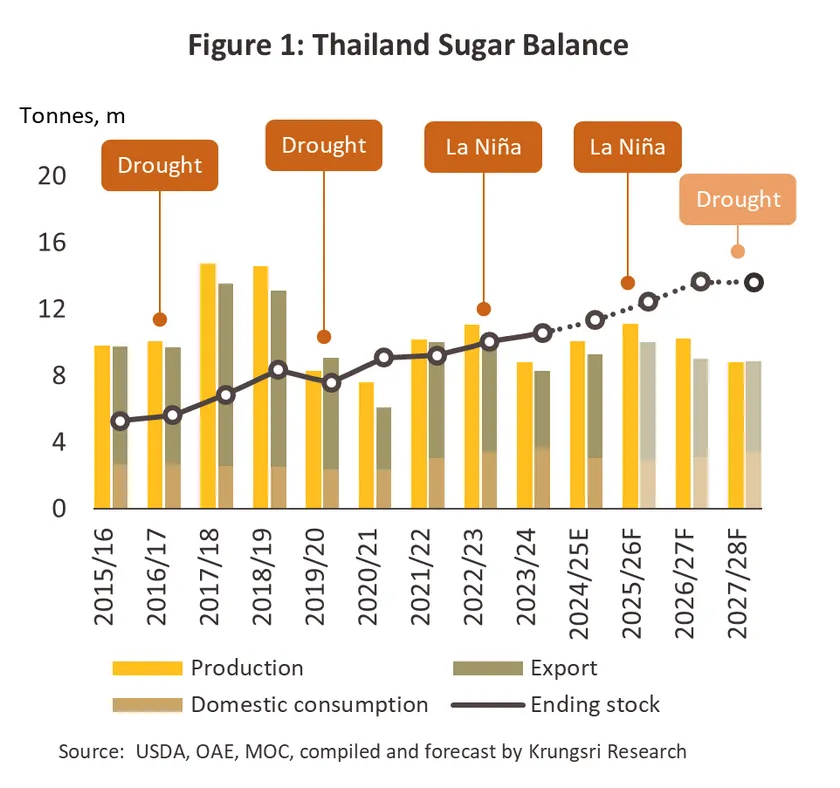
Sugarcane crush volume in the 2024/25 season expanded 12.0% to 92.0 million tonnes (MT) of cane, yielding 10.1 MT of sugar (+14.4%). Growth drivers include: (i) favorable weather/rainfall conditions, and (ii) incentives promoting new cultivation expansion, specifically record-high prior-year cane prices, fresh cane harvesting subsidies, and revenue-boosting measures from cane leaves/tops.
-
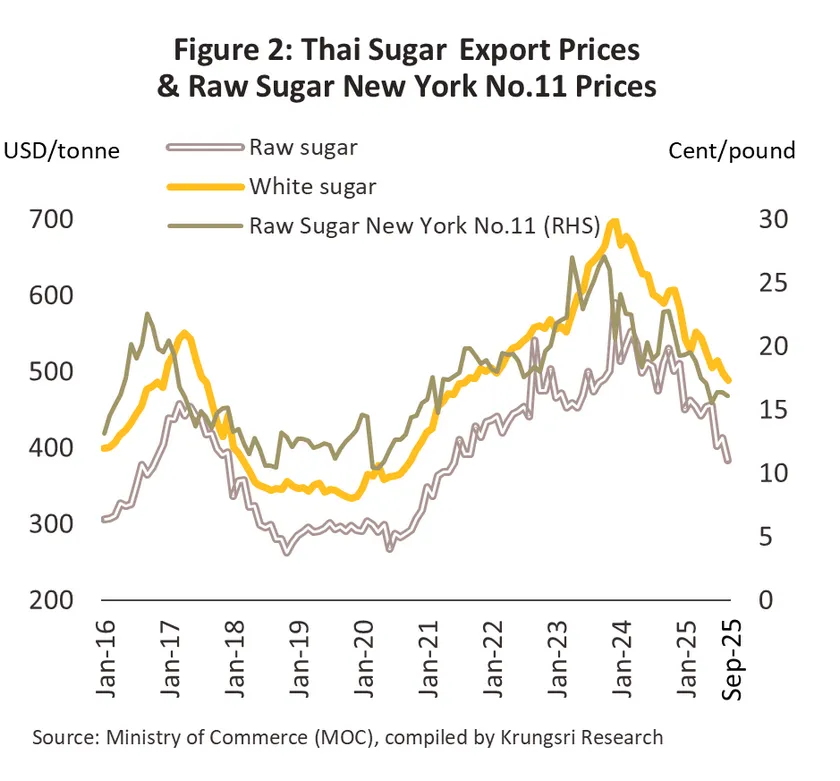
Over 9M25, sugar and molasses export volume totaled 5.2 MT (+37.8% YoY), valued at USD 2.4bn (+12.3% YoY). This was driven by: (i) higher cane output due to more favorable weather/rainfall, and (ii) depletion of significant refined sugar stocks held by Thai exporters from the previous year. For the entirety of 2025, total sugar and molasses export volume is projected at 5.95-6.04 MT, expanding 34.3-36.3%, while Thai export prices for sugar and molasses continued to decline by -18.5% YoY.
-
Domestic consumption of white and refined white sugar for the 6M25 totaled 1.17 MT (-8.8% YoY). Direct consumption was 0.70 MT (-7.5% YoY), due to weakened purchasing power from economic activity slowdown, particularly in the tourism, restaurant, and beverage sectors, amidst a health trend that reduces both direct and indirect sugar demand. Similarly, the volume of sugar used in related industries was 0.47 MT (-10.6% YoY), notably the beverage industry, which was pressured by the Phase 4 (highest tier) sugar tax, followed by pharmaceuticals and bakery sectors (incl. beer and spirits). For the rest of the year, negative factors will persist in the domestic market, specifically from increasing economic deceleration, projecting 2025 domestic sugar usage at 2.23-2.28 MT, contracting approx. -8.5% to -10.5%.
2026-2028 Outlook
-
Sugarcane output in the 2026 crop year is projected to increase to 98.8-100.6 MT of sugarcane, equating to 11.0-11.2 MT of sugar, an expansion of 9.0-11.0%, driven by (i) global climate entering a normal phase and La Niña conditions, resulting in favorable weather and rainfall for cultivation, and (ii) farmers incentivized by high prices in the prior growing season. However, in 2027-2028, sugarcane output is expected to contract to 77.2-92.3 MT/year, equating to 8.8-10.2 MT of sugar/year, contracting approximately -10.1% to -12.1% p.a., due to (i) projected hot weather from El Niño impact, reducing output, (ii) some farmers switching to drought-resistant crops like cassava, replacing sugarcane, and (ii) cultivation costs expected to remain high, prompting farmers to reduce crop maintenance.
-
Sugar and molasses exports in 2026 are expected to expand by an average of 11.9-13.9% to 6.7-6.8 MT, driven by (i) increased supply available for delivery to trade partners as the sugarcane raw material shortage eases, (ii) the start of a new inventory accumulation cycle to meet food security and gradually recovering related industry demand, and (ii) progress in Free Trade Agreements (FTA). However, sugar and molasses exports in 2027-2028 are projected at 5.2-5.6 MT/year, contracting -11.4% to -13.4% p.a., dragged by (i) the expected return of the El Niño phenomenon damaging sugarcane yields, and (ii) intense competition from Brazil, the world's major producer and exporter.
-
Domestic consumption is projected at 2.9-3.4 MT/year, an increase of 3.4-5.4% p.a., supported by (i) direct consumption mirroring the gradual recovery of economic activity and the tourism business, and (ii) demand from related industries, notably the improving food and beverage sectors, aligned with household consumption trends and the service sector, particularly restaurants and hotels.
Palm Oil
Situation in 2025
-
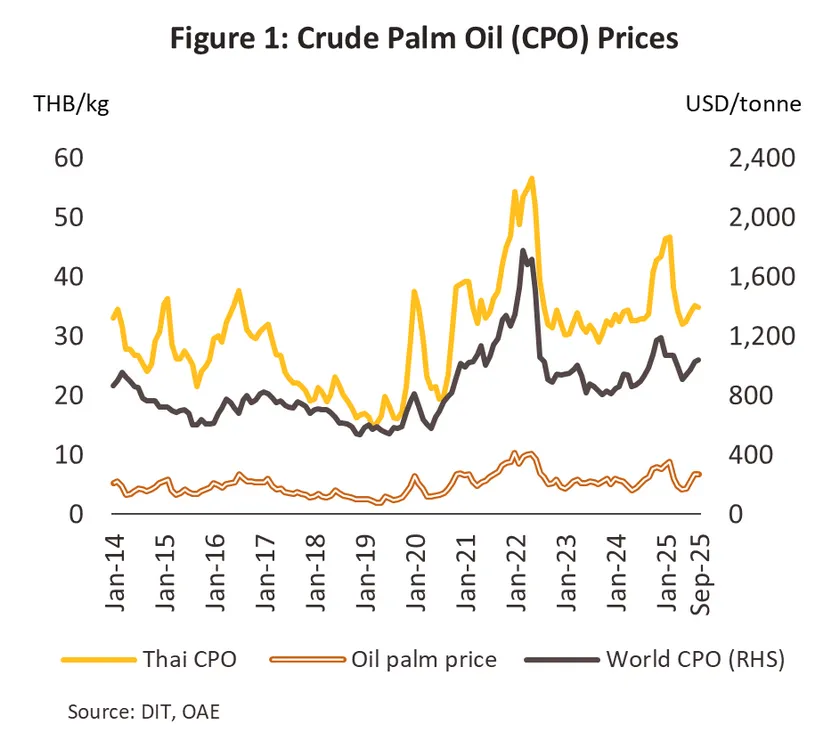
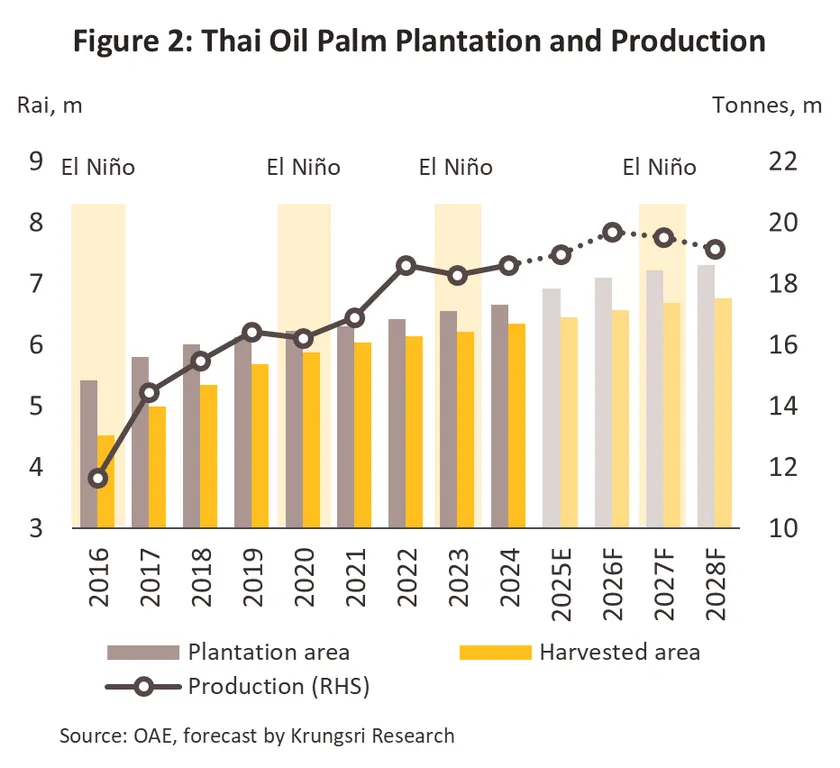
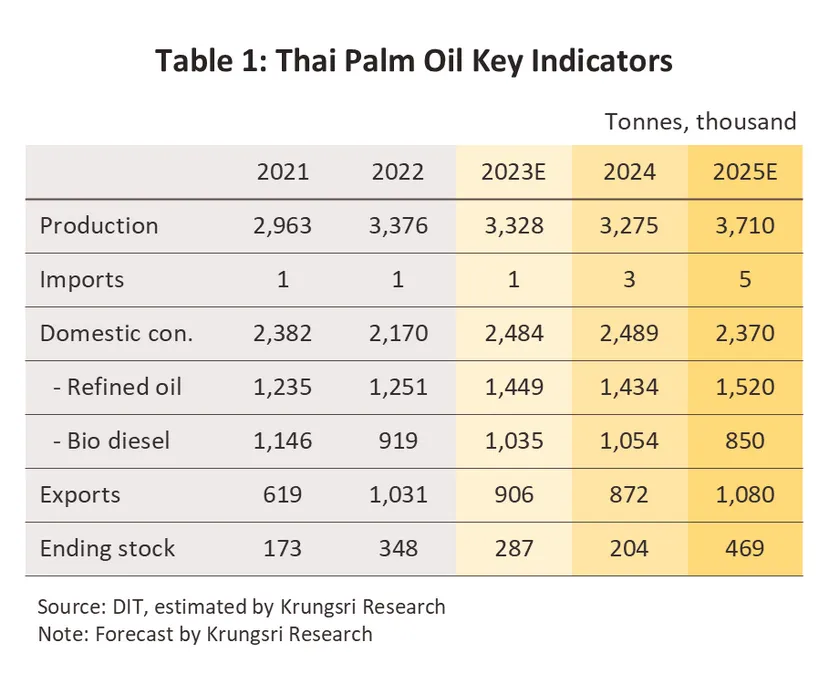
Over 9M25, the quantity of Fresh Fruit Bunch (FFB) used for Crude Palm Oil (CPO) reached 16.8 million tonnes (MT) (+6.3% YoY). Supported by (i) More favorable weather conditions, (ii) Expanded cultivation by farmers driven by high prices in 2021-2022, (ii) Incentivizing government minimum purchase price measures, and (iv) Increased Oil Extraction Rate. Consequently, CPO output rose to 3.0 MT (+10.1% YoY). Conversely, domestic CPO consumption contracted -7.0% YoY to 1.8 MT, primarily due to decline in biodiesel production input, settling at 0.6 MT (-22.8% YoY). This contraction reflects lower energy demand in the transport sector stemming from the overall slowdown in business and trade activity. This occurred despite an increase in refined palm oil (RPO) production input to 1.2 MT (+4.6% YoY), driven by sustained demand from downstream industries, particularly for export-oriented RPO and oleochemicals production, which continued to grow. Meanwhile, CPO product exports increased to 0.95 MT (+16.7% YoY), meeting the demand of key partners: India (+22.1% YoY), Malaysia (+10.8% YoY), and China (+173.2% YoY).
-
For the remainder of the year, previously identified tailwinds and headwinds are expected to persist. Although flooding occurred in southern Thailand toward year-end, the impact on raw material supply remains limited. As a result, fresh palm fruit output for CPO production in 2025 is projected to rise to 20.4–20.8 million tonnes, representing growth of 9.4–11.4%, yielding approximately 3.6–3.7 MT of CPO (12.2–14.2% growth). Conversely, domestic CPO demand is anticipated to contract by -3.9% to -5.9%, following reduced energy requirements in both commercial transport and the tourism sector's travel activity. Meanwhile, CPO export volume is forecast to expand by 22.2–24.2%, driven by increased stockpiling for food and energy security, especially in the Indian market. This is primarily due to concerns over declining supply from major exporters, namely Indonesia and Malaysia due to disease outbreaks and increased usage in the energy sector. This environment is expected to boost the average annual domestic prices for both FFB and CPO, as well as export prices for palm oil products, by around 5.0–10.0%.
2026-2028 Outlook
-
FFB and CPO output in 2026 is projected to expand by an average of 4.0–6.0%, primarily driven by global climate transitioning to normal conditions, i.e., La Niña phase, resulting in more favorable weather and rainfall for yield volume. During 2027–2028, oil palm supply is expected to contract by -4.6% to -6.6% p.a.. This drag is attributed to the anticipated return of the El Niño condition, mixed by the continued prevalence of basal stem rot (BSR) outbreaks.
-
In 2026, domestic CPO consumption volume is forecast to expand at 5.2–7.2%, primarily bolstered by government measures, including: (i) Adjusting CPO blending ratios in the energy sector from B5 to B7, and (ii) Stimulus measures for domestic consumption and tourism support. These factors favor demand in the food and oleochemical industries, further supported by rising palm output. In 2027–2028, consumption volume is expected to contract by -3.4% to -5.4% p.a.. This decline by (i) Hot weather conditions causing yield damage, and (ii) EV industry growth curtails biofuel demand.
-
Export volume is projected to accelerate in 2026 to 28.5–30.5% growth. This surge is driven by (i) Indonesia's likelihood of increasing its biodiesel blending ratio from B40 to B50, and (ii) Reduced output volumes from key exporters (Indonesia and Malaysia) due to disease outbreaks and harvesting labor shortages. These circumstances create an opportunity for Thailand to increase its exports. Over 2027-2028, the export market is expected to contract by -7.3% to -9.3% p.a.. This decline is attributed to anticipated government measures restricting exports to ensure sufficient domestic supply during a period of projected economic recovery, simultaneously with a decrease in domestic raw input supply due to drought conditions.
Chilled, Frozen and Processed Chicken
Situation in 2025
-
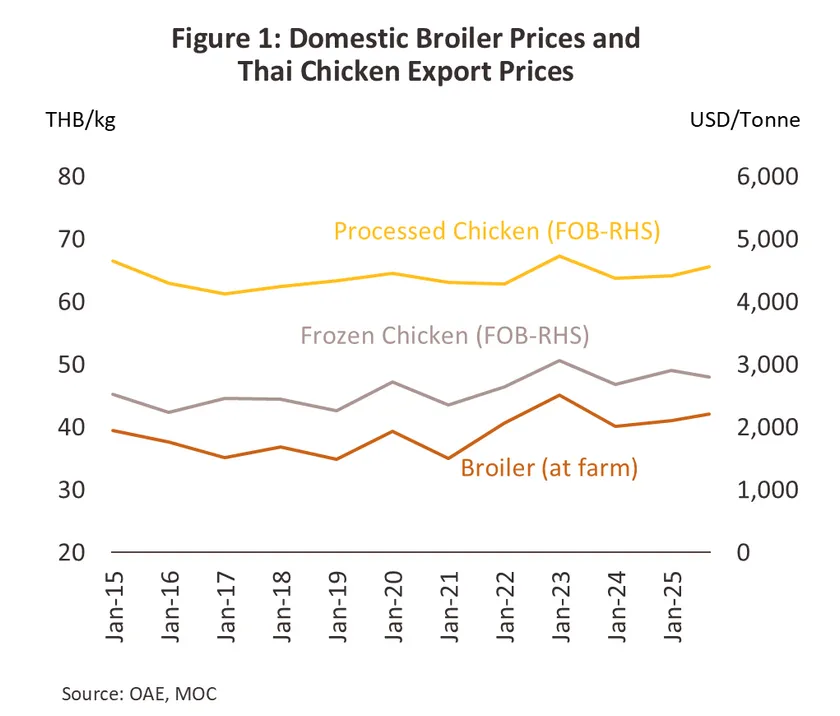
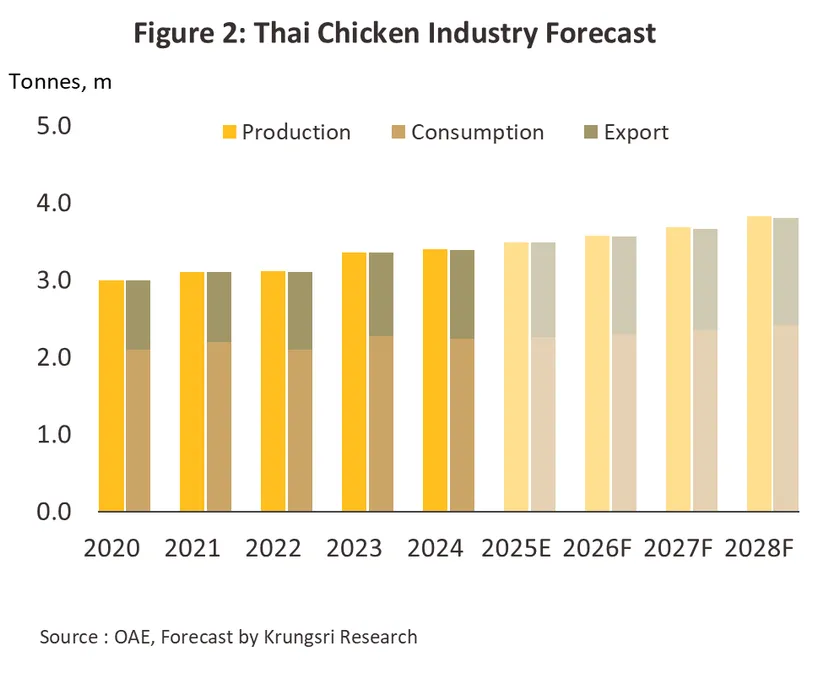
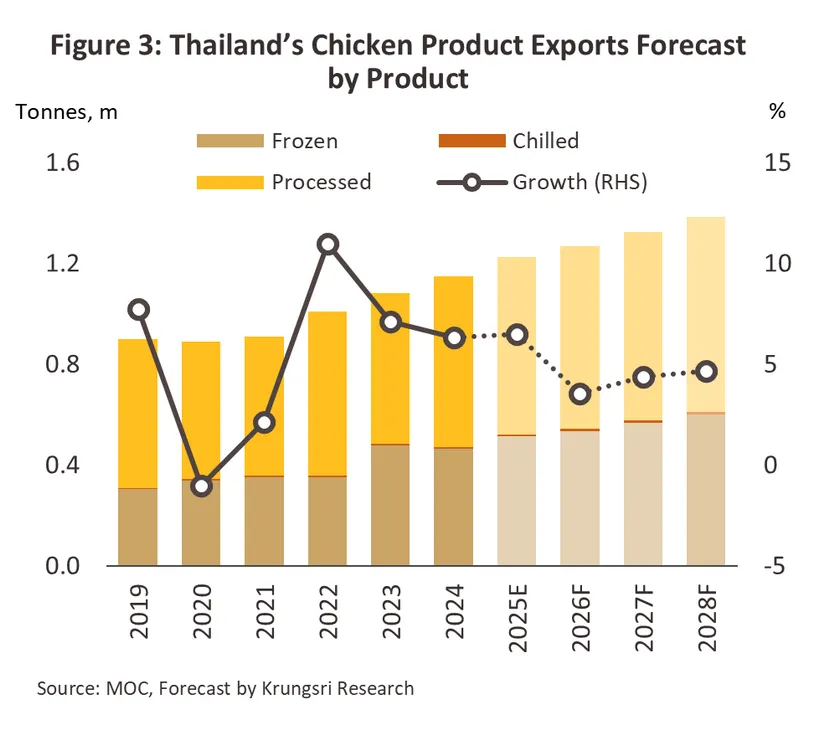
In 2025, Thailand's broiler chicken production is likely to expand at a modest rate of 0.8-1.8%. The upward momentum from rising chicken prices incentivizes farmers to increase production, while both domestic and export markets are experiencing slower growth due to indirect impacts of U.S. import tariffs on the economic conditions and purchasing power of both Thailand and its trading partners. Domestic consumption is expected to grow by 0.5-1.5% from (1) some consumers shifting to increased chicken consumption as a substitute for pork, which has seen price increases at a higher rate than chicken; (2) health-conscious consumers choosing to consume more chicken as it is a healthy food with high protein and low fat at an affordable price, which suits the current situation of high cost of living; (3) government measures to stimulate consumption in the latter part of the year (‘Half-Half Plus’ co-payment program, effective from 29 October – 31 December 2025). Meanwhile, export volume in the first 9 months grew by 6.1% YoY, with full-year 2025 export volume expected to expand by 6.0-7.0% from (1) the competitive advantage of chicken products as an affordable protein source; and (2) greater export market expansion into the Middle East region, which represents a consumer group with continued purchasing power and confidence in the quality and safety of Thailand's production processes according to Halal standards. Meanwhile, the impact from U.S. tax policy remains limited, as exports of chicken products from Thailand to the U.S. market account for a small proportion, accounting for only 0.003% of the total value of Thailand's processed chicken exports in 2024.
2026-2028 Outlook
-
Overall chicken-product production volume is projected to grow by 1.7-2.7% per year, reaching 3.6-3.8 million tons annually, supporting both domestic and foreign demand, which tends to increase. Similarly, domestic sales volume is expected to expand by 1.7-2.7% per year. Demand is still likely to slow down in 2026 due to purchasing power that will remain subdued in line with economic conditions, before gradually recovering in 2027-2028. The momentum comes from (1) activities in the business sector, tourism sector, and restaurant business that will pick up; (2) consumers still seeking affordable products, with chicken meat remaining a primary option, and if Thailand imports more corn or soybean meal from the U.S., it will help reduce animal feed costs; (3) the health-conscious trend favoring high-protein, low-fat foods; (4) chicken meat meeting religious and sustainability requirements, emitting less greenhouse gases than pork or beef; and (5) the development of diverse ready-to-eat processed chicken products that are convenient for fast-paced lifestyles.
-
As for chicken product export volume, growth is expected to slow to 3.7-4.7% per year. Growth will be driven by (1) market expansion through trade cooperation, both with Middle Eastern countries as a Halal market and with neighboring countries such as Lao PDR and Malaysia, where Thailand still has a logistics cost advantage; (2) foreign consumers still choosing to consume affordable protein amid high cost of living; (3) Thailand's reputation for quality standards in frozen-processed chicken production. Nevertheless, a slowing global economy remains a key constraint on the overall growth of Thailand’s chicken product exports in 2026. Meanwhile, the direct impact on exports to the U.S. and Cambodia is expected to be limited, as these two markets together account for only 0.3% of Thailand’s total chicken product export value.
Canned Fish
Situation in 2025
-
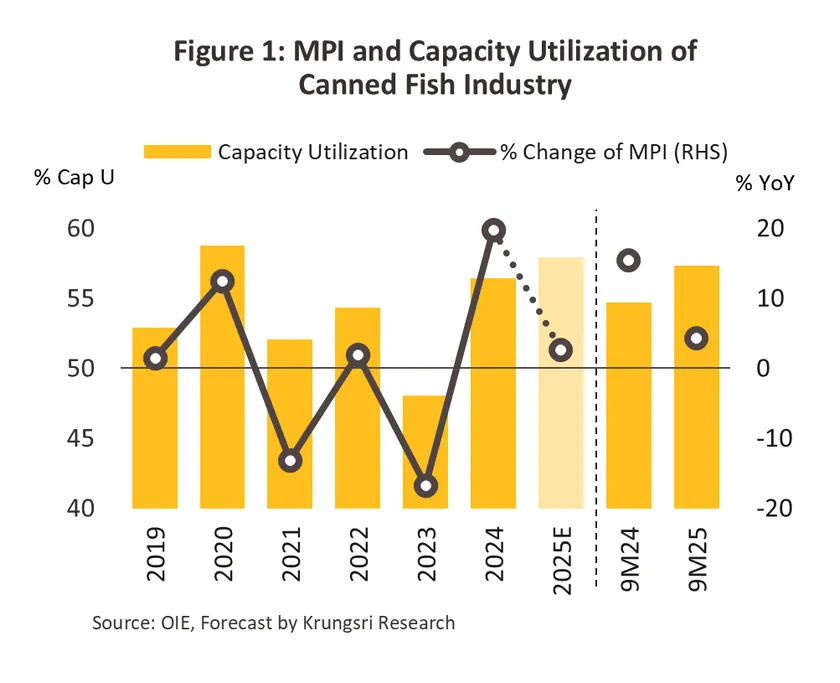
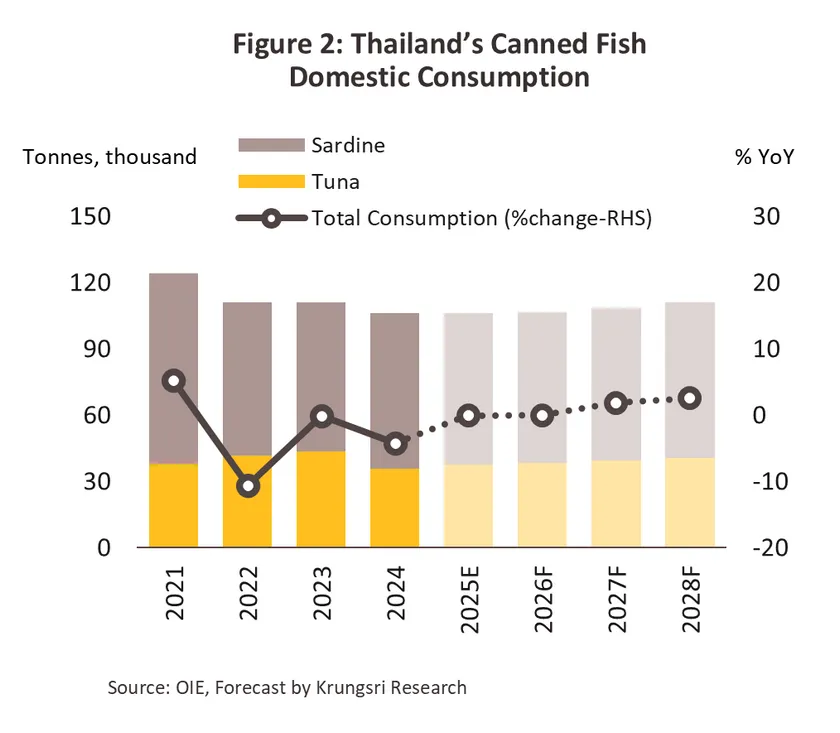
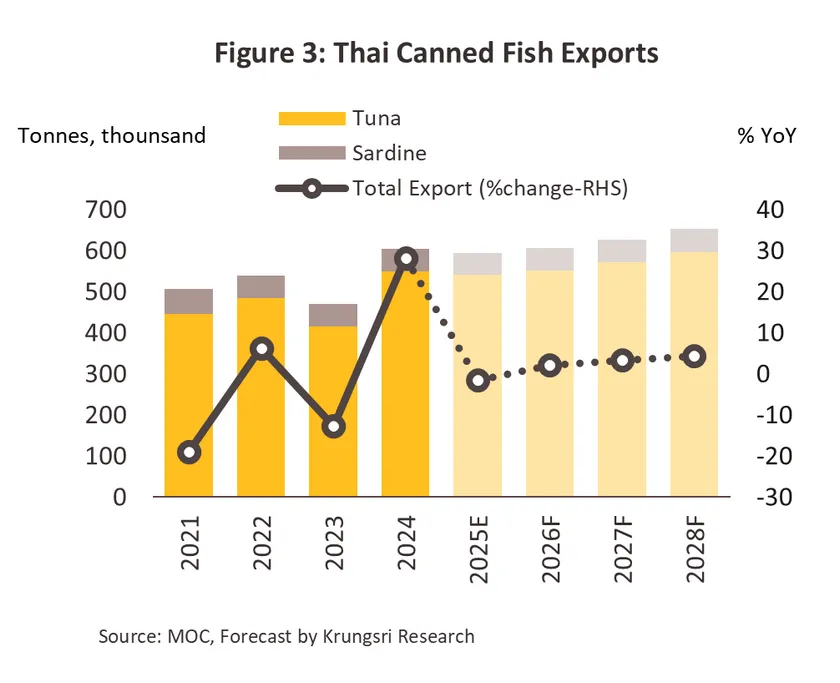
In the first 9 months, production volume expanded by +4.6% YoY, comprising canned tuna (+3.9% YoY) and canned sardines (+8.8% YoY). The main reason was accelerated production for export before the implementation of U.S. tariff barrier measures. Domestic consumption volume remained flat at +0.1% YoY, with tuna expanding by +6.7% YoY due to more diverse product development and meeting health-conscious consumption needs, especially among middle-to-upper income groups; while sardines contracted by -3.1% YoY as consumers reduced food stockpiling and shifted to consuming more fresh food and food outside the home. Thailand's canned fish export volume contracted slightly by -0.3% YoY to 442.9 thousand tons, valued at 1.8 billion U.S. dollars (+0.2% YoY). Canned tuna export volume decreased slightly by -0.2% YoY from the contraction of Middle Eastern markets such as Saudi Arabia, the United Arab Emirates, and Israel following the earlier export surge during the period of geopolitical conflict, as well as U.S. tariff barrier measures causing export volume to the U.S. to expand at a slower rate (+0.3% YoY). Meanwhile, canned sardine export volume contracted by -1.6% YoY from shrinking demand, particularly in South Africa, which is a major market (-20.6% YoY), as it shifted to importing from lower-cost countries, and Cambodia (-19.1% YoY) from the conflict issues along the Thai-Cambodia border and anti-Thai product sentiment.
-
For the remainder of the year, the above supply and demand factors are expected to continue influencing the market, leading to an expected full-year 2025 production volume expansion of 3.3-4.3%. Domestic consumption volume is expected to remain flat, while export volume is expected to contract by -1.1 to -2.1%.
2026-2028 Outlook
-
Canned fish production is expected to expand at a limited rate of only 1.0-2.0% per year from the continued impact of U.S. import tariff policy and constraints on aquatic supply, which will decrease due to the effects of climate change and increasingly severe seawater temperatures, with Thailand still heavily reliant on imported raw materials. Domestic consumption is expected to grow by 1.0-2.0% per year, in line with domestic economic conditions and purchasing power that still tends to be subdued in 2026 before gradually recovering. Canned tuna remains a product with good recovery potential driven by the health-conscious trend. Export volume is expected to expand at an average of 2.7-3.7% per year. Export trends will still have limited expansion in 2026 under pressure from U.S. import tariff measures, but after that, Thai operators are expected to be able to adapt through production process improvements and export market diversification to countries where demand still has growth potential and that accept Thailand's production standards, especially countries in the Middle East region.
FOOD & BEVERAGES
Ready-to-eat food
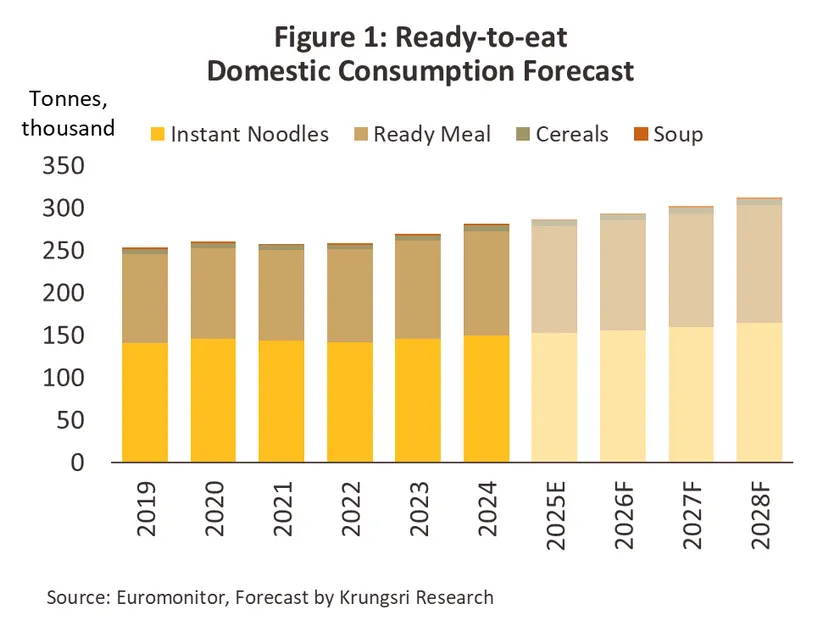
Situation in 2025
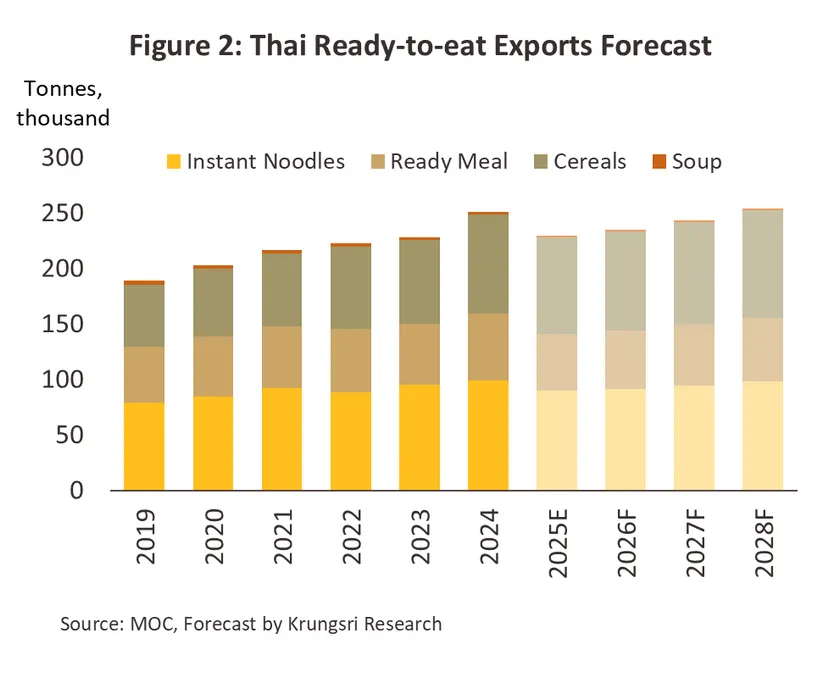
In 2025, domestic sales volume is projected to expand at a low rate of only 1.5-2.5% due to the slowdown in the domestic economy under pressure from U.S. retaliatory tariff measures, the decline in tourist numbers, and political uncertainty, despite positive factors from demand for affordable and convenient food, as well as government measures to stimulate consumption at year-end. Export volume of ready-to-eat food is expected to contract by -8.0 to -9.0% (with the first 9 months contracting -6.6% YoY) from (1) the impact of U.S. tariff barrier measures affecting the import costs of Thai products in the U.S., which is Thailand's number one export market, and (2) the tense situation along the Thai-Cambodia border and anti-Thai product sentiment in Cambodia, which is a major export market for instant noodles from Thailand. The full-year 2025 outlook by product category is as follows:
-
Instant Noodles: Domestic sales are expected to expand by 1.4-2.4% as weak purchasing power causes consumers to be cautious in spending and shift focus to low-priced semi-prepared foods, while exports are expected to contract by -9.0 to -10.0% (9M25 contracted -8.7% YoY) from declining exports to Cambodia.
-
Chilled and Frozen Ready Meals: Domestic sales are expected to expand by 1.8-2.8% from the popularity trend of value for money and time savings amid intense competition from restaurants. Exports are expected to contract by -14.5 to -15.5% (9M25 contracted -12.7% YoY) from the effects of U.S. retaliatory tariff measures.
-
Cereals: Domestic sales are expected to expand by only 0.4-1.4% due to weak economic conditions and purchasing power, causing consumers to choose more filling and value-for-money foods. Exports are expected to contract by -2.5 to -3.5% (9M25 flat at 0.0% YoY) from intensifying competition due to U.S. tariff barrier measures.
-
Soups: Domestic sales are expected to contract by -0.5% to -1.5% as consumers prefer freshly cooked food, coupled with the global health-conscious trend, particularly reducing high-sodium foods, resulting in the export market expected to contract by -10.0 to -11.0% (9M25 contracted -10.2% YoY).
2026-2028 Outlook
-
Domestic sales volume is projected to grow by an average of 2.3-3.3% per year from (1) fast-paced lifestyles causing consumers to focus on convenient and long-shelf-life foods; (2) the use of technology enabling manufacturers to understand consumer behavior and develop products more targeted to specific groups; (3) the expansion of convenience stores that increase distribution channels; and (4) product development in collaboration with stores and celebrity chefs to create a new image for products. However, growth will still be pressured by the economic slowdown, resulting in a modest expansion rate in 2026 before gradually increasing in 2027-2028.
-
Export volume of ready-to-eat food is expected to grow at an average of 2.9-3.9% per year. In 2026, growth will still be limited from (1) the slow global economic recovery; (2) U.S. retaliatory tariff measures that increase import costs for Thai products; and (3) slowing exports to Cambodia from border issues and anti-Thai product sentiment. However, expansion during 2027-2028 is likely to increase from (1) the gradual recovery of purchasing power in trading partner countries; (2) market expansion in Asia under FTA and RCEP, especially ASEAN, Japan, China, as well as Europe, Australia, and New Zealand; (3) fast-paced lifestyles supporting demand for convenient food; and (4) Thailand's potential as the kitchen of the world from raw material advantages and trading partners' confidence in Thailand's production quality.
Beverages
Situation in 2025
- In the first 9 months, production volume contracted by -5.5% YoY from both non-alcoholic beverages (-6.3% YoY) and alcoholic beverages (-2.3%), in line with declining demand from subdued economic activities and tourist numbers, coupled with export-oriented production declining in line with the slowdown in the global economy. Domestic sales volume contracted by -4.3% YoY, following reduced demand for both alcoholic and non-alcoholic beverages (-3.5% YoY and -4.4% YoY respectively) from (1) subdued domestic demand and high cost of living pressuring public spending; (2) declining domestic tourist numbers; (3) health-conscious trends resulting in consumers reducing consumption of carbonated soft drinks and alcoholic beverages, especially spirits (-15.1% YoY). Export volume contracted by -0.7% YoY. Pressure came from exports to Cambodia, which is a major market (accounting for 13.1% of beverage export volume in 2024), contracting by -27.9% YoY from the conflict issues along the Thai-Cambodia border, resulting in the closure of border trade checkpoints, as well as anti-Thai product sentiment among Cambodians. Meanwhile, exports to the U.S. (accounting for 12.3% of beverage export volume in 2024) were still able to grow well at +20.3% YoY, partly as a result of accelerated orders for beverages, especially non-alcoholic types such as fruit juices, before the implementation of U.S. tariff measures. Production volume in 2025 is expected to contract by -6.0% to -7.0%. Domestic sales volume is expected to contract by -4.2% to -5.2%, while export volume is expected to contract by -0.5% to -1.5%.
2026-2028 Outlook
-
Production is expected to grow at an average of 3.0-4.0% per year, supporting both domestic and foreign demand trends that are expected to recover during 2027-2028. Domestic sales volume is expected to increase by 2.1-3.1% per year. Demand trends will still remain subdued in 2026 before gradually improving from the momentum of (1) tourist numbers and domestic demand gradually recovering; (2) the growth of cities and modern retail stores that will facilitate easier access to products; and (3) operators' new product development to specifically respond to consumer needs, especially health beverages such as reduced sugar content, vitamin fortification, or herbal body tonics, as well as marketing to reach modern customers. Despite factors that may limit growth in alcoholic beverage sales, such as modern consumers becoming more health-conscious, export volume is expected to expand by 1.9-2.9% per year from gradually recovering economic conditions and purchasing power during 2027-2028. However, it may still face several pressuring factors that limit growth, including (1) the impact from U.S. retaliatory tariff measures, which is one of the major markets; (2) the conflict issues along the Thai-Cambodia border, resulting in the closure of trade checkpoints and anti-Thai product sentiment; (3) the investment expansion of Thai and foreign manufacturers in CLMV countries that may erode import demand for beverage products from Thailand.
ENERGY & UTILITIES
Power Generation
Situation in 2025
-
During 9M25, electricity consumption contracted by -3.3% YoY, in line with the economic slowdown in Q3 amid weakened domestic purchasing power constrained by high household debt, prompting more cautious spending. In addition, the transition toward La Niña conditions reduced cooling-related electricity demand. Industrial electricity consumption declined by -2.2% YoY, while the commercial and household sectors fell by -1.6% and -5.7% YoY, respectively. Peak electricity demand reached 34,568.3 MW in April, down -5.2% from the 2024 peak. For the remainder of the year, electricity demand is expected to edge up slightly on year-end festive economic activity, resulting in full-year 2025 system demand contracting by an average of -2.5% to -3.5%, compared with growth of 5.2% in 2024.
-
Power generation in the system declined by -4.0% YoY. Output from IPPs (25.6% share) fell sharply by -13.9% YoY, while SPPs and VSPPs (combined 28.4% share) were broadly flat, down -0.03% YoY. EGAT generation (28.9% share) declined by -5.9% YoY, while electricity imports from neighboring countries (17.1% share) rose 11.3% YoY due to more favorable pricing than domestic generation costs. By fuel type, natural gas (54.2% share) decreased by -11.8% YoY, whereas coal (15.0%) and renewables (10.5%) increased by 5.3% and 3.1% YoY, respectively.
-
Installed renewables capacity rose 31.1% over 7M25 to 13,015.7 MW.1/ Most of this came from solar, whose installed capacity surged 94.5% YTD. New capacity from both solar and waste-to-energy will continue to come online through the rest of the year. Total renewables capacity should therefore reach 14,000 MW by the end of 2025, close to the target of 14,845 MW.
2026-2028 Outlook
-
Demand should strengthen by 2.5-3.5% annually on gradual economic growth, especially in the service sector, though demand for clean energy from emerging industries (e.g., data centers) is expected to rise more rapidly. This will be helped by government initiatives including the forthcoming PDP2025 and the rollout of direct PPAs, which will allow private-sector renewables generators to use the national grid to distribute electricity directly to their customers. The government is also broadening access to renewables through its ‘Utility Green Tariff’ and the issuance of Renewable Energy Certificates (RECs), though delays to new regulations and worsening competition among renewables suppliers will weigh on investment growth. The outlook for individual segments is as follows.
-
IPPs: Revenue will strengthen steadily on rising demand, itself lifted by growing economic activity and increasing investment in natural gas-fired power stations in the South and the Northeast, new domestic renewables and hydrogen plants, and renewables projects overseas.
-
SPPs: Revenue will rise gradually, helped by an uptick in economic activity in the EEC and the rollout of the PDP2025 and the AEDP2024. However, income growth will be limited by the high cost of clean-energy technology and uncertainty over natural gas prices.
-
VSPPs: Revenue will rise sharply on: (i) expected purchases of more than 10,000 MW of renewables by 2027 (as per PDP2018); and (ii) the BOI’s waiving of corporate tax for renewables generators. Nevertheless, there may be a shortfall in the supply of inputs (e.g., biomass and biogas) and so new entrants to the market may have difficulty accessing these.
1/Does not include 2,918 MW of large-scale hydro-power generation.
Renewable Energy
Situation in 2025
-
In 9M25, electricity consumption declined by 3.3% YoY, driven by softer economic activity and lower temperatures amid the transition to La Niña conditions. Meanwhile, the business and industrial sectors increased their use of renewable (green) electricity, with companies such as Nestlé (Thai) Ltd. and Siam Piwat Co., Ltd. adopting the Utility Green Tariff (UGT1)1/. Total green electricity generation reached 18,102 GWh (+3.1% YoY), accounting for 10.5% of total electricity output. As of July 2025, cumulative installed renewable capacity stood at 13,016 MW2/ (+31.1% from end-2024), with solar power contributing 50% (6,510 MW, +92.5% from end-2024), followed by biomass (28.8%), wind (11.9%), and others (biogas and waste, 9.3%).
-
For the full year, overall electricity demand is expected to contract by -2.5% to -3.5% from 2024, but demand for green electricity will continue to rise in line with the global transition to clean energy. Green electricity generation is forecast at 23,900 GWh (+3.0% YoY), supported by new capacity additions, especially from solar energy.
2026-2028 Outlook
-
Overall electricity demand is projected to grow by 2.5–3.5% annually, while green electricity demand will rise significantly, driven by:
-
Greater demand for clean energy from businesses and industry to enhance competitiveness amid pressure from supply-chain partners and stricter trade regulations (e.g., the EU CBAM);
-
Continued growth in EV adoption, averaging 11–12% per year, with the draft PDP2024 targeting EV-related electricity demand at 20% of total consumption by 2037;
-
Foreign investment in data centers by global tech firms committed to 100% renewable energy use or RE100 (e.g., Google and Microsoft by 2030), along with multinationals operating in Thailand (e.g., Nestlé, Unilever) pursuing similar goals (Figure 3).
-
Renewable electricity generation is expected to grow by 4.0–5.0% annually, supported by:
-
Government incentives, including long-term purchase contracts with SPPs/VSPPs, BOI tax benefits for investments in renewable energy, and the goal of increasing clean energy to over 50% of total power generation by 2037 under the draft PDP2024, which aligns with Thailand’s revised 2050 Net-Zero target (15 years earlier than the previous 2065 goal);
-
Declining technology costs, especially for solar panels (prices down -42.2% from 2019) and battery energy storage systems (BESS) (prices down -35.9% over the same period).
-
Challenges facing the industry will include: (i) delays in government policy, including finalization of the new PDP (currently under consideration) and the development of the regulatory environment required to support demand for green energy; (ii) Thailand’s modest economic growth outlook, which may dampen overall electricity demand; and (iii) issues related to intermittency and the cost of renewable power.
1/Currently, the tariff for unspecified-source green electricity (UGT1) is THB 0.06 per unit higher than the standard electricity tariff, due to management costs and the cost of renewable energy certificates (RECs).
2/Does not include 2,918 MW of large-scale hydro-power generation.
Oil Refineries
Situation in 2025
-
In 8M25, domestic consumption of refined products declined by -0.9% YoY. This reflected a -2.1% YoY drop in diesel consumption, driven by weaker industrial activity (the 9M25 MPI fell -1.0% YoY), alongside increases of 0.6% and 7.4% YoY in gasoline and bunker fuel demand, respectively.
-
Thai gross refinery margins (GRMs) contracted in line with the declin in global oil prices, with Dubai Crude down -14.4% YoY (January-September) to an average of USD 70.1/bbl on increased output by OPEC+. However, an expansion in Chinese supply meant that falls in prices for refined products were sharper than for crude, and so domestic prices for diesel and E-20 dropped by respectively -16.5% and -24.0% YoY. GRMs will broaden slightly through the rest of 2025 thanks to greater end-of-year travel and the impact of government stimulus packages on tourism and consumption, which will lift demand for middle distillates. For 2025 overall, Dubai Crude should average USD 70/bbl (-12.3%), while demand for refined products should be -0.5% to 0.5% of last year’s level. This will keep GRMs in the range of USD 3.5-4.5/bbl.
2026-2028 Outlook
Krungsri Research sees refineries enjoying gradually improving conditions over the next few years. Slow growth in the global economy will keep average Dubai Crude prices at USD 67-70/bbl, although geopolitical tensions may cause periodic price spikes. The outlook for the refining industry is as follows.
-
Consumption of refined products will grow by 1.5-2.0% annually, mirroring forecast 1.5-2.5% growth in the Thai economy. The latter will be driven in particular by the tourism sector, with foreign arrivals expected to return to their pre-Covid level by 2028. Demand will further benefit from 1.0-2.0% growth in the number of new ICE-powered vehicles on Thai roads and the continuing growth of the e-commerce sector. As such, gasoline and diesel prices should average THB 33.0-34.0/liter and THB 28.0-29.0/liter respectively.
-
GRMs will run in the range THB 4.0-5.0/bbl, somewhat below the USD 5.0/bbl maintained over 2012-2019. Growth in the economy and steadily rising demand for refined products will keep capacity utilization at 85.0-90.0%.
-
Players will tend to expand their investments in clean energy in line with Thailand’s commitment to achieving net zero emissions. This will include the production of environmentally friendly fuels such as low-sulfur diesel that meets the Euro 5 standards and sustainable aviation fuel. The latter is about 2.5-times more expensive than regular jet fuel and so moving into this market will help to establish sources of long-term income growth.
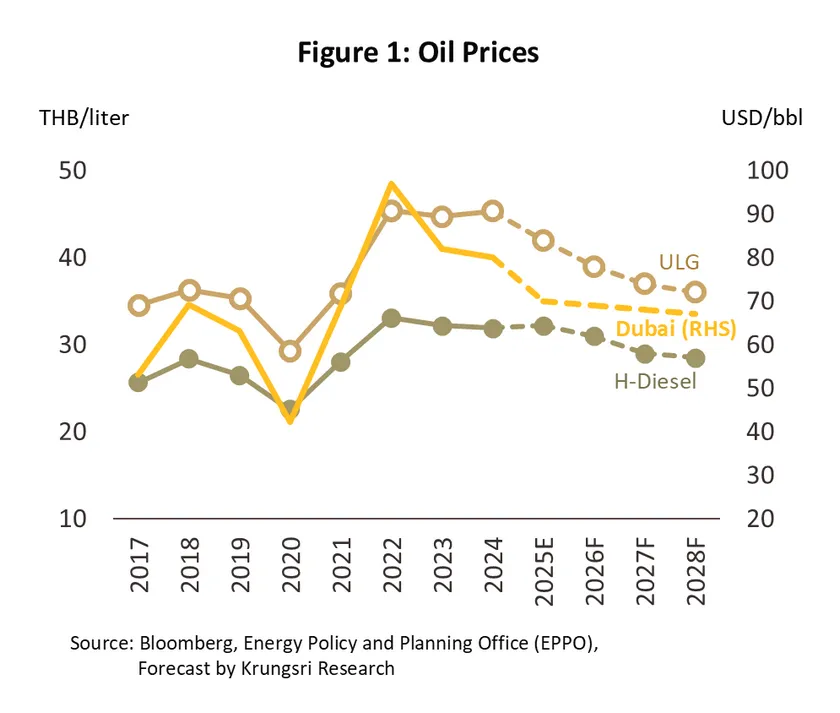
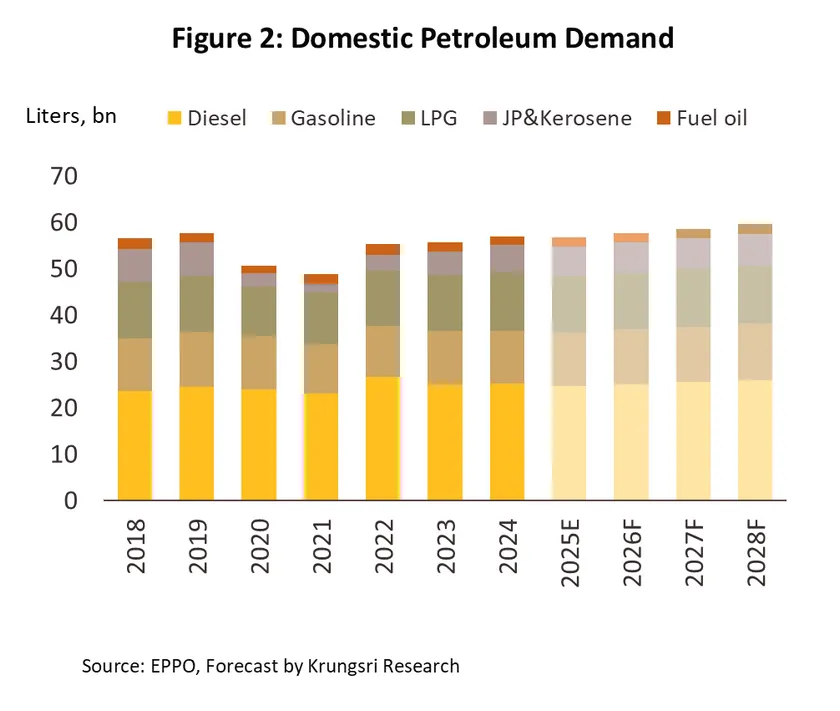
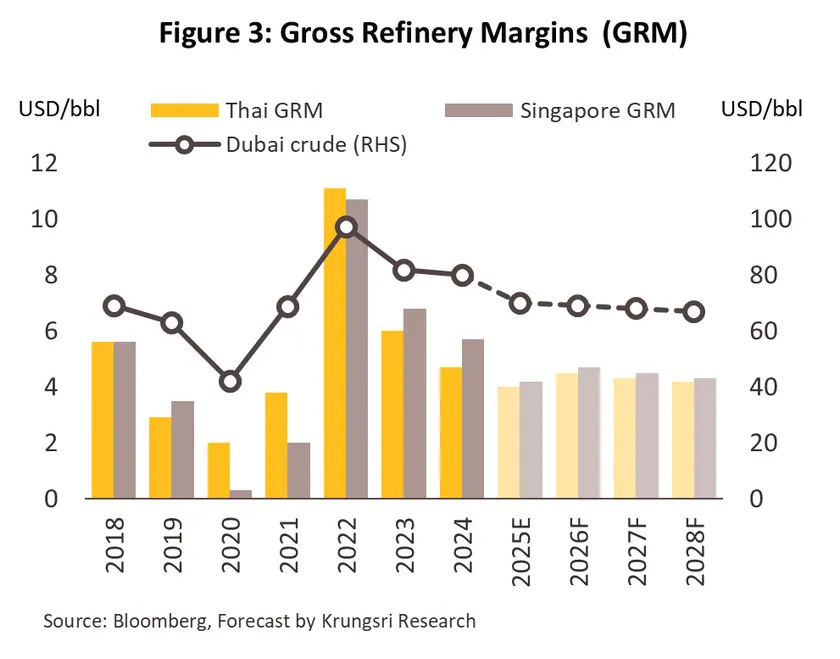
Ethanol
Situation in 2025
-
In 9M25, demand for ethanol strengthened to an average of 3.46 million liters/day, representing a modest 1.4% YoY increase. This growth remains below the pre-pandemic average of 3-4% annually, reflecting: (i) softness in consumption and in the tourism sector, which dragged on overall growth in the economy; (ii) the 60.4% YoY rise in new BEV registrations; and (iii) cuts in the fares charged on Bangkok’s Red and Purple metro lines to THB 20, which will be in place until 30 September 2025. Demand will pick up through the rest of 2025 as the onset of end of year celebrations stimulates travel and social activities. Nevertheless, ongoing sluggishness in the economy will weigh on demand for travel and transport services, and so the forecast is for 2025 ethanol demand to be up by 1.4% to 3.48 million liters/day.
-
Ethanol production contracted -5.6% YoY to 3.48 million liters/day. Production was down -0.9% YoY from molasses (to 2.07 million liters/day), -12.1% YoY from cassava (to 1.24 million liters/day) and -8.7% YoY from sugarcane (to 0.17 million liters/day). Stronger demand will lift production through the rest year, helping to keep the year’s decline to -1.4% YoY. Capacity utilization will drop from 52.2% to 49.6% for 2025.
-
The ethanol reference price crashed -35% YoY to THB 20/liter in the period. This was caused by sharp falls in the price of molasses (-69.9% YoY to THB 5.6/kg), fresh cassava (-33.2% YoY to THB 1.6/kg) and cassava chips (-21.4% YoY to THB 5.3/kg). This then brought average costs for molasses-based production down by -62.7% YoY to an average of THB 31.0/liter. Likewise, the cost of manufacturing ethanol from fresh cassava and cassava chips slipped by respectively -21.7% and -14.7% YoY to averages of THB 18.3 and THB 21.9 per liter.
2026-2028 Outlook
Nevertheless, ethanol demand will come under pressure from the ongoing transition from ICE-powered vehicles to EVs and sluggish economic growth limiting on consumer spending power. Slow growth in demand will continue to add to problems with excess capacity. It remains to be seen how the recent agreement to allow imports from the US (part of the Reciprocal Trade Framework) will affect this, though this certainly has the potential to amplify pre-existing stresses within the industry.
Biodiesel
Situation in 2025
-
In 8M25, production of biodiesel (B100) fell -18.9% YoY to 3.85 million liters/day, while consumption slumped -25.3% YoY to 3.4 million liters/day. Declines were driven by slowing growth in private-sector consumption (+2.3% YoY in 1H25), weaker than expected growth in the tourism sector, and high levels of household debt that have depressed spending on travel and consumer goods and thus impacted demand for transport services.
-
Consumption will strengthen through the end of 2025 thanks to the stimulus effects on consumption of the ‘Half-half Plus Copayment Program’ and travel and spending connected to the end of year celebrations. Nevertheless, the Thai economy is losing momentum, and this will drag on any expansion in demand for biodiesel. 2025 output is therefore forecast to slip by -14.4% to 3.9 million liters/day, while consumption will average 3.6 million liters/day (-18.0%). This will then bring capacity utilization down from 2024’s 39.1% to 33.5%.
-
The biodiesel price climbed 9.7% YoY over 9M25 on higher prices for crude palm oil (CPO). This increase was primarily due to floods and droughts in the south of Thailand, which reduced yields in the first quarter of the year. Thus, CPO stocks contracted -32.4% YoY, while average prices for CPO and palm stearin climbed by respectively 11.6% YoY to THB 37.1/kg and 11.3% YoY to THB 37.5/kg.
2026-2028 Outlook
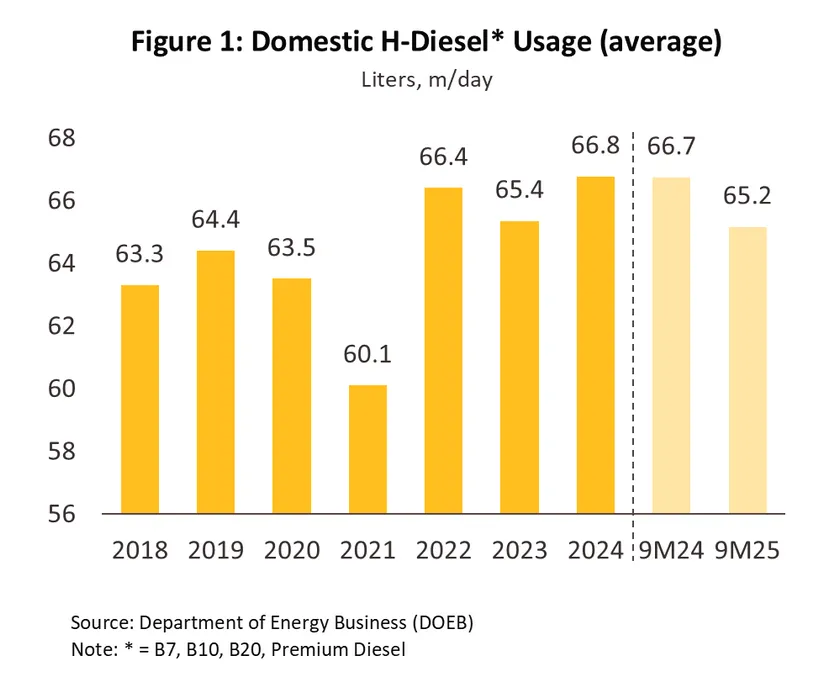
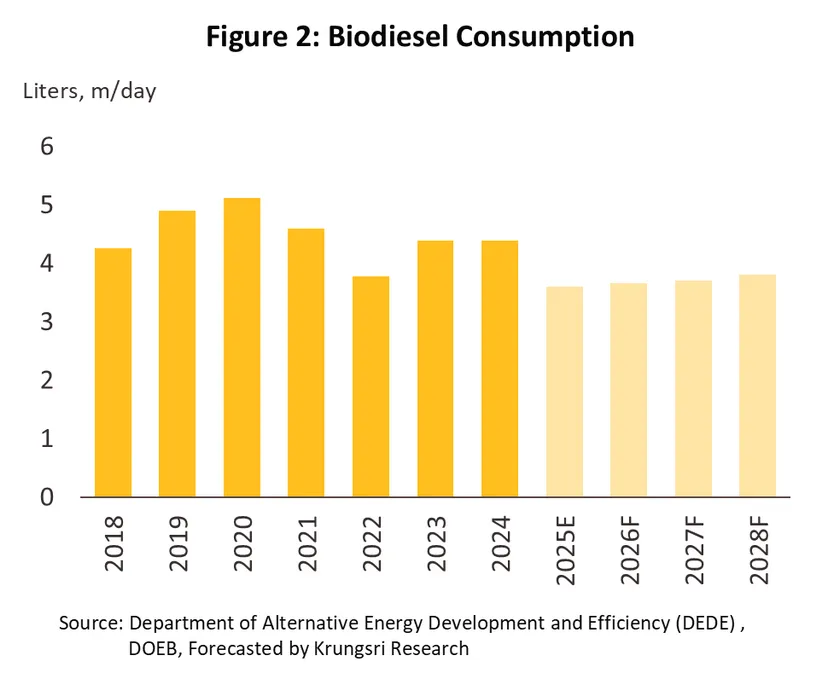
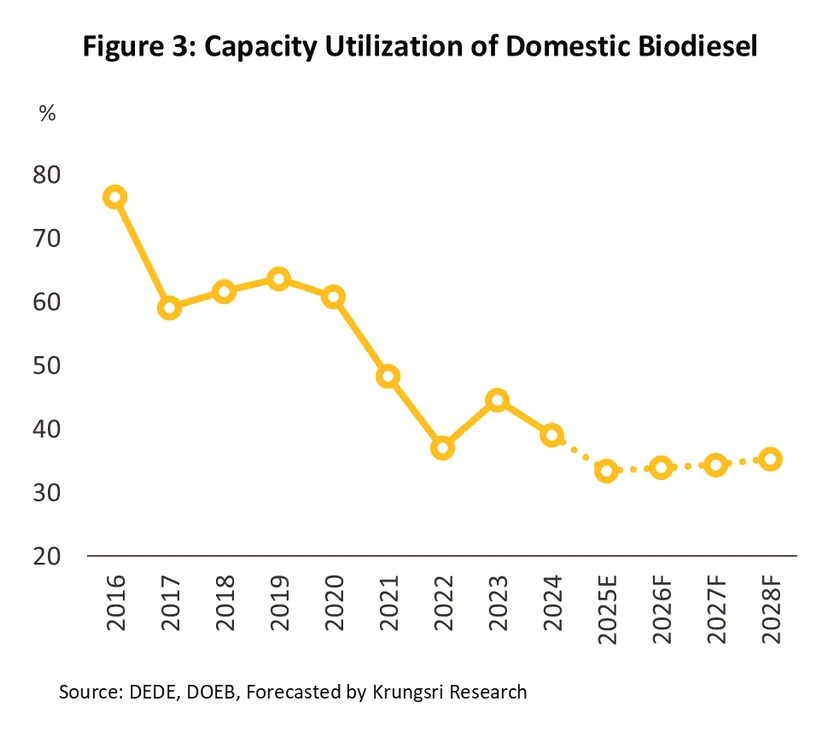
PETROCHEMICALS
PETROCHEMICALS
Situation in 2025
-
In 9M25, consumption of petrochemical products grew by 4.6% YoY, supported by stronger demand from the food and beverage industry, which led to higher sales of ethylene (+7.3% YoY), polyethylene (+6.8% YoY) and polypropylene (+10.1% YoY). However, manufacturing sector contracted and with the industry MPI down -1.0% YoY, consumption of some petrochemical products declined. On the other hands, export rose 9.6% YoY as buyers accelerated orders ahead of the enforcement of US tariffs. Although a global supply glut pressured product prices, the drop in crude oil prices (Dubai crude averaged USD 70/bbl, down -14.4% YoY) reduced input costs, helping maintain stable spreads and even allowing for slight improvements in some cases.
-
For the rest of 2025, government stimulus packages and New Year celebrations will boost demand for consumer goods and so for the year, consumption and exports of petrochemical products will be up by respectively 4.0-5.0% and 8.5-9.5%. Market conditions through 9M25 were as follows.
-
Naphtha: Prices averaged USD 607/tonne, down -12.1% YoY on lower crude prices. 2025 prices should average UD 600.0/tonne.
-
Upstream products: 9M25 spreads for ethylene and propylene averaged respectively USD 261.5/tonne (-1.6% YoY) and USD 191.9/tonne (+13.3% YoY) and for the year, these should run to USD 260.0 and USD 190.0 per tonne.
-
Downstream products: Spreads averaged USD 28.8/tonne for HDPE (-1.5% YoY) and USD 104.3/tonne for polypropylene (+0.5% YoY). These are expected to remain at USD 27.0 and USD 104.0 for all of 2025.
2026-2028 Outlook
-
Consumption and exports of petrochemical products are expected to grow by 1.5-2.5% annually, supported by Thailand’s economic expansion (forecast at 1.5-2.5% per year) and global economic growth (the IMF projects 3.0-3.2% per year). These factors will boost demand from downstream industries, especially for packaging used in the food and beverage sector. However, headwinds will include restrictions on single-use plastics, new manufacturing capacity in China and the Middle East adding to the existing supply glut in some segments, and the diversion of Chinese exports into the Thai market. These factors will all exert downward pressure on product prices, resulting spreads to remain flat or narrow slightly.
-
Players will tend to switch to the production of higher value specialty products that better meet the needs of the ‘S-curve’ industries. Growing interest in environmental issues and pressure to meet the ESG goals will also encourage an increase in the production of food-grade biodegradable and recycled plastics.
CHEMICAL
Pharmaceuticals
Situation in 2025
-
Growth in pharmaceutical sales slowed through 9M25. The number of individuals reporting an illness increased in 1H25, jumping 48.0% YoY for notifiable diseases and 58.5% YoY for respiratory illnesses, while foreign patients continued to seek treatment in Thai hospitals. However, the introduction of co-payment provisions to private health insurance (from March 2025) and softening purchasing power encouraged consumers to buy only medicines that were strictly necessary and to avoid unjustified medical treatments. Infections will continue to rise with the onset of the cold season and so 2025 pharmaceutical sales should be up by 3.5-4.5%, down slightly from 2024’s growth of 4.5-5.5%. Details of market conditions over 9M25 are as follows.
-
Domestic consumption of pharmaceuticals1/ rose due to higher seasonal infections in 1H25, including influenza (+80.4% YoY) and pneumonia (+36.6% YoY). This was split between increases of 1.6% for tablets (52.8% of the market by value), 4.8% YoY for capsules (7.3% of the market) and 6.7% YoY for injectables (6.2%). However, sales contracted -9.8% YoY for solutions (19.3% of total sales) and -4.8% YoY for creams (8.7%).
-
Exports rose 8.4% YoY by volume but contracted -3.5% YoY by value due to a -5.6% YoY drop in prices for medical treatments (93.4% of exports). Sales into the important CLMV market (42% of all exports) dropped -10.6% YoY but by value, exports of vaccines (6.6% of the total) jumped 39.4% YoY on stronger demand from Hong Kong (+44.3% YoY). By volume and value, imports of pharmaceuticals were up by respectively 11.7% and 6.9% YoY, partly due to a rise in imports of vaccines from European and Asian suppliers (e.g., in Germany, the US, Italy, South Korea, Japan and China). Imports from South Korea, Japan, Belgium and China (a combined 15.4% of imports by value) rose by both volume and value (up 11.3% YoY), while although imports from India rose 26.0% YoY by volume, they dropped -2.5% YoY by value.
2026-2028 Outlook
-
Sales into the domestic market are expected to expand by 4.0-5.0% annually driven by: (i) Thailand’s transition to an aged society and growing demand for pharmaceuticals for the treatment of non-communicable diseases (NCDs); (ii) government policy that has improved access to treatments, including an expansion of the Universal Health Coverage scheme, the introduction of universal healthcare access via a single ID card, and the extension of telemedicine services; (iii) growing demand for long-term and preventive healthcare, including the use of innovations such as personalized medicine and immunotherapy; and (iv) an increase in investment in the health and wellness industry, particularly in hospitals, and specialized and beauty clinics.
-
Thai pharma manufacturers will increasingly look to add value to their products and cut dependency on imports by accelerating the development of new technologies and manufacturing processes, especially in the areas of biopharmaceuticals and specialized treatments. However, the industry will face constraints on its access to capital, ability to engage in research and development, and degree of acceptance by the medical community. This will then limit public access to advanced treatments.
1/From a survey by the Office of Industrial Economics of domestic companies, most of which manufacture and distribute generics.
Chemical Fertilizers
Situation in 2025
-
Over 9M25, the industry benefited from: (i) better weather that encouraged farmers to maintain or boost output through higher fertilizer use, and as such, yields from major crops were up 6.6% YoY (+ 17.6% YoY for paddy) while for fruits, yields increased 16.5% YoY; and (ii) the rollout of a government policy subsidizing fertilizer purchases to reduce overall production costs. However, average prices for the most important crops dropped -12.5% YoY, and with income falling for almost all farmers, demand for fertilizer softened. For all of 2025, demand for fertilizers is therefore expected to rise 0.5-1.0% to 5.5-5.7 million tonnes. Details of market are as follows:
-
Imports of fertilizers (69.2% straight and 30.8% mixed) totaled 5.5 million tonnes, climbed 2.8% YoY and +2.0% YoY by value to THB 81 billion. Imports from China (19.5% of total) and Malaysia (6.2%) saw particularly strong growth, rising 17.8% and 17.1% YoY, respectively. The need to meet ongoing demand and to build stocks to hedge against rising global prices will lift imports through the rest of the year, and so 2025 imports are forecast to climb by 5.5% to 6.5 million tonnes.
-
Chemical fertilizer exports totaled 350,000 tonnes, down -15.1% YoY, with export value declining to THB 5.9 billion (-11.3% YoY). Shipments to Cambodia (34.0% share) fell sharply by -34.4% YoY, and exports to Vietnam (0.4%) dropped -81.4% YoY. In contrast, exports to Laos (41.8%) and Myanmar (16.3%) increased by 17.6% and 8.3% YoY, respectively, supported by agricultural development projects in Laos requiring higher-quality fertilizers and expanded cultivation and irrigation initiatives in Myanmar. Nevertheless, full-year 2025 fertilizer exports are projected at 350,000–400,000 tonnes, representing a decline of -26.0% to -35.0% from 2024.
-
Import costs edged up slightly on stronger global prices. Average per-tonne import prices for straight and mixed fertilizer thus averaged THB 12,599 (+0.5% YoY) and THB 19,203 (+1.0% YoY). However, government subsidies depressed domestic prices and so the cost of urea (46-0-0) and ammonium sulfate (21-0-0) slid by respectively -2.5% and -3.0% YoY.
2026-2028 Outlook
-
Annual demand is forecast to rise by 1.0-2.0% to an average of 5.65-5.80 million tonnes on: (i) gradual growth in the domestic economy that will lift purchasing power; (ii) the impact of climate change on global harvests, which will add to demand for Thai food and energy crops; and (iii) ongoing government incentives (e.g., to expand the area under cultivation and to promote plant-based foods) that will boost demand for fertilizer.
-
Challenges facing the industry will include: (i) geopolitical tensions that may periodically impact fertilizer-exporting nations, disrupting supply and potentially triggering price spikes; and (ii) greater use of bio- and organic fertilizer and an increased interest in organic farming, partly driven by rising health and wellness concerns.
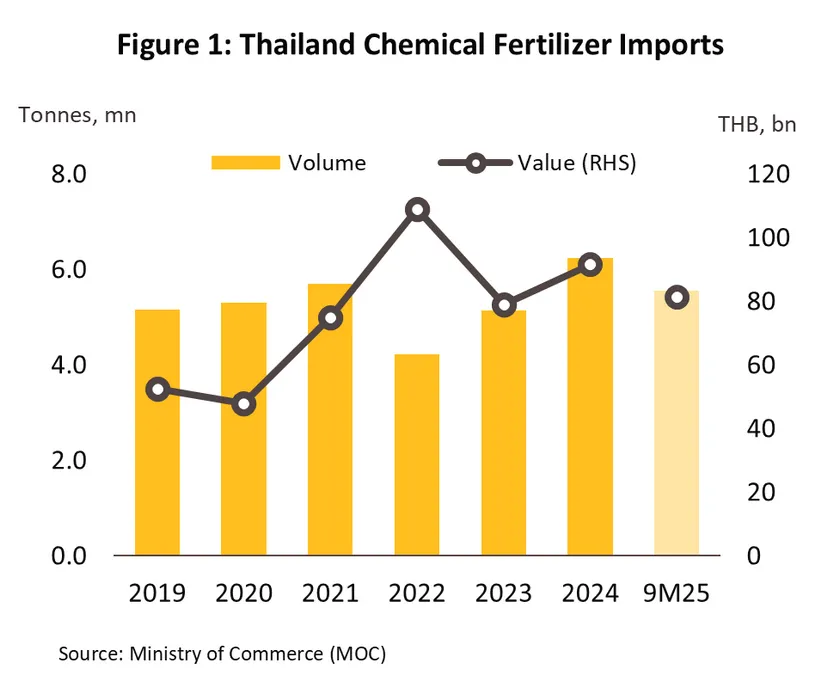
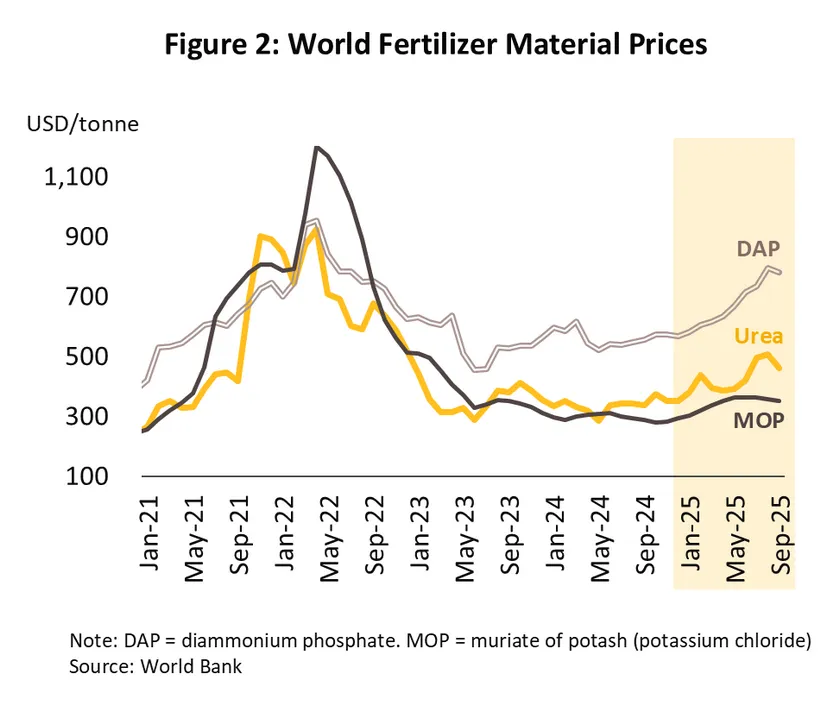
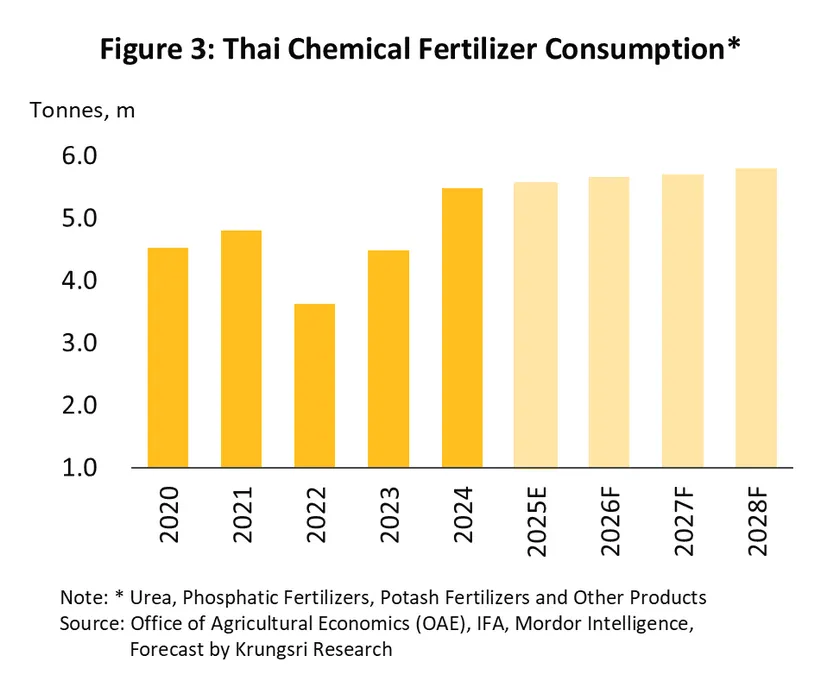
AUTOMOTIVE & PARTS
Automobiles
Automakers
Situation in 2025
-
Production in the first nine months dropped -4.5% YoY to 1,077,244 units, with output of 1-ton pickup trucks and passenger cars declining -5.0% and -3.2% YoY, respectively. However, production of passenger BEVs surged 461.2% YoY to 41,183 units, driven by accelerated manufacturing to meet requirements under the EV 3.0 scheme, which will expire by 2025. Similarly, production of passenger PHEVs and HEVs rose 246.0% and 6.1% YoY, respectively.
-
Domestic car sales rose 2.1% YoY to 447,778 units, driven mainly by a 2.5% YoY increase in passenger car sales. Key factors included higher approvals for auto hire-purchase loans as NPL and SML ratios continued to decline1/, along with strong purchasing power among middle- to high-income consumers. However, sales of 1-ton pickup trucks dropped -10.6% YoY despite support from the “Pickup with Credit Guarantee” scheme, as most target buyers continued to be in a financially vulnerable position and often failed to meet loan approval criteria. These groups included (i) farmers affected by falling agricultural product prices and high household debt, and (ii) SMEs struggling with liquidity shortages amid the economic slowdown.
-
Exports fell -10.4% YoY2/ to 689,118 units, pressured by several factors: (i) sluggish demand from trading partners, (ii) stricter environmental and driving safety standards in EU and the U.S., which limited exports of certain ICE models that failed to meet requirements, and (iii) intensifying global competition, particularly from China’s accelerated EV exports.
-
Driven by these factors, production and exports in 2025 are expected to contract by -4.5% to -5.5% and -11.5% to -12.5%, respectively, while domestic sales are projected to remain flat or decline slightly by around -1.0%.
2026-2028 Outlook
-
Production is expected to stay flat, as ICE output continues to fall. In contrast, XEV output is set to rise, driven by (i) compensatory passenger BEV production under the EV 3.5 scheme at 2–3 times prior import volumes during 2026–2027, and (ii) government incentives for HEV and MHEV manufacturing via excise tax cuts from 2026 to 2032.
-
Domestic sales are expected to increase. However, in 2026, domestic sales will likely remain sluggish, especially 1-ton pickup trucks, amid weak purchasing power in the agricultural sector and businesses affected by U.S. retaliatory tariffs. Demand is projected to gradually recover during 2027–2028, supported by improving business conditions, a rebound in tourism, and sustained XEV growth.
-
Export are expected to contract due to several drag factors: (i) slower trading partners’ economies, especially in 2026, (ii) accelerated clearing of excess Chinese EV supply, and (iii) stricter environmental standards aligned with CO2 reduction targets in partner countries, which will curb Thailand’s ICE vehicle exports. However, passenger BEV exports will benefit from the new BOI rule allowing “producing one EV for export to count as 1.5 units toward production offset”.
-
The above factors are expected to keep automotive output flat, with domestic sales projected to grow 1.0–2.0% YoY and exports to decline -1.0 to -2.0% YoY.
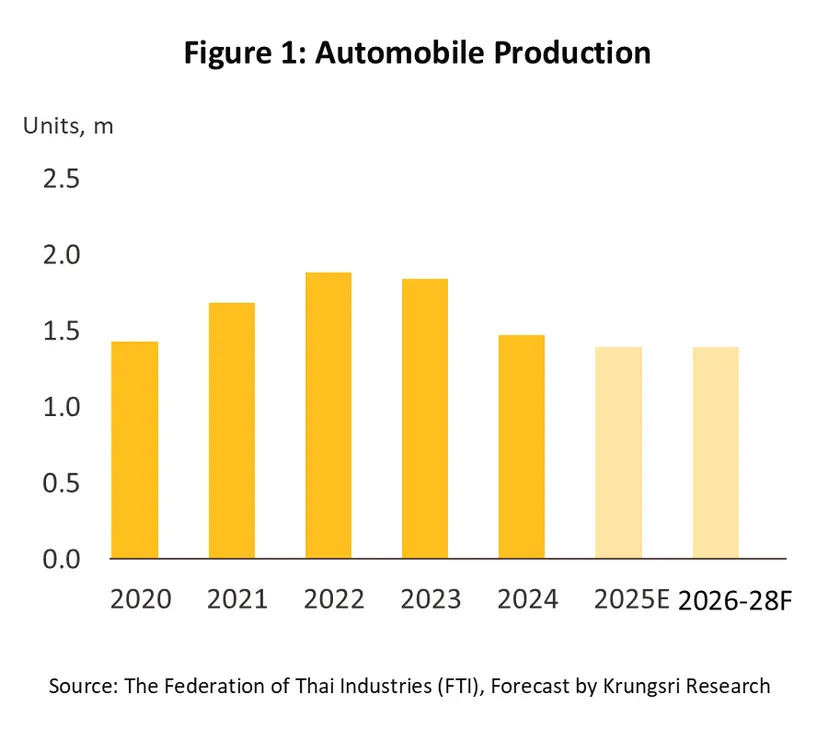
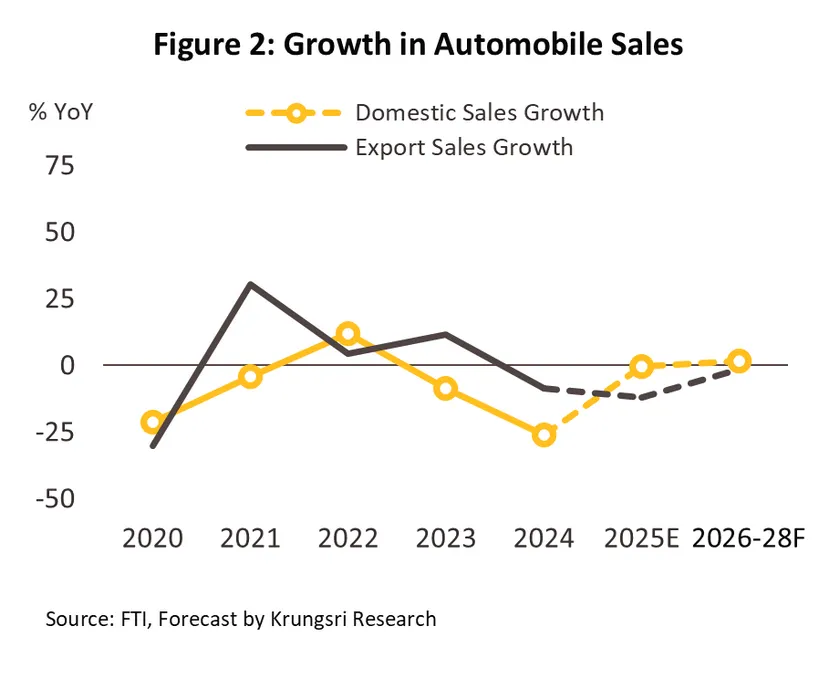
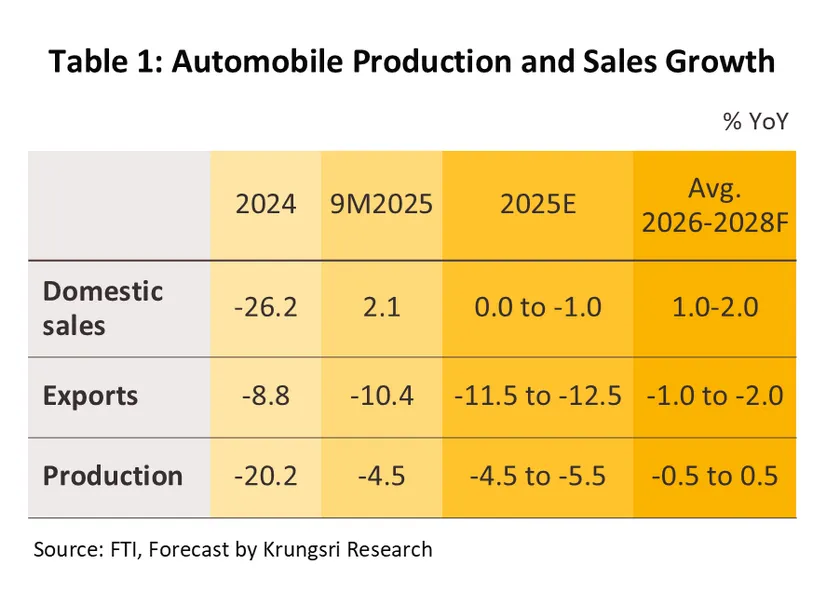
1/Additional details can be found in Industry Outlook 2025-2027: Automobile Industry, pages 12–13.
2/However, Thailand began exporting passenger BEVs for the first time in April 2025, with total exports reaching 3,057 units (cumulative from April to September 2025).
Distributors of new vehicles
Situation in 2025
-
During the first nine months, car sales revenue rose with domestic sales up 2.1% YoY (0.45 million units). Although some dealers were affected by weak 1-ton pickup truck sales, overall market sales benefited from a 2.5% YoY increase in passenger cars, driven by (i) strong purchasing power among middle- to high-income consumers, (ii) higher auto hire-purchase approvals, and (iii) sustained growth in EV demand. Meanwhile, service and spare parts revenue fell after a -9.9% YoY drop in cumulative registrations of vehicles under five years old to 4.46 million units, a result of new car sales contraction since the COVID-19 outbreak.
-
In the remaining months, revenue of new vehicle distributors is expected to stay flat. New car sales will keep declining for ICE vehicles, while EV sales are projected to rise on accelerated promotions ahead of the EV 3.5 scheme’s expiration in 2025. Meanwhile, service and spare parts revenue will drop with registered vehicles under five years old, expected to fall -9.5% to -10.5%.
Outlook for 2026-2028
-
Revenue over the next three years is expected to edge up, in line with domestic car sales projected to grow by an average of 1.0–2.0% annually, supported by a recovery in business activity and tourism during 2027–2028, as well as sustained demand for electric vehicles. However, intense competition from new EV brands and declining ICE car sales will remain key factors weighing on overall dealer revenue.
-
Revenue from maintenance services and spare parts is expected to recover, driven by rising passenger car sales from 2025, which will increase the stock of newly registered vehicles under five years old, the core market for maintenance services. However, growth in revenue from servicing electric vehicles, particularly passenger BEVs, may remain limited due to spare parts shortages and long lead times for parts from parent companies.
Distributors of second-hand vehicles
Situation in 2025
-
In the first nine months, demand for used cars began to recover after hitting the lowest price point in 2024, driven by both improving demand and a decline in repossessed vehicles due to stricter auto loan approvals by financial institutions recently. This helped reduce outstanding NPLs in auto hire-purchase loans. Used car prices rose 5.1% YoY (Figure 3), prompting some consumers to purchase affordable used cars before prices climb further.
-
For the remainder of the year, revenue for used car dealers is expected to increase, supported by pent-up demand from consumers needing vehicles and looking for affordable options amid an economy expected to remain sluggish toward year-end, with used car prices projected to rise only modestly.
2026-2028 Outlook
-
Revenue for distributors is expected to rise, supported by a continued improvement in used car prices driven by a sustained decline in repossessed vehicles, along with an anticipated recovery in economic activity during 2027–2028, underpinned by business and tourism investments. Infrastructure development will further stimulate demand for used vehicles in agricultural and construction sectors. Although the supply of used electric vehicles, particularly passenger BEVs launched in 2022–2023 under the EV 3.0 scheme, may start entering the market, volumes will remain limited.
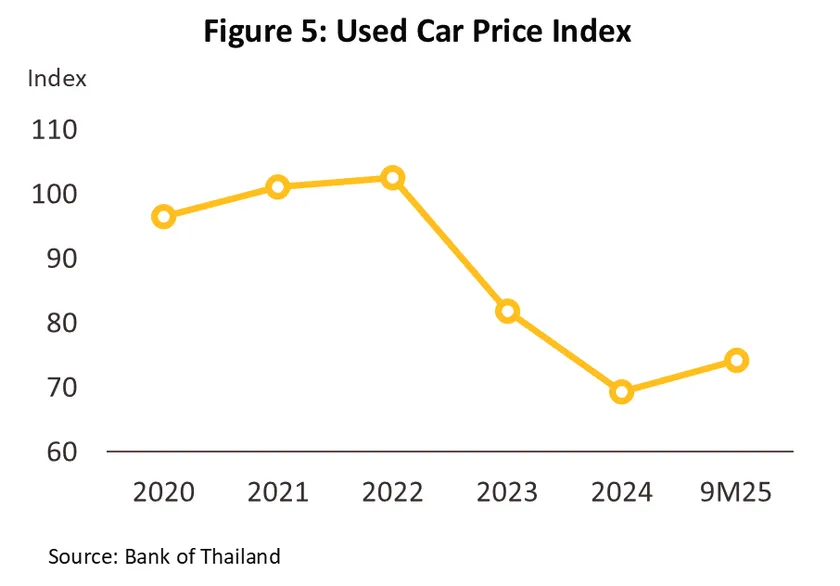
Electric vehicles
Situation in 2025
-
During the first ten months, registrations of electric passenger vehicles (XEV) rose 28.0% YoY to 227,678 units, comprising passenger BEVs at 94,151 units (+63.8% YoY), HEVs at 117,096 units (+4.3% YoY), and PHEVs at 16,431 units (+103.5% YoY). The growth was supported by three key factors: (i) the slowdown in the EV price war, reflected in only modest price reductions during the Motor Show 2025 (March–April)1/, which helped stimulate pent-up demand for passenger BEVs after consumers had previously delayed purchases; (ii) the launch of new XEV models from both Japanese brands and affordable Chinese brands; and (iii) the easing of credit approval standards by financial institutions, which boosted hire-purchase loan approvals for all passenger vehicle categories.
-
New registrations of electric buses dropped -64.9% YoY to 101 units, while registrations of electric commercial vehicles (including pickups and trucks) fell -12.1% YoY to 807 units. The decline was driven by several factors: (i) continued delays in public investment in electric buses since the peak levels in 2022–2023; (ii) high costs of vehicles and charging infrastructure, which remain a major constraint for small businesses seeking to adopt electric vehicles for products transportation2/; and (iii) limitations on driving range and shortages of charging stations in provincial areas, resulting in relatively low new registrations of electric buses and commercial EVs outside major cities.
-
Based on the above factors, registrations of electric passenger vehicles (XEV) in 2025 are expected to reach 262,000 units, including 116,000 passenger BEVs, 127,000 HEVs, and 19,000 PHEVs. Electric bus and commercial EV registrations are projected to fall to 130 and 1,050 units, respectively.
2026-2028 Outlook
-
New registrations of passenger XEVs are expected to rise to 285,000 units, comprising 125,000 passenger BEVs, 132,000 HEVs, and 28,000 PHEVs. Key drivers include: (i) the launch of new models featuring advanced technology and longer driving ranges, with IEA (2025) projecting global BEV and PHEV models to grow at an average 13.0% CAGR during 2024–2030, reaching 1,130 models by 2030, compared to ICE models expected to remain flat at around 1,378 models; (ii) full enforcement of Euro 6 standards starting in 2026, which will raise costs and prices for ICE vehicles relative to EVs; and (iii) a slowdown in Thailand’s EV price war3/.
-
New registrations of electric buses and electric commercial vehicles are expected to rise to 510 and 1,600 units, respectively. Key drivers include: (i) a new wave of investment in electric bus services through a procurement-for-lease project for 1,520 electric buses, with deliveries planned to begin in late 2026; (ii) the launch of new electric commercial vehicle models, particularly BEV pickups from leading Japanese manufacturers in Thailand4/; and (iii) declining battery production costs driven by economies of scale, with IEA (2025) projecting global electric truck prices to fall by around 15–35% by 2030 and achieve total cost of ownership parity with diesel trucks for long-haul transport.
1/Further details are available in EV Price War: Will EV Prices Drop Further or Is This the Bottom? (p. 7–9).
2/For electric trucks with an 800 kWh battery, the vehicle acquisition cost accounts for about 20–25% of the total cost of ownership (TCO), compared to roughly 10% for large diesel trucks averaging 500 km per day. In addition, businesses investing in electric buses or electric commercial vehicles must install charging equipment and electrical systems, adding further infrastructure costs (Source: IEA, 2025).
3/Net profits of EV manufacturers have continued to decline amid intense competition, along with rising domestic production of passenger BEVs under EV 3.0–3.5 measures, which still carry higher unit production costs compared to imported BEVs from China in previous periods. Further details can be found in EV Price War: Will EV Prices Drop Further or Is This the Bottom? .
4/Examples include Toyota Hilux BEV and Isuzu D-Max EV (Source: Autolifethailand, April 29, 2025; Prachachat Turakij, August 23, 2025)
Motorcycles
Situation in 2025
-
During the first nine months, motorcycle production rose 5.5% YoY to 1,514,942 units, driven by domestic demand accounting for over 80% of total sales. Meanwhile, production of electric motorcycles reached 2,155 units, compared to zero in the same period last year, as manufacturers sought to offset imports under the EV 3.0 scheme (2022–2023). However, this volume represents only 0.07 times the number of units imported under EV 3.01/, falling short of the 1–1.5 times requirement, and accounts for just 0.1% of overall motorcycle production.
-
Domestic sales rose 2.6% YoY to 1,315,346 units, driven by higher sales in (i) 125 cc motorcycles, up 16.2% YoY on sustained demand from delivery riders, and (ii) 250–399 cc motorcycles, up 8.0% YoY in line with increased approvals for hire-purchase loans for mid- to large-sized motorcycles and strong purchasing power among middle- to high-income consumers. However, sales of 110 cc motorcycles continued to decline -8.1% YoY, reflecting weak purchasing power among lower-income consumers amid persistently high household debt, particularly farmers affected by depressed agricultural commodity prices.
-
Exports resumed a downward trend, falling -0.4% YoY to 300,700 units, driven by (i) a decline in shipments to the U.S. starting in September 2025 after the rush to export orders for stockpiling ahead of U.S. retaliatory tariffs, which had pushed export value to the U.S. up 50.9% YoY during April–July 2025; and (ii) sluggish demand from other trading partners amid continued global economic uncertainty.
-
For all of 2025, production and domestic sales are expected to grow 3.5–4.5% and 2.0–3.0%, respectively, while exports are projected to contract -2.0% to -3.0%.
2026-2028 Outlook
-
Production is expected to grow by around 1.5–2.5% annually, supported by rising domestic and export demand. Roughly 95% of total domestic output is projected to remain ICE motorcycles, while EV motorcycle production will expand only marginally due to speed and range limitations that still fall short of Thai consumer needs. Moreover, the total cost of ownership remains high and is not yet attractive for commercial use. This is reflected in the very small share of cumulative EV motorcycle registrations under the 3.0 scheme in recent periods, and only a limited increase is anticipated under the 3.5 scheme.
-
Domestic sales are expected to rise by around 1.5–2.5% annually, driven mainly by 125 cc motorcycles in line with the continued expansion of ride-sharing and food-delivery services. During a period when purchasing power is still awaiting recovery amid a slowing economy, some consumers who require a vehicle for transport and commuting may opt for motorcycles instead of cars, given the lower ownership costs and more accessible loan approval conditions.
-
Exports are projected to grow slightly by about 0.5–1.5% annually, supported mainly by rising demand for big bikes as consumer purchasing power in key trading partners begins to recover during 2027–2028. Meanwhile, exports of small motorcycles will remain constrained by intensifying competition from electric motorcycles, particularly in major export markets such as China, India, and ASEAN, where EV motorcycles are gaining broader acceptance.
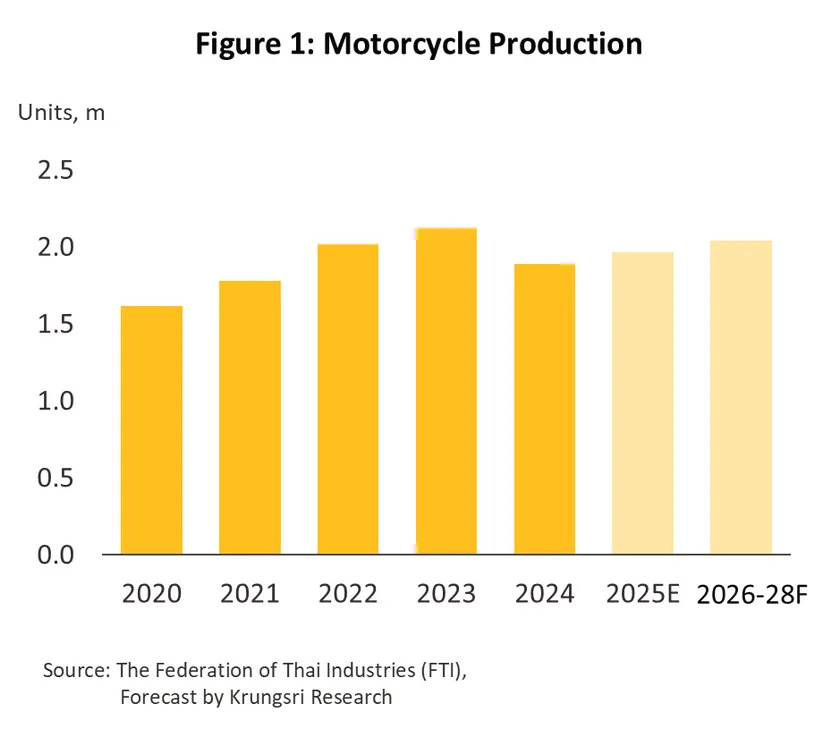
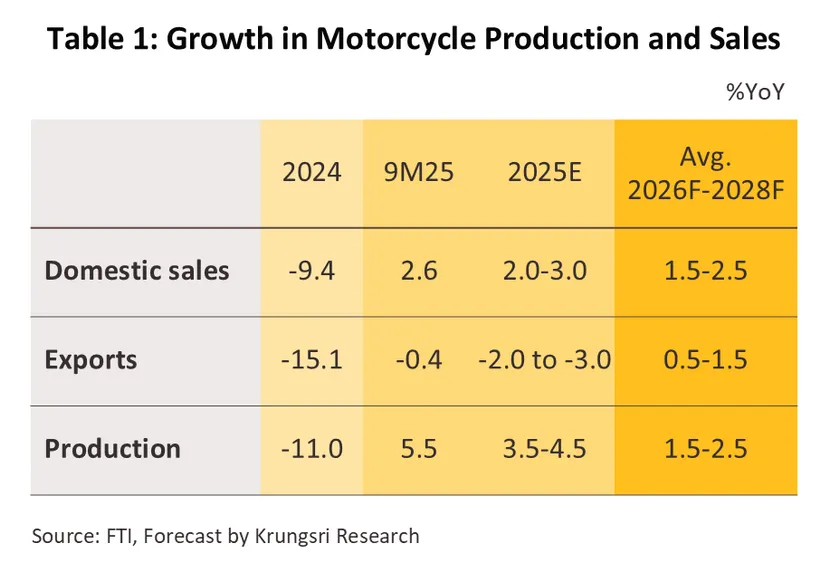
1/Cumulative registrations of electric motorcycles during 2022–2023 totaled 31,843 units, accounting for only 0.8% of all motorcycle registrations.
Auto parts
Situation in 2025
-
In the first nine months, automotive parts production declined, with the Manufacturing Production Index (MPI) contracting -1.3% YoY, despite benefits from Replacement and Equipment Market (REM) parts expanding in line with rising cumulative registrations of vehicles over five years old, 4.2% YoY for cars and 2.3% YoY for motorcycles, and the extended use of older vehicles amid weak purchasing power. The transition to EV adoption in Thailand, including domestic production under the EV 3.0 scheme and introduction of EVs for sale under the EV 3.5 scheme, as well as stricter environmental measures in trading partner countries, reduced production of parts predominantly designed for ICE vehicles. Meanwhile, export value rose 7.7% YoY, even as the global automotive parts industry faced headwinds from the U.S. sectoral tariff1/ of 25% on certain products. Thailand’s cost competitiveness allowed exports of automotive components, equipment, and tires to the U.S. during May–September 2025 (after the tariff took effect in early May) to increase 17.3% YoY, continuing the 8.2% YoY growth recorded in January–April 2025.
-
For all of 2025, these trends are expected to cause overall automotive parts production to decline -0.5% to -1.5%, while the total export value of automotive parts is projected to rise 7.5–8.5%.
2026-2028 Outlook
-
Domestic demand for automotive parts is expected to remain stable or grow slightly, driven by (i) steady vehicle production, while motorcycle output may rise marginally, with increased passenger XEV production under HEV and MHEV support policies boosting demand for common parts such as electric motors, wiring harnesses, and body components; (ii) vehicles over five years old, projected to grow 1.0–2.0% annually, supporting REM parts demand; and (iii) rising investment in engine and parts production for all vehicle types, which grew at a 131.0% CAGR during 2022–20242/. Meanwhile, export values are expected to increase 1.5–2.5% per year, in line with gradual economic recovery in trading partners during 2027–2028 and Thailand’s cost advantages, sustaining growth in automotive parts exports to the U.S., including tires, piston-type internal combustion engines and components, and general automotive parts.
-
However, Thailand’s automotive parts industry is likely to face several challenges, including the global shift to EV production, which requires fewer parts than ICE vehicles3/, risks of global supply chain disruptions stemming from China’s export controls on rare earths and critical minerals4/, and potential additional tariffs on certain parts, such as tires, if found to be improperly exported to the U.S. As a result, automotive parts production is expected to grow modestly at 1.0–2.0% per year.
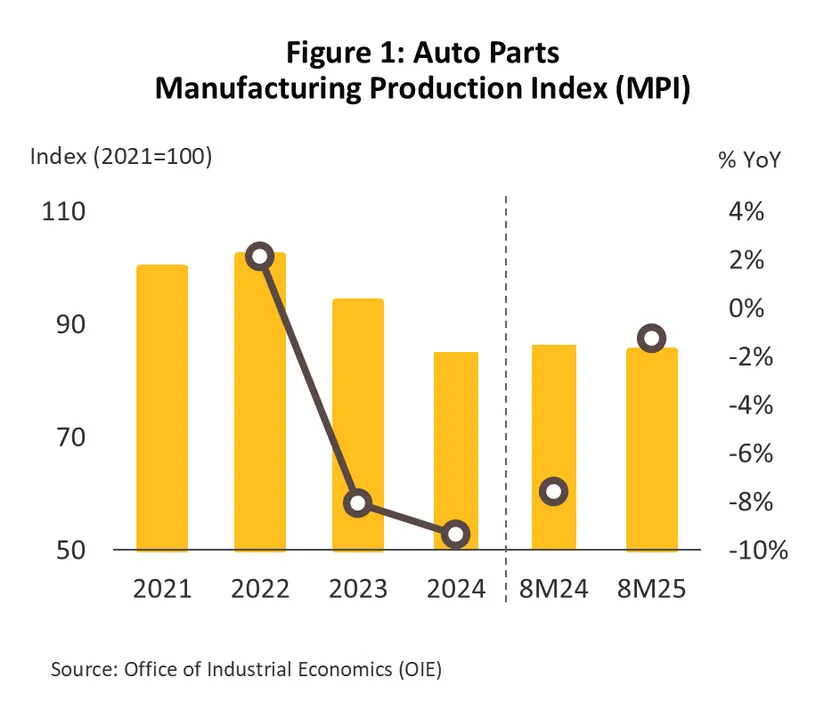
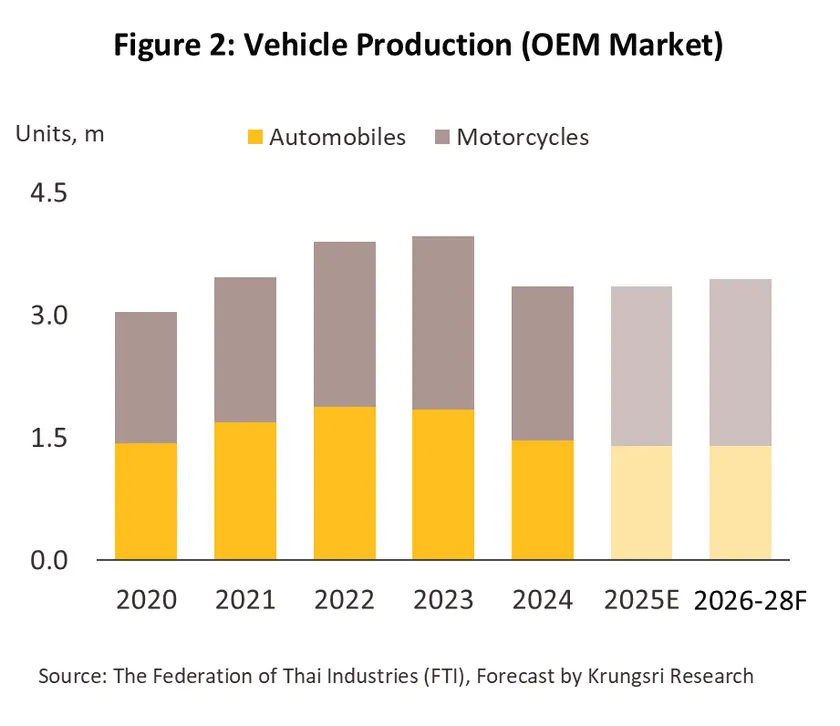
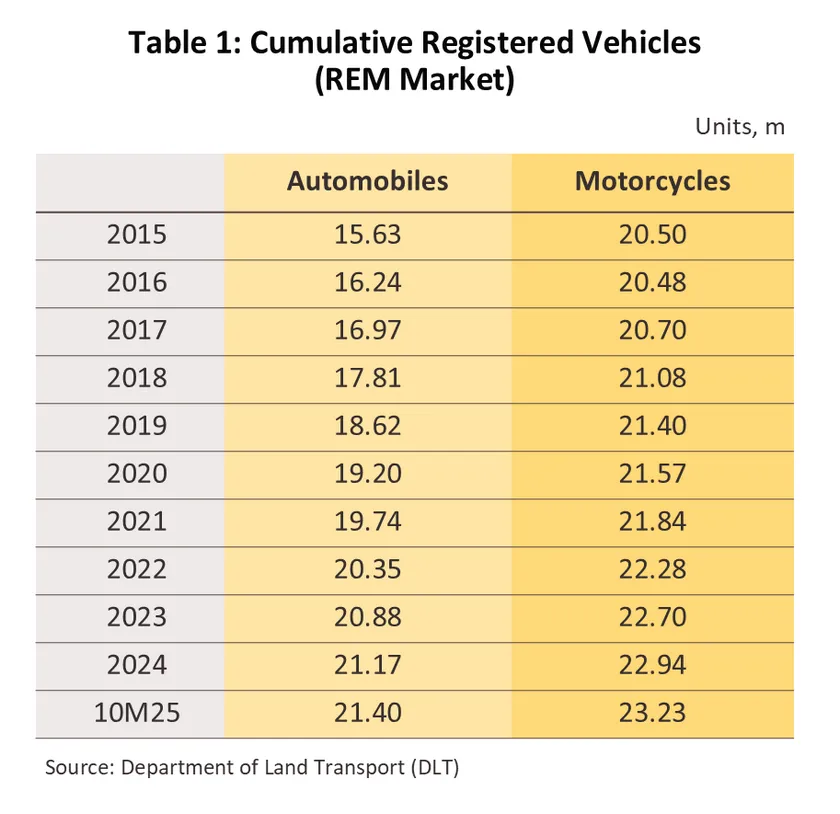
1/The U.S. is Thailand’s top export market for automotive parts. In 2024, Thailand exported automotive parts to the U.S. worth USD 5.4 billion, accounting for 24.1% of total automotive parts exports (Source: Ministry of Commerce).
2/This represents an increase from THB 16 billion in 2022 to THB 85 billion in 2024 (Source: BOI).
3/According to the IEA (2025), exports are expected to grow at an average of 15% CAGR during 2024–2030, with the share of EV sales rising from 14% of total vehicle sales in 2024 to 39% in 2030.
4/Rare-earth minerals are used in the production of automotive components, including batteries, EV drive motors, electronic systems, fuel leakage sensors, and brake sensors (Sources: Reuters, June 9, 2025; MGROnline, June 18, 2025).
ELECTRICAL APPLIANCES
Electronics
Hard Disk Drives (HDD)
Situation in 2025
-
In the first eight months, the Manufacturing Production Index (MPI) for HDDs rose 10.6% YoY, in line with a 21.8% YoY increase in export value, supported by (i) the global PC replacement cycle that began in Q4 2024, with global PC sales still rising 5.9% YoY to 192.1 million units in the first nine months of 2025, and (ii) continued growth of data center businesses abroad and in Thailand, which bolstered demand for HDDs that retain a cost-per-capacity advantage over SSDs, alongside ongoing technological developments that have increased storage capacity and improved performance1/.
-
Based on these factors, overall HDD production and export value for 2025 are expected to increase by 10.5–11.5% and 21.0–22.0%, respectively.
2026-2028 Outlook
-
Although Thailand’s HDD industry is expected to be affected by U.S. countervailing tariffs, production and exports are projected to keep growing, supported by (i) cloud and data center expansion, sustaining global storage demand; Statista (2024) projects the global storage device market to grow at 1.7% CAGR during 2024–2031; (ii) Thailand’s role as a major HDD base, with exports expected to account for 16.4% of global HDD exports, the second largest after China in 2024; and (iii) continued growth in global PC sales in 2026 as part of the post-COVID-19 replacement cycle. Given these trends, HDD production is expected to increase 6.5–7.5% per year and export value is projected to rise 7.5–8.5% per year during 2026–2028.
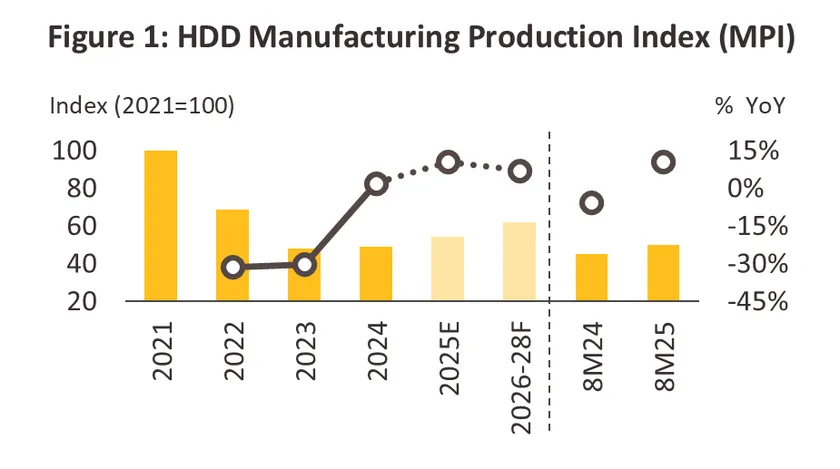
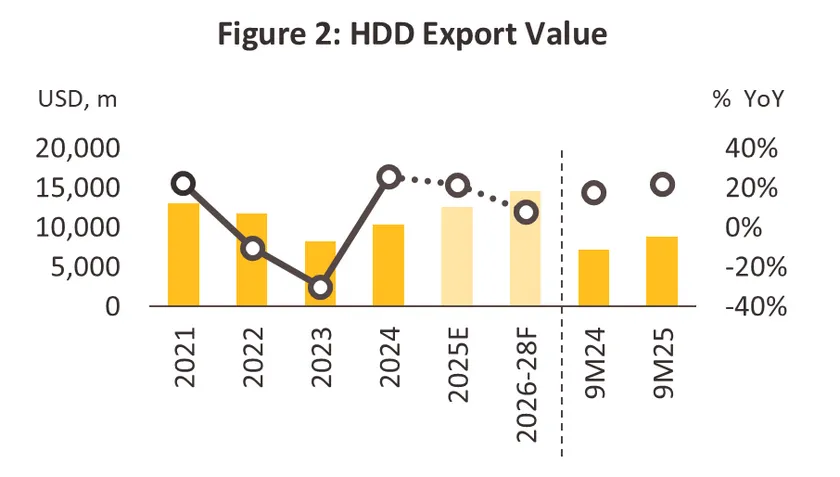
1/Source: The Standard (20 Oct 2025)
Integrated Circuits (IC)
Situation in 2025
-
In the first nine months, IC export value rose 32.9% YoY, supported by (i) a new replacement cycle for electrical appliances and electronic devices following the previous COVID-19 peak, and (ii) rising demand for chips used in global AI infrastructure and EV production, which continues to expand. However, the MPI of ICs for the first eight months fell -4.4% YoY, due to destocking from a 19.9% YoY2/ increase in inventory and higher IC imports, particularly from China, which rose 51.7% YoY.
-
These trends will result in IC export value for 2025 rising 29.5–30.5%, while IC production is projected to contract -3.5% to -4.5%.
2026-2028 Outlook
-
Thailand’s IC industry is expected to benefit from two key drivers: (i) the continued global expansion of AI3/ and data center businesses, supporting demand for processing and memory chips; and (ii) domestic investments in midstream and downstream industries using ICs as inputs, such as electronics, appliances, and EVs4/. However, IC production may face risks from supply chain disruptions due to China’s rare-earth export controls, as well as U.S. tariff hikes, which could limit growth in production and exports (Thailand’s IC exports to the U.S. accounted for 5.8% of total IC export value in 2024). As a result, the IC production index and export value are projected to grow 3.0–4.0% and 2.5–3.5% per year, respectively.
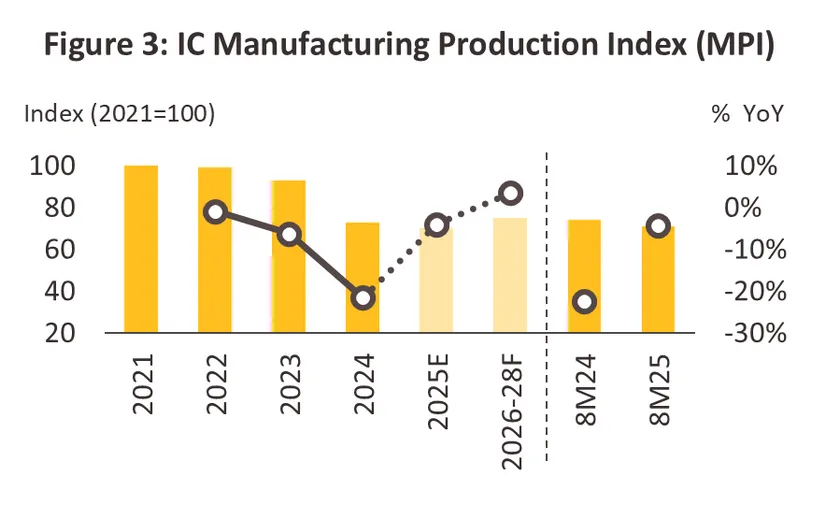
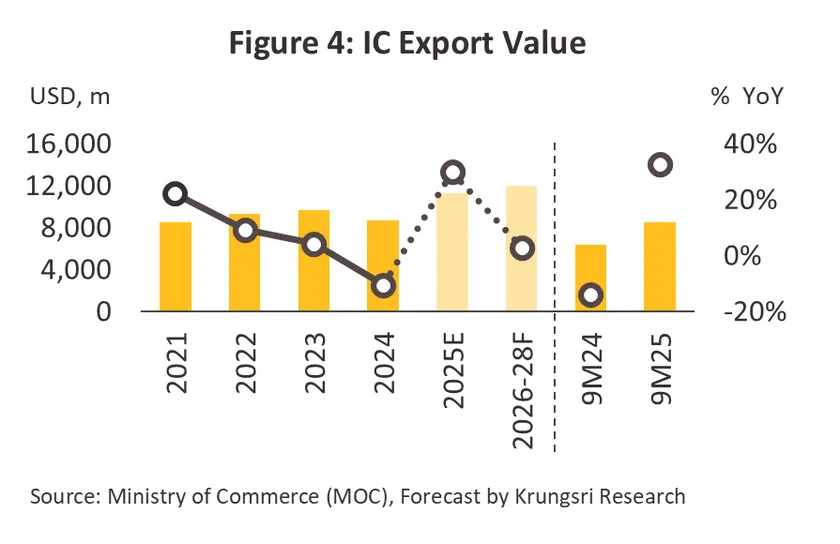
2/Output rose from 11.1 million units/month in 9M24 to 13.2 million units/month in 9M25 (Source: OIE, 2025).
3/Gartner (17 Sep 2025) expects global IT AI spending to grow at 43.1% CAGR (2024–26), reaching USD 2.0 trillion by 2026.
4/During 2023–Jun 2025, BOI approved investments worth THB 650bn in electronics & electrical appliances and THB 210bn in automotive & parts.
Electrical Appliances
Situation in 2025
-
During the first nine months, domestic sales of electrical appliances dropped -9.5% YoY, mainly due to (i) air conditioners, which hold the largest market share in the segment, plunging -27.6% YoY after peaking last year when Thailand experienced extremely hot weather, and (ii) washing machines, down -1.5% YoY, marking a continued decline since 2021 as consumers increasingly opt for laundromat services instead. In contrast, refrigerator sales rose 8.8%, supported by (i) the launch of new models at more affordable prices1/ and (ii) a post-COVID replacement cycle among some consumers. Meanwhile, the export value of electrical appliances grew 10.8% YoY, driven by the global transition into a new replacement cycle following the peak during COVID-19.
-
Domestic sales are expected to recover slightly for the remainder of the year, supported by government consumption stimulus measures such as the “Half-half Plus Copayment Program” and “Tourism Tax Incentives” programs. Meanwhile, export growth is projected to slow in the final quarter, partly due to the global economic downturn and the impact of U.S. tariff hikes. For all of 2025, domestic sales are forecast to decline -8.5% to -9.5%, while export value is expected to increase 9.5% to 10.5%.
2026-2028 Outlook
-
Domestic sales are projected to grow by 1.5–2.5% annually, primarily driven by small, multifunctional electrical appliances offered at affordable prices amid a gradually recovering economy. This segment will further benefit from increasingly aggressive marketing competition through promotional campaigns.
-
Export value is expected to rise by 2.0–3.0%, supported by global demand during the upcycle for electrical appliances and sustained investment in Thailand’s electrical and electronics industry in recent years2/. A portion of these investments comes from foreign firms seeking to use Thailand as an export base to mitigate geopolitical risks. Nevertheless, overall demand for electrical appliances is anticipated to remain subdued, particularly in 2026, due to weak purchasing power amid a slowing economy and the impact of U.S. tax measures. Notably, exports to the U.S. accounted for 25.0% of Thailand’s total electrical appliance exports in 2024.
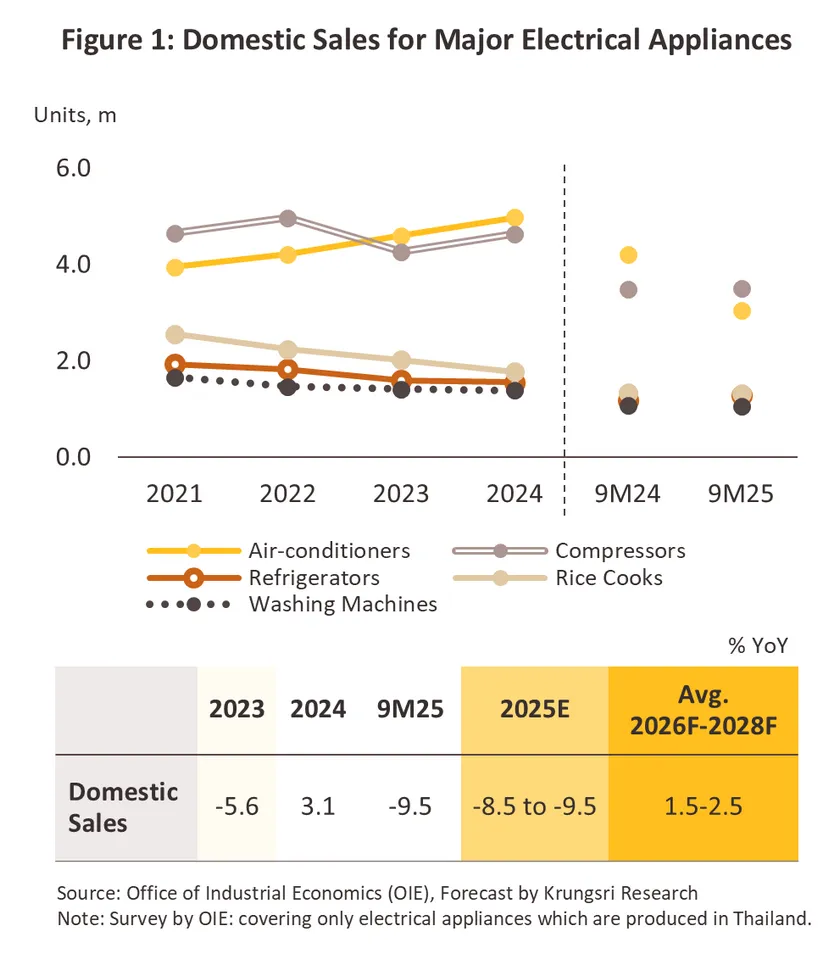
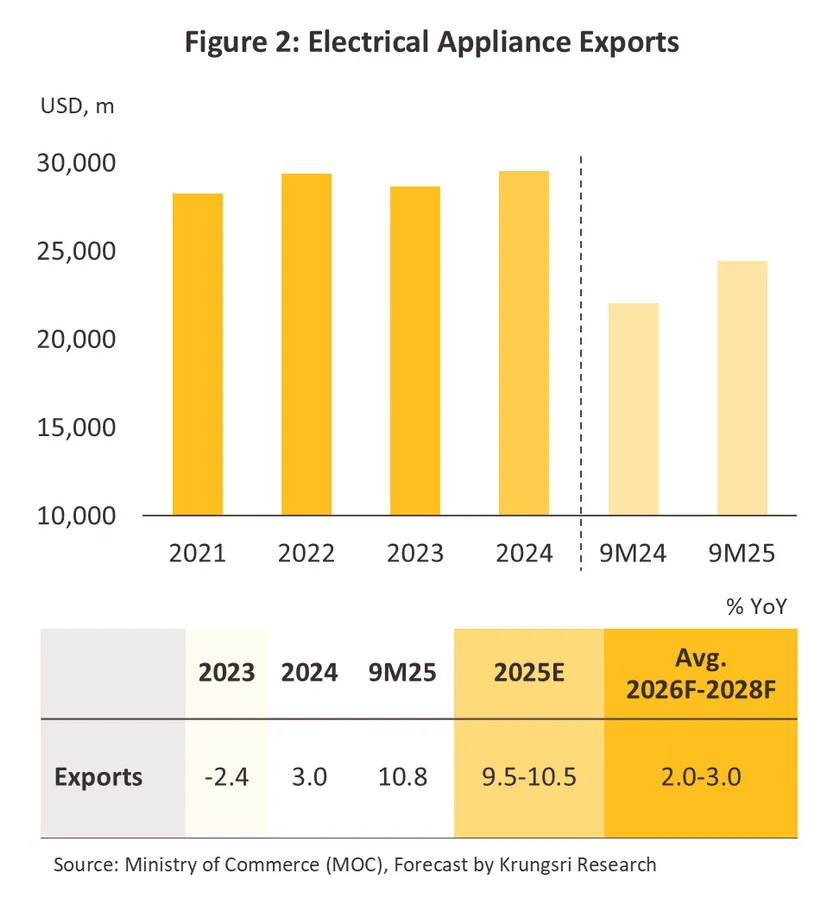
1/This was driven by fierce competition in the electrical appliance market following the recent entry of Japanese, Korean, Chinese, and Thai manufacturers (Source: Prachachat Turakij, September 22, 2025).
2/Between 2023 and June 2025, total investment in the electrical appliance and electronics industry reached THB 650 billion, accounting for 24.6% of BOI’s total investment promotion value across all industries (Source: BOI, 2025).
OTHER INDUSTRIES
Medical Devices
Situation in 2025
-
Infections with notifiable diseases increased by 48.0% YoY in 1H25, which helped boost demand for personal protective equipment and test kits over 8M25. Strong growth was recorded in sales of surgical gloves (+13.6% YoY) and consumables (+79.7% YoY). Later in the year, the extension of the rainy season will sustain higher rates of infection with respiratory illnesses and of diseases spread by mosquitos, while the onset of the end-of-year tourism high season will also add to demand from overseas patients. However, low rates of economic growth are depressing domestic purchasing power so for the year, sales will grow by just 2.5-3.5%. Export value is also expected to contract by between -1.5% and -2.5%.
-
Output of medical devices remained flat over 8M25 compared with a year earlier. Although production of syringes and consumables climbed by respectively 10.1% and 4.7% YoY, an earlier surge in surgical glove production meant that overall output contracted by -12.8% YoY during the period. Nevertheless, capacity utilization rose slightly from 55.7% in 8M24 to 58.9%.
-
Export value slipped -3.7% YoY over 9M25. Sales of single-use devices (86.0% of total medical device exports by value) and reagents & test kits (2.2%) dropped by respectively -4.5% and -5.7% YoY, while sales of durables (11.8% of exports) rose 2.6% YoY. Exports to Japan and China were down by -7.2% and -35.0% YoY, though under pressure from the enforcement of new tariffs in August, US importers frontloaded orders and so sales to the US climbed 5.7% YoY.
-
By value, 9M25 imports were down -2.3% YoY, falling -2.4% YoY for single-use devices (44.8% of total medical device imports) and -10.1% YoY for reagents & test kits (17.0% of imports) but rising 1.9% YoY for durables (38.1% of the total). Product groups that reported declines included in vitro diagnostic tools (-10.1% YoY) and ophthalmological equipment (-3.3% YoY). Imports fell -1.6% YoY from China, -10.2% YoY from the US, and -12.3% YoY from Germany.
2026-2028 Outlook
-
The market will continue to grow and sales into domestic and export markets are forecast to expand by respectively 2.5-3.5% and 2.0-3.0% annually. This forecast will be supported by: (i) the ongoing aging of Thai society and the expanding number of individuals with non-communicable diseases; (ii) growing interest in personal wellness and beauty treatments, which will lift the medical tourism segment; and (iii) government support for the industry, including BOI investment support schemes (e.g., tax holidays for investors) and the designation of medical devices as one of the government’s target industries (to reduce dependency on imports). Impacts from the US ‘reciprocal’ tariffs on exports of medical devices will also likely be limited, especially for latex glove manufacturers, as exports from Thailand’s main competitor, Malaysia, will be subject to the same tariffs as Thai goods.
-
The industry will face obstacles in the form of limited access to capital and technology, and ongoing problems with the perception of Thai goods within the domestic market. Thai players will thus need to accelerate the development of new technologies and improve the quality of finished goods to boost domestic confidence and compete effectively in international markets
CONSTRUCTION & CONSTRUCTION MATERIALS
Construction Contractors
Situation in 2025
-
In the first nine months, overall construction investment grew by 5.4% YoY to THB 1.1 trillion. The increase was driven mainly by public construction, which rose 10.6% YoY, especially infrastructure works that jumped 13.0% YoY following faster budget disbursements for ongoing projects after several months of delays earlier in 2024. On the other hand, private construction remained in decline (-1.9% YoY), weighed down by a continued drop in residential construction (-4.3% YoY), which makes up about half of all private sector construction investment. Commercial building activity has also begun to soften slightly, while industrial factory construction remains one of the few areas that continued to grow.
-
For the rest of 2025, overall construction investment is expected to slow due to several drags: (i) political uncertainty delaying public projects, as seen in the 6.8% YoY drop in 3Q25 public construction (partly from last year’s high base of 32.5% YoY); (ii) weaker economic conditions linked to U.S. tax policies; (iii) volatile energy prices pushing up transport and material costs; (iv) labor shortages causing delays or project abandonment among smaller contractors; (v) a housing sector that has yet to recover; and (vi) flooding in the South that has halted projects in affected areas. As a result, overall construction investment in 2025 is projected to grow only 1.0–2.0%, with public construction rising 2.0–2.5% and private construction contracting by -0.5% to -2.0%.
2026-2028 Outlook
-
Overall construction investment is expected to grow by 2.5–3.0% p.a., led by public construction, which should expand by 3.5–4.0% p.a. on the back of large-scale infrastructure projects advancing under the FY2026 budget. In August 2025, the Cabinet approved THB 185.3 billion for the Ministry of Transport to fund both new and ongoing highway network projects. Private construction is projected to grow modestly at 1.5–2.0% p.a. after contracting in 2025–2026, with the recovery centered in key industrial and tourism areas. Industrial estate and warehouse development is likely to continue expanding, supported by foreign manufacturers’ relocation and Thailand’s strategic location.
-
Public construction investment is expected to grow by 3.5–4.0% p.a., supported by the ongoing push to advance major infrastructure projects under the 2023–2027 action plan. This includes the accelerated development of double-track rail projects in both Phase 1 and Phase 2, as well as new lines that will enhance connectivity with industrial estates and logistics hubs, along with continued progress on initiatives linked to the EEC.
-
Private construction investment is expected to grow by around 1.5–2.0% p.a., supported by several factors: (i) increased construction of factories and office buildings in industrial estates within the EEC, in line with improving investment sentiment; (ii) ongoing hotel development, particularly among major chains that continue to expand; (iii) a gradual recovery in residential projects after the sharp slowdown in 2024–2025; and (iv) demand for repair and restoration work on buildings affected by flooding in the South.
-
Large contractors continue to hold an advantage over SME contractors, benefiting from greater access to major project bids, stronger bargaining power with material suppliers, and wider adoption of construction technologies. Smaller and mid-sized contractors, by contrast, still rely heavily on subcontracting work from large firms, leaving their operating performance more uncertain.
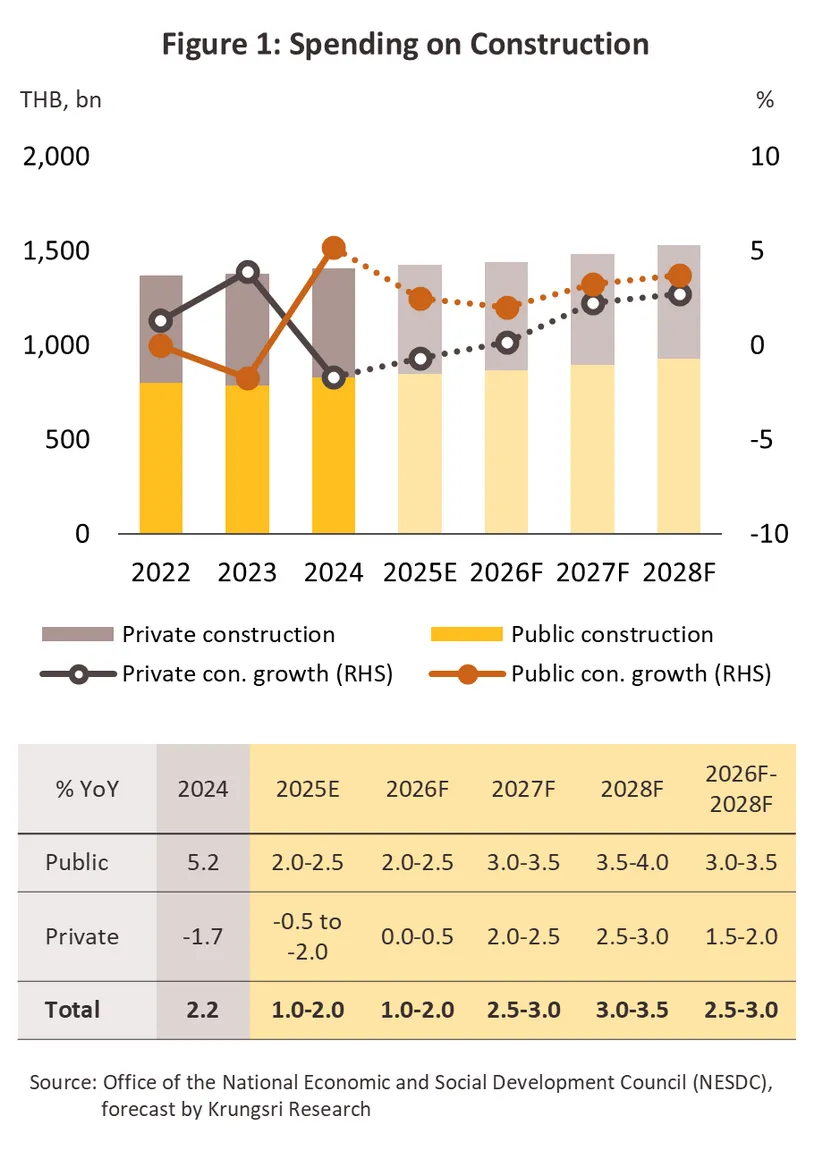
Construction Materials
Situation in 2025
-
Through 9M25, domestic production and sales of structural construction materials (cement and steel) increased in line with overall construction investment growth (+5.4% YoY), driven mainly by the 10.6% YoY expansion in public sector projects. In contrast, decorative materials production (tiles and ceramic sanitary ware) declined, reflecting the sharp slowdown in residential construction. Looking ahead to 4Q25, overall demand for construction materials is expected to soften as public construction projects slow amid political uncertainty, while new residential project launches remain weak due to high unsold inventory and a softer economic environment. Flood-related project delays in the South will also weigh on demand. As a result, structural materials are expected to continue growing for the full year 2025, whereas decorative materials are likely to remain in contraction in line with subdued residential construction activity.
-
Export volumes of construction materials contracted in 9M25 as key markets remained weak. Cement exports fell -32.0% YoY to 0.8 million tons, mainly due to a steep drop in Cambodia (-56.5% YoY), while Myanmar edged up (+2.0% YoY) as construction activity gradually recovered. In contrast, construction steel exports grew 14.8% YoY, led by a 19.8% YoY rise in rebar to 260,000 tons, supported by strong demand from Lao PDR (+71.7% YoY) and Myanmar (+11.8% YoY). Imports increased in line with overall construction activity, including rebar (+3.6% YoY), structural steel (+10.3% YoY), and ceramic sanitary ware (+6.1% YoY), mostly from China, which accounts for 90% of total imports. Tile imports, however, declined (-2.6% YoY) in line with weak residential construction. For 2025, overall imports of construction materials will continue to rise, while ceramic tile imports will remain below 2024 levels.
-
The construction materials price index rose slightly by 0.4% YoY in 10M25, supported by higher cement prices (+3.3% YoY) driven by demand from public infrastructure and utilities projects. Steel and steel products fell -2.5% YoY in line with weak global prices amid China’s subdued economic and property conditions, while tiles and sanitary ware declined -1.1% YoY and -2.5% YoY, respectively, reflecting the downturn in residential construction. For the remainder of the year, prices are expected to remain stable or edge up slightly, supported by repair and restoration work following recent floods and by persistently high energy costs amid geopolitical tensions. For full-year 2025, the construction materials price index is projected to stay broadly similar to 2024, given the continued weakness in the property market under high household debt, while global and domestic steel prices are likely to remain under pressure as China accelerates the clearance of excess supply.
2026-2028 Outlook
-
Domestic sales will tend to strengthen as a result of the following factors:
-
Public construction investment is expected to grow by 3.5–4.0% p.a., particularly in 2027–2028, driven by both new and ongoing large-scale projects that will advance the development of multimodal transport systems. Additional expansion of existing projects to support the growth of strategic regions nationwide will also play a key role, helping stimulate further investment in related industries.
-
Private construction investment is expected to grow by 1.5–2.0% p.a., supported by: (i) stronger crowding-in effects from 2027 onward as public infrastructure investment accelerates; (ii) rising factory construction in EEC industrial estates as investment sentiment improves; (iii) a gradual pickup in residential projects and hotel development by major Thai and international chains, especially in 2027–2028 as purchasing power and tourism recover; (iv) steady expansion of retail and mixed-use developments; and (v) repair and renovation demand following floods in the South.
-
Construction material export volume is expected to pick up, supported by faster infrastructure development and a strengthening property market in neighboring countries—Thailand’s key export destinations—as their economies and investment activity continue to recover.
-
Overall construction material prices are expected to remain broadly stable in 2026, supported by repair and restoration demand following widespread flooding across several regions, and may firm slightly in 2027–2028 as construction demand strengthens—particularly from large new public projects and the gradual recovery of residential development—alongside upward pressure from energy costs as global demand picks up.
-
Traders:
-
Revenues of modern construction material retailers are expected to continue rising as consumers increasingly prefer one-stop shopping formats. At the same time, operators are adjusting their strategies to stay competitive and respond to shifting demand, including: (i) downsizing store formats to expand coverage in local communities; (ii) developing new store concepts in partnership with major manufacturers to target niche customer groups; (iii) increasing the share of private-label products; (iv) accelerating the use of technology and online channels; and (v) expanding into secondary provinces and ASEAN markets to capture growing demand driven by economic development in neighboring countries.
-
Revenues of traditional construction material retailers are expected to remain subdued to broadly stable. Wholesale shops may record stable to modest growth, but competition has intensified as modern retailers expand into new areas and some manufacturers move toward direct sales to contractors. Retail outlets, which typically operate with limited capital and a narrow product assortment, still depend heavily on local markets where purchasing power is constrained, keeping their growth prospects similarly limited.
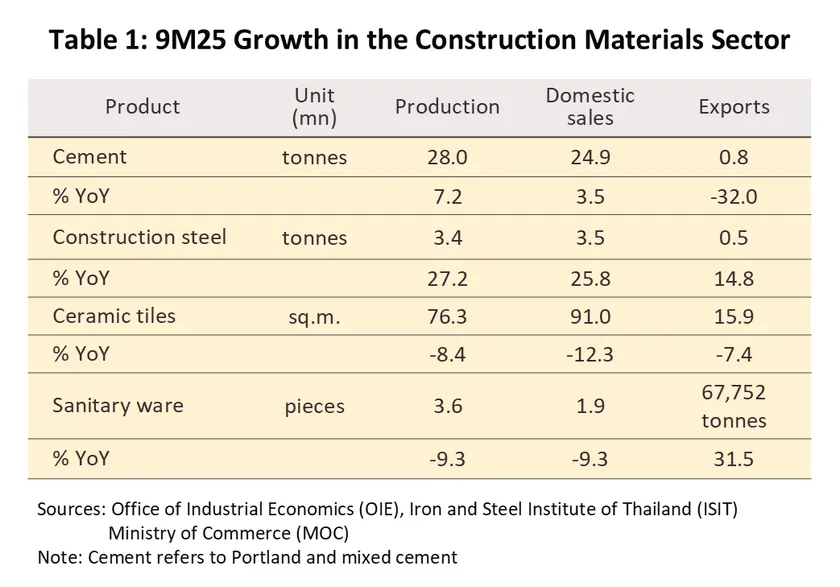
Steel
Flat Steel
Situation in 2025
-
During 9M25, domestic production and sales volume rose to 2.0 million tonnes (+16.7% YoY) and 8.3 million tonnes (+5.1% YoY), aligning with the hot-rolled coil (HRC) Manufacturing Production Index (MPI), which increased to 88.8 in the first eight months from 77.6 a year earlier. Growth was driven by (i) stronger factory and industrial-building construction following last year’s investment plans, (ii) expanding demand from the electric vehicle industry, and (iii) front-loaded export orders ahead of new U.S. tariff measures, especially in electrical appliances and packaging. For the rest of the year, U.S. tariff impacts—leading China to divert excess steel supply to other markets—together with slower domestic manufacturing and investment activity, will moderate production and sales growth. As a result, flat steel production is expected to expand 11.0–13.0%, while domestic sales are projected to grow 3.0–5.0% in 2025.
-
In the first nine months, imports totaled 6.8 million tons, up 3.3% YoY, driven by demand for factory construction in expanding industries and increased imports from China to support accelerated export orders in the manufacturing sector—particularly electrical appliances, automotive, canned food, and packaging—as reflected in an 11.4% YoY rise in HRC imports from China. Exports rose 27.7% YoY, boosted by Myanmar’s large-scale restocking after a slowdown in its domestic HRC production, with Thai HRC exports to Myanmar jumping 74.1% YoY. Exports of cold-rolled coil (CRC) to the U.S. also increased 26.7% YoY, as buyers accelerated inventory buildup ahead of upcoming tariff measures.
-
Domestic HRC prices are trending downward in line with global steel prices, reflected by a -9.4% YoY decline in China’s HRC prices over the first 10 months amid continued weakness in downstream industries and China’s property sector. For 2025, Thailand’s HRC prices are projected to fall by -6.0% to -8.0% compared with 2024.
2026-2028 Outlook
-
Production in 2026 is expected to contract by around -2.4% to -2.6%, reflecting the impact of rising import pressure and a high comparison base in 2025, before gradually returning to growth of 1.5%–2.0% per year in 2027–2028. Domestic sales volumes are expected to grow modestly at 1.0–2.0% per year in 2026, with faster growth projected in 2027–2028, in line with gradually recovering demand from downstream industries—particularly electrical appliances and automotive—as purchasing power steadily improves. Meanwhile, exports are likely to remain broadly flat, constrained by increased competition from low-priced Chinese flat steel as China accelerates efforts to offload excess supply into global markets.
-
Domestic hot-rolled coil prices are expected to continue trending downward, though a rebound may occur in 2028 in line with improving demand. The market, however, will remain under pressure from rising import inflows, while production costs are set to increase as manufacturers adjust their processes to reduce carbon emissions and shift toward greener steel products.
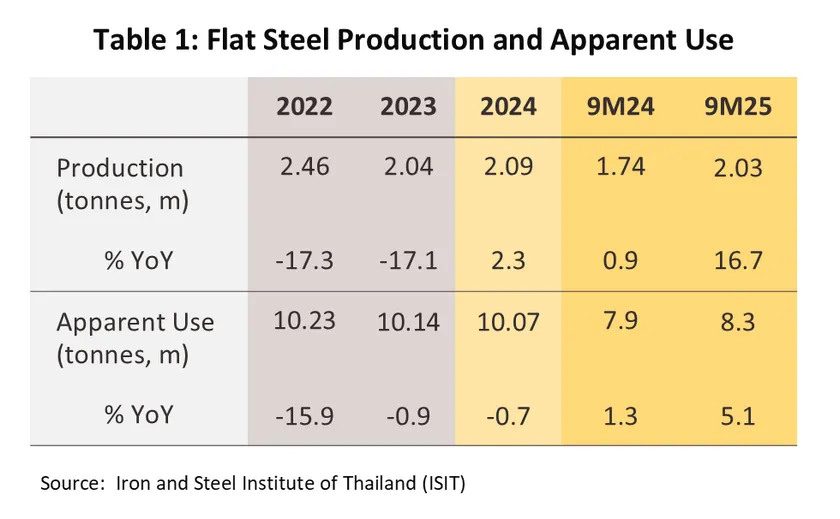
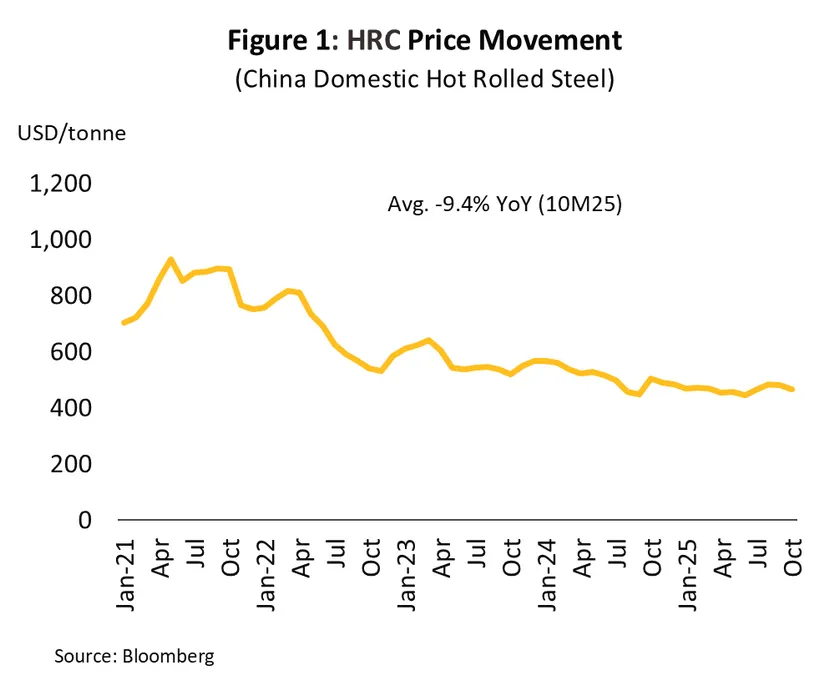
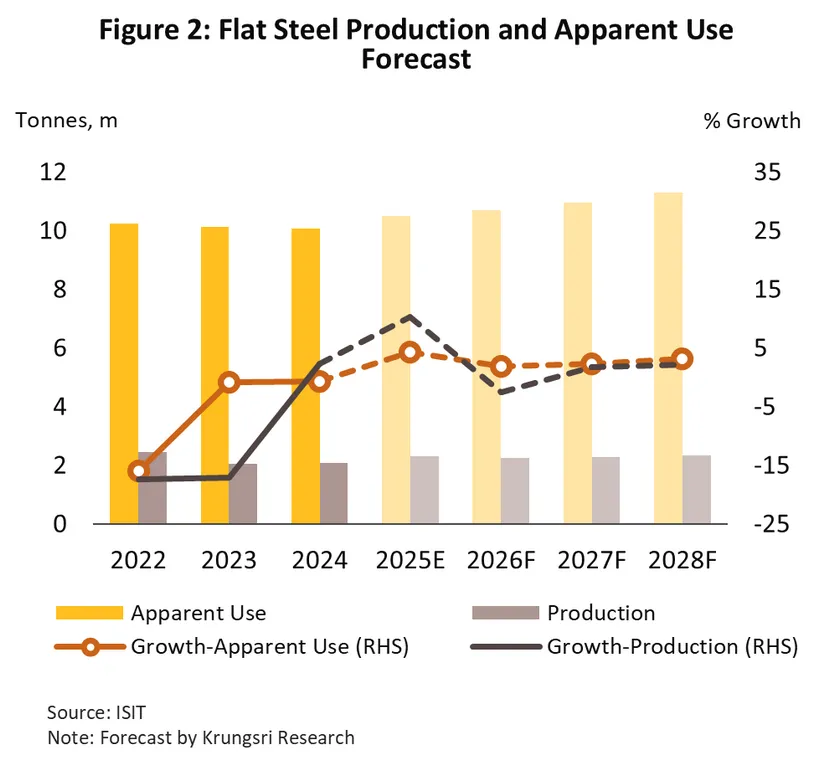
Long Steel
Situation in 2025
-
During 9M25, domestic production and sales of long steel totaled 3.8 million tonnes (+22.5% YoY) and 5.4 million tonnes (+19.4% YoY), supported mainly by stronger demand for rebar and structural steel used in public construction, where investment climbed 24.5% YoY following faster budget disbursement for major projects in the first half of 2025, including mass transit lines and other ongoing infrastructure works. That said, growth over the remainder of the year could be tempered by political uncertainty, which may slow progress on some government projects, along with softer private construction activity as the broader economy feels the impact of the U.S. tariff measures. For full-year 2025, domestic long steel production and sales are expected to rise by around 12.0–13.0% and 5.0–6.0%, respectively.
-
Long steel exports reached 730,000 tonnes, up 12.0% YoY in 9M25, supported by stronger rebar shipments to key partner countries undertaking major infrastructure rehabilitation. Exports to India rose 60.9% YoY, driven by higher budget allocations for bridge construction and transportation projects in the 2025–26 fiscal year, while shipments to the Lao PDR grew 71.7% YoY as domestic rebar production there remains insufficient to meet infrastructure demand. Laos continues to rely heavily on imports from Thailand due to lower logistics costs. On the import side, Thailand’s long steel imports increased 12.3% YoY, reflecting higher demand from public construction projects following accelerated budget disbursement. Imports of rebar and structural steel from China rose 5.7% YoY and 8.5% YoY, respectively.
-
Average domestic prices for rebar and structural steel stood at THB 19,146 per tonne, down -8.0% YoY in 10M25, moving in line with global steel prices, which remained under pressure from the broader economic slowdown—most notably the prolonged weakness in China’s property sector. This downward trend is expected to persist through the rest of the year and into 2025. For full-year 2025, prices of rebar and structural steel are projected to decline by around -6.0% to -8.0%.
2026-2028 Outlook
-
Production is projected to grow 1.5–2.0% per year (4.8–5.0 million tonnes), in line with domestic sales, which are expected to increase 2.0–2.5% per year (6.7–7.1 million tonnes). Growth will be supported by (1) ongoing large-scale infrastructure projects under the 2023–2027 plan, (2) a gradual recovery in real estate construction by 2028, and (3) continued factory development in industrial estates, especially in the EEC. Even so, intensifying competition from lower-priced Chinese imports—following U.S. tariff hikes—will remain a key constraint on both production and domestic sales.
-
Domestic rebar and structural steel prices are expected to remain stable in 2026 and edge up in 2027–2028, supported by (i) stronger demand from public and private construction, and (ii) higher costs from carbon-reduction adjustments in production. However, prices may still face downside pressure from oversupply risks in ASEAN, as China accelerates the export of excess steel following U.S. import tariffs, while China’s property sector recovers only gradually.
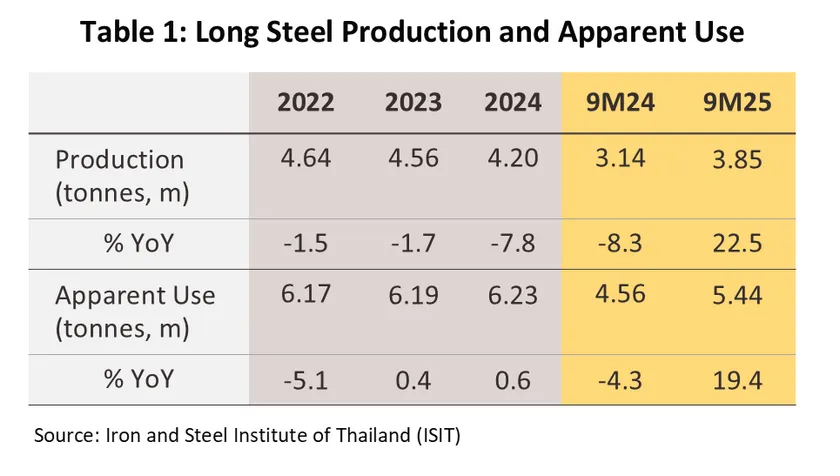
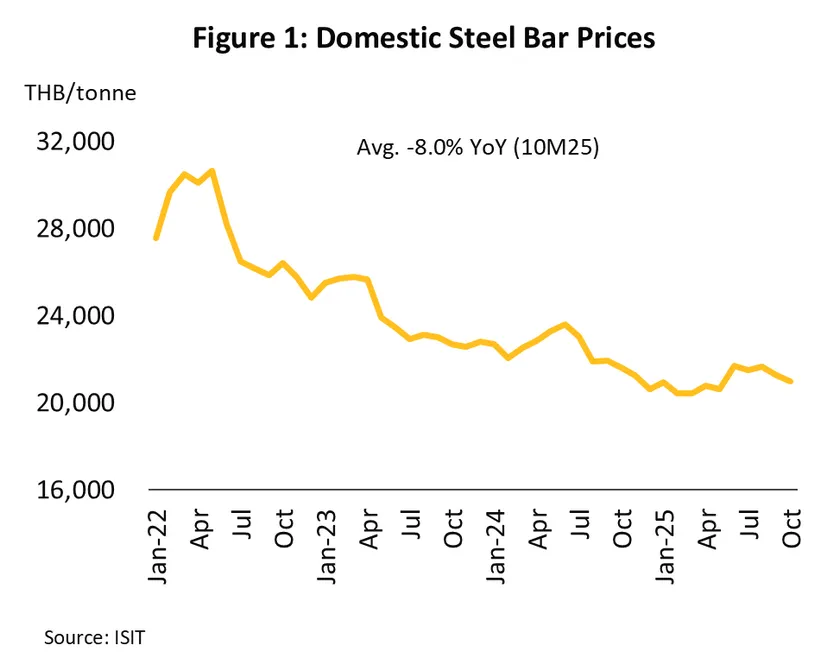
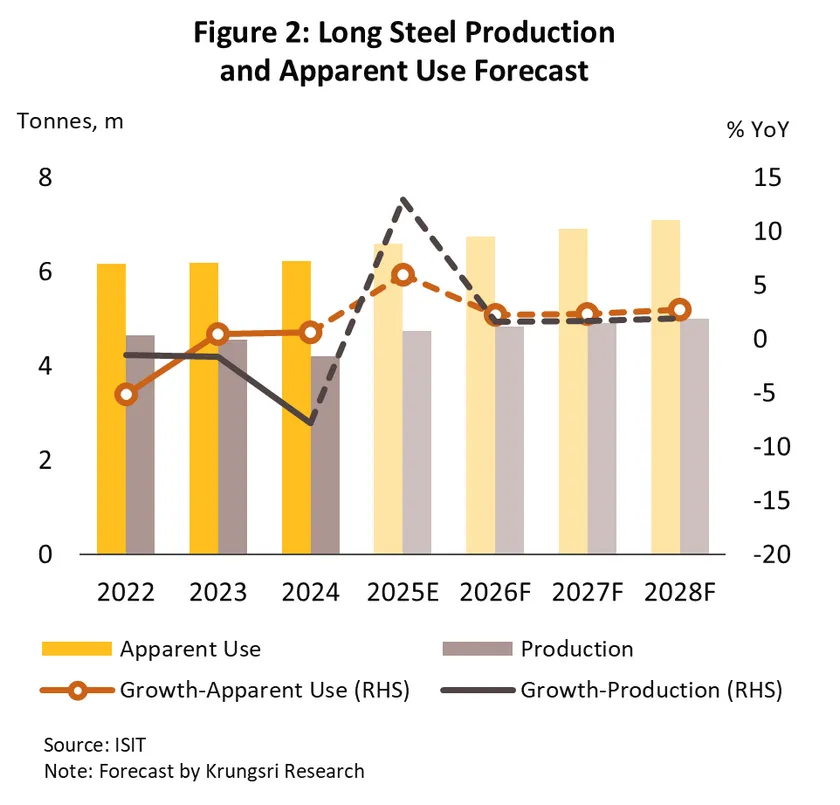
REAL ESTATE
Housing in BMR
Situation in 2025
-
In 9M25, the residential market1/ remained under pressure due to persistently weak purchasing power, reflected in a -44.1% YoY decline in sales of newly launched units, (down to 5,939 units). Total sales (new + existing units) also down -52.9% YoY to 14,182 units in 1H25. Developers slowed new project launches, causing the number of new units entering the market to fall 29.6% YoY to 26,656 units. Declines were observed across detached houses (-45.0% YoY), townhouses (-38.5% YoY) and condominiums (-13.5% YoY).
-
For the remainder of the year, the market is expected to continue slowing due to global trade tensions impacting Thailand’s economic growth and sustained high household debt levels, causing buyers—especially in the sub-THB 3 million segment—to delay decisions. Government stimulus measures are likely to provide limited support due to consumer concerns over future income. For all of 2025, residential sales are projected to decline by -30.0% compared to 2024, with new project launches expected to fall by -35.0%.
-
Overall property prices2/ continued to rise over 9M25, climbing 1.8% YoY on higher development costs that fed through into elevated prices, in particular for townhouses, which rose 4.2% YoY. Increases were most pronounced at the upper end of the market, where buyers are best able to access credit, whereas significant levels of household debt worked against mid- and lower-income buyers’ ability to take out new loans. Prices for detached houses and condominiums also climbed by respectively 0.9% and 0.6% YoY. For 2025 in total, prices are expected to increase, driven by higher land and construction costs.
2026-2028 Outlook
-
In 2026, residential demand will remain constrained by Thailand’s sluggish economic outlook and unresolved household debt. Although the tourism sector will help support housing demand to some extent, it will not be enough to drive broader business expansion. Nevertheless, the mid-to-high-end residential market will remain a key focus for developers.
-
From 2027 to 2028, the residential market is expected to recover gradually, supported by: (i) an improving Thai economy, with government investments stimulating employment and income, and sustained tourism growth, boosting housing demand; (ii) urban rail network expansions enhancing suburban accessibility, particularly along transit lines; and (iii) rising demand from expatriates and long-term residents, spurring mid-to-high-end housing needs for both long-term rentals and purchases. From 2026 to 2028, new unit launches are expected to increase by 3.0–4.0% annually, averaging around 38,000 units (compared to a pre-COVID average of 110,000 units per year from 2017–2019), with total sales increasing by 1.5–2.3% per year. The outlook for the main market segments is given below.
-
Low-rise housing (detached housing and townhouses): Sales volume is expected to recover gradually, supported by real demand from potential homebuyers who are able to access mortgage financing. New developments will tend to be concentrated in outer regions, especially areas close to international schools since these are the most sought after by younger buyers and mid- to upper-level executives. Sales of townhouses are expected to remain flat due to the large supply of unsold units (especially in the THB 2-3 million segment, which accounts for 55% of all unsold townhouses). Meanwhile, low- to middle-income buyers continue to face pressure from high household debt and tighter credit conditions. Large developers will likely be able to sustain modest sales growth, but SMEs will face intensifying price competition and a greater risk of financial difficulties.
-
Condominiums: Sales will likely inch up, supported by the expansion of the metro system and the effects of this on demand from both owner-occupiers and rental investors. Demand from overseas buyers should also lift the luxury, super luxury3/ and branded residence segments in downtown and riverside locations. However, demand for condominiums in more outer areas will lose out relative to low-rise properties, while in some areas (e.g., Phetkasem, Bang Na, and Samut Prakan) sales will struggle against the backlog of unsold stock.
-
The business challenges include: (i) low growth in the economy and the heavy burden of household debt, which is restricting access to new loans; (ii) rising costs, especially for land in prime locations, and continuing labor shortages (a long-running structural problem within the industry), which will tend to generate price rises that will outpace increases in buyers’ incomes; and (iii) Thailand’s transition to a fully aged society will reduce demand for new properties, as the shrinking share of the working-age population (the main driver of the market) further weakens demand.
1/Total housing projects include detached houses, townhouse, condominium.
2/The housing price index is constructed from the prices for detached houses, townhouses and condominiums, for which data are collected from information on housing loans provided by 17 lenders active in the Bangkok Metropolitan Region.
3/Luxury condominiums are those with a price of THB 250,000-349,999/sq.m., while more expensive units are classified as super luxury.
Housing in Upcountry (6 major provinces1/)
Situation in 2025
-
Provincial residential markets remained depressed through 1H25. With the local economy still sluggish, households still struggling under high levels of debt, and foreign tourist arrivals down -4.7% YoY, overall sales dropped -37.0% YoY. New launches declined even more sharply, falling -56.4% YoY, split 72% condominiums (mostly in Chonburi and Phuket) and 28% detached houses and townhouses. Over 8M25, total housing transfers fell across almost all provinces, except Phuket and Rayong where both unit numbers and transaction values increased, supported by foreign buyers seeking holiday homes and rental investment properties.
-
Weak conditions will extend through 2H25. With the domestic economy continuing to underperform, residential demand is expected to weaken, especially in industrial hubs (e.g., Rayong). This may be partially offset by the start of the tourism high season, which could boost demand, especially in Phuket. For all of 2025, the number of new units coming to market will be down by -45.0% to -50.0% YoY, sales will drop by -25.0% to -30.0% YoY, and transfers of ownership will decline by -10%.
2026-2028 Outlook
-
Sales of residential properties are forecast to grow by 2.0-2.5% per year supported by: (i) ongoing government infrastructure investments such as the motorway network, the twin-track railway, and the high-speed rail linking three airports, which will improve accessibility and facilitate new development in these areas; (ii) growth in tourism that will lift incomes and boost regional economies, and add to demand for second homes and rental properties, especially from upper-income and overseas buyers; and (iii) less intense competition than in BMR and its suburbs, helping to keep price rises limited.
-
Developers will gradually increase the number of new projects that they bring to market.
-
Low-rise housing: New unit launches are expected to expand by 2.2–2.8% per year, driven by demand from owner-occupiers in the middle- to upper-income segments. However, with major developers that typically operate in Bangkok and the central part of the country increasingly active in the provinces, competition will tend to intensify, and this will put pressure on profits for local/SME developers.
-
Condominiums: New condominium launches are expected to rise by 3.9–4.5% per year, concentrated mainly in Phuket and Chonburi, which remain popular among foreign buyers seeking investment properties and second homes. This will tend to encourage developers (both local and major developers from Bangkok) to accelerate new project development, particularly to capture demand from affluent Russian and European buyers.
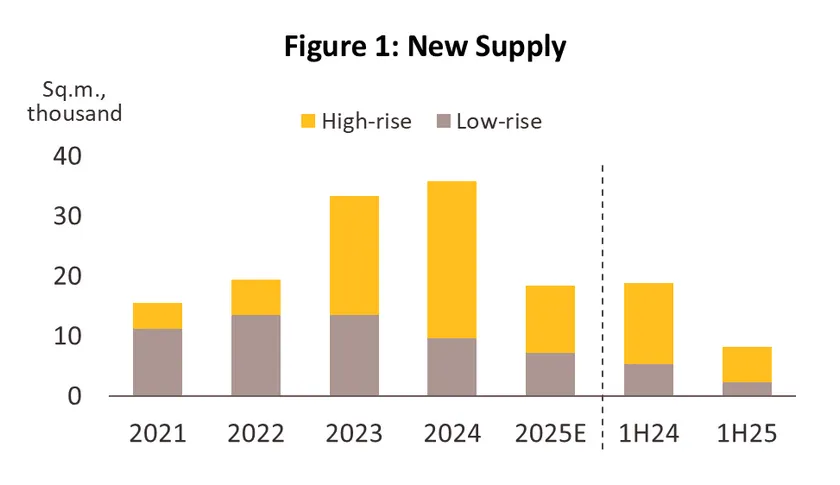
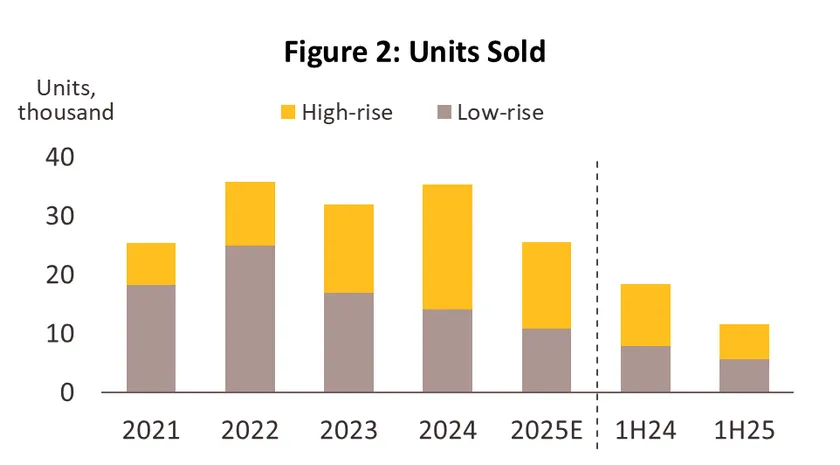
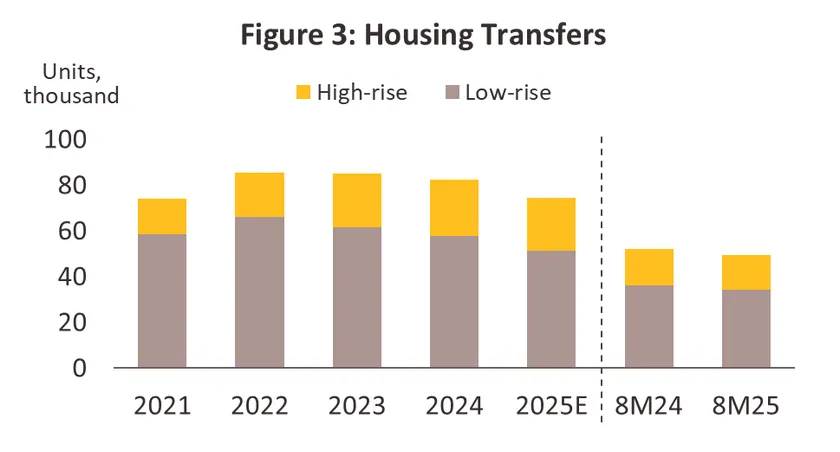
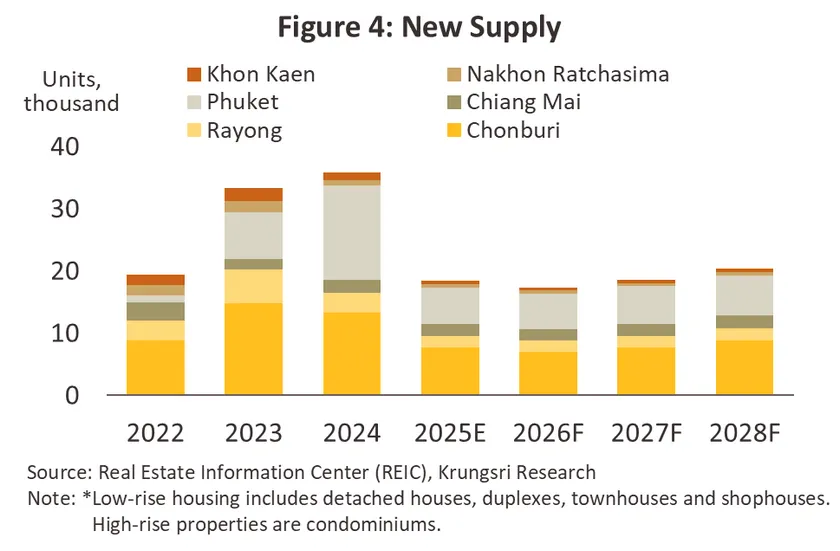
1/The 6 provinces are Chiang Mai, Chonburi, Khon Kaen, Nakhon Ratchasima, Phuket, and Rayong.
Commercial Buildings in BMR
Office Buildings
Situation in 2025
-
In 1H25, demand for office space rental showed signs of recovery, as employees returned to on-site work. New supply totaling 330,000 square meters (+47.0% YoY). This increased the cumulative office supply to 10.2 million square meters (+4.3% YoY), with Grade B offices comprising 72%, while Grade A and A+ accounted for 18% and 10%, respectively. Net take-up rose by 80,300 square meters, resulting in total occupied space of 8.0 million square meters (+1.3% YoY), which pushed the occupancy rate down to 79.3% from 81.6% in the same period in 2024.
-
In the second half of 2025, new supply is expected to continue entering the market in line with developers’ investment plans, particularly for Grade A and above offices. Meanwhile, demand is projected to grow gradually, driven by Thai and foreign companies, especially in the electric vehicle (EV), digital, and advanced medical industries, which are expanding in Thailand and seeking Grade A+ office space in CBD areas, particularly ESG-compliant Green Offices. For the full year of 2025, new office supply is forecasted to increase by 4.8% from 2024, while rental demand is expected to grow by only 1.2%, leading to a decline in the occupancy rate to 78.5% compared to 81.3% in 2024.
2026-2028 Outlook
-
Demand for office space will rise by 0.5-1.5% per year, (down from the 2.5% averaged over 2015-2019). driven by service-sector businesses benefiting from tourism growth, as well as technology, finance, and digital firms seeking modern offices in city centers. Foreign investors and expanding luxury retail brands will also support demand. However, slow export recovery, fragile domestic purchasing power due to household debt, and global economic uncertainty may limit consumption and moderate office demand.
-
New supply will expand at an average annual rate of 1.0-2.5%, or by around 200,000 sq.m., primarily from large-scale mixed-use projects launched in phases. The occupancy rate should thus average 79.0%, close to its 2025 level, so rents will remain flat or rise only slightly. This is with the exception of Grade A and A+ offices in CBDs, highly sought after by businesses, may see sustained rent increases, while older and non-CBD buildings could face downward pressure to maintain long-term occupancy.
-
Income is expected to grow in line with the location of office spaces, as follows.
-
Office space in the CBD: Income will continue to increase, especially for new Grade A and A+ buildings that feature modern designs, advanced technology, and effective management systems, allowing developers to raise rents in line with market demand. However, the large volume of available supply will limit increases in rents, though rents will remain higher than in other areas.
-
Office space outside the CBD and in areas around Bangkok: Incomes will remain flat or possibly decline for older and Grade B buildings that are occupied by SMEs. These properties are more sensitive to economic conditions, making it difficult to raise rents; in some locations, it may even be necessary to reduce them to retain occupants.
1/The net take-up represents the difference between new occupied space and rented space that the tenants terminated in that year (square meters).
Retail Space1/
Situation in 2025
-
1H25 demand for rented retail space inched up by just 0.9% YoY to a total of 6.6 million sq.m. as weak domestic spending power and an uncertain economic environment pushed consumers to exercise greater care over discretionary spending. This was balanced by growth in the tourism sector and government stimulus packages that included the ‘Easy E-Receipt’ and the 2025 ‘We Travel Together’ programs, which boosted spending on goods and services and added to demand for retail space. Meanwhile, the phased release of units in mixed-use developments lifted supply by 3.2% YoY to 7.1 million sq.m., though this also contributed to a decline in the occupancy rate to 93.1%.
-
Through 2H25, retail space operators will benefit from the ‘Half-Half Plus’ co-payment program, which boosts consumer spending power, further supported by the onset of the tourism high season and the end-of-year celebrations. Demand in 2025 is thus forecast to expand by 1.8% YoY to 6.8 million sq.m. Meanwhile, new retail supply is expected to increase by 0.2 million sq.m., bringing total supply in 2025 to 7.3 million sq.m., up 2.8% YoY. The occupancy rate will thus edge down to 93.7%.
2026-2028 Outlook
-
Demand for rented retail space should expand by 1.5-2.5% annually, (down from the 2017-2019 average of 3.7%). Growth will be supported by the rebound in tourism, with foreign arrivals forecast to reach 39 million by 2028. In addition, the expansion of the transport network will make travel more convenient and support the development of new communities in the outer BMR. Rising consumption in these areas will in turn encourage the spread of shopping centers and community malls.
-
The supply of retail space will expand by 1.7-2.7% per year, or by 0.5 million sq.m., as companies renovate and expand sites that benefit from heavy footfall and supply from large mixed-use projects comes to market (e.g., Central Northville, One Bangkok (Phase II), and The Forestias, which should be completed in 2026). This will pull the occupancy rate down to 92.3% and keep rents flat, or possibly even weaken these, except in downtown locations, where rents may rise.
-
Enclosed malls: Income will continue to strengthen with the recovery of the Thai economy and the expansion of foreign brands seeking downtown retail space to attract high-spending consumers. New large shopping centers will be opened in suburban areas such as Rangsit and Bang Na, and so rents will trend upwards.
-
Community malls: Income will likely remain flat due to the continued rise in supply, especially in suburban areas such as Bang Na, Ramkhamhaeng and Lat Krabang, where new residential and urban community projects are being developed. However, slow growth in domestic spending power mean that demand will lag behind supply, and this will limit rent hikes.
-
Supporting retail: Income will stay broadly unchanged. Supply will tend to expand, especially in downtown mixed-use developments, but demand growth will be restricted to modern, well designed, and easily accessible sites. Rents are therefore expected to remain flat or rise slightly.
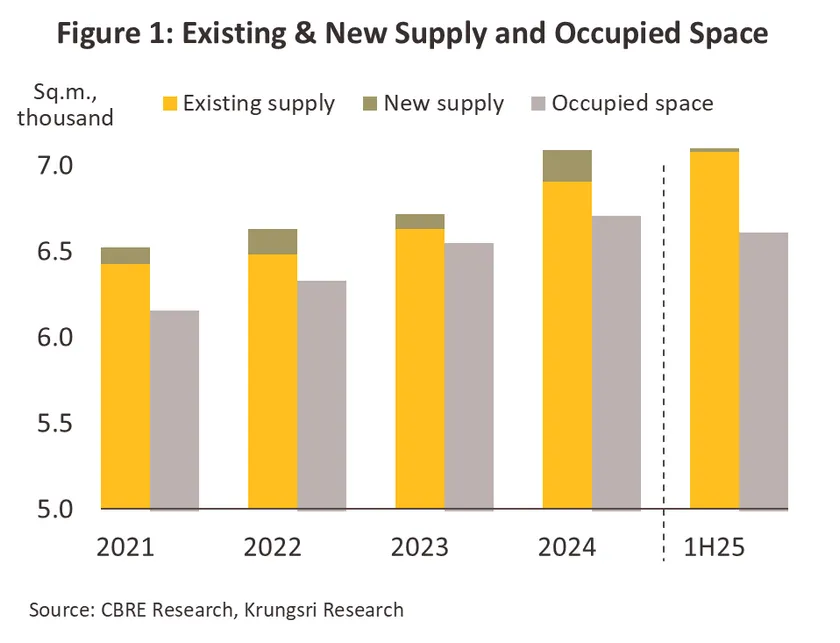
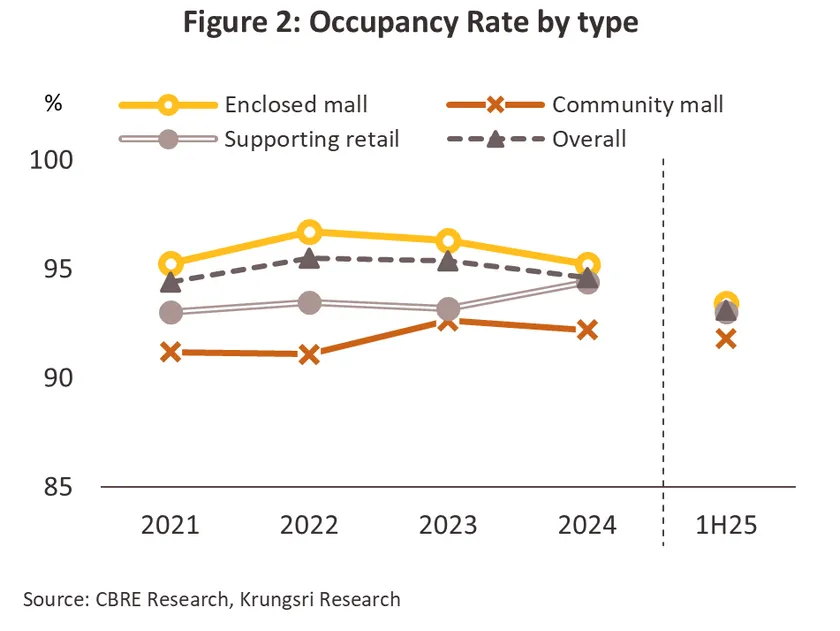
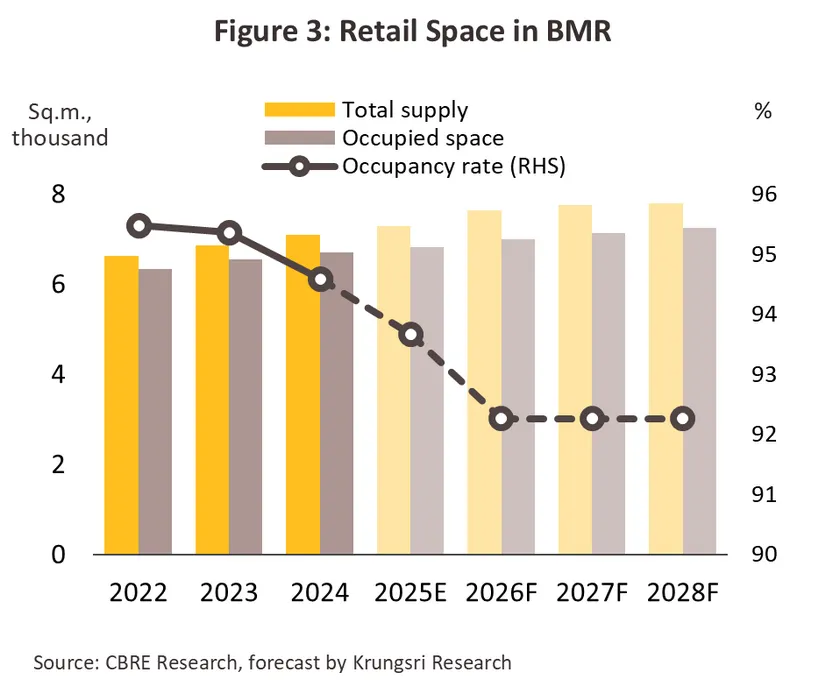
1/Retail space includes enclosed malls, community malls, and supporting retail.
Industrial Estate
Situation in 2025
-
In 9M25, land sales and leases totaled 4,067 rai, down -33.0% YoY, partly due to economic uncertainty and U.S. import tariffs weighing on investment sentiment, as well as a high base last year. The Eastern region accounted for the majority at 3,908 rai (96% of nationwide industrial estate sales/leases), down -28.7% YoY, followed by the Central region (incl. Bangkok and vicinity) at 159 rai (-70.1% YoY). Meanwhile, BOI-approved investment value and promotion certificates in the Eastern region grew 60.3% YoY and 57.2% YoY, respectively.
-
On the supply side, 8 new industrial estates were established (6 in the Eastern region, 1 in the Central region, and 1 in the Northern region), adding 10,941 rai. This brings the nationwide total to 79 industrial estates with 186,000 rai, representing an occupancy rate of 79.0%. The Eastern region accounts for the largest share at 80% of total industrial estate area (145,000 rai).
-
For the remainder of the year, industrial estate land sales and leases are expected to continue to decline due to the impact of U.S. import tariffs on economic activity and investment. Consequently, full-year 2025 sales and leases are projected at around 6,200 rai, down 22.2% (from 7,966 rai in 2024).
2026-2028 Outlook
Industrial land sales and leases are expected to grow by 3.0–4.0% p.a., or around 7,500–7,600 rai annually, supported by (i) continued geopolitical tensions that encourage relocation to ASEAN and Thailand, (ii) progress in infrastructure projects that strengthen strategic advantages—especially in the EEC with its deep-sea ports and utility networks, and (iii) the development of Smart Parks that combine integrated technology services with environmental standards. Early signals are positive, with BOI applications in the EEC rising 67.5% YoY in number and 69.2% YoY in value in 1H25.On the supply side, constraints include (i) political and economic uncertainty that may affect continuity of related public and private projects, (ii) zoning limitations that restrict suitable land for large investors, (iii) rising land prices that increase investment costs, and (iv) stronger competition from Vietnam, Indonesia, and Malaysia, all of which are accelerating incentives to attract foreign investors.
-
Eastern region: Demand for industrial land and rental space is expected to grow steadily, supported by Thailand’s strategic location and investment-promotion policies in the EEC. However, the expansion of new industrial estates will likely remain limited as land prices continue to rise amid tight land supply.
-
Central region: Demand for land purchases and leases should keep growing thanks to strong transport connectivity, supporting revenue from utilities and rentals. However, industrial estates in this region remain exposed to severe flood risks, as seen in 2011.
-
Other regions: Demand for land purchases and leases remains low, as the area still depends on further development of transport links to major economic zones.
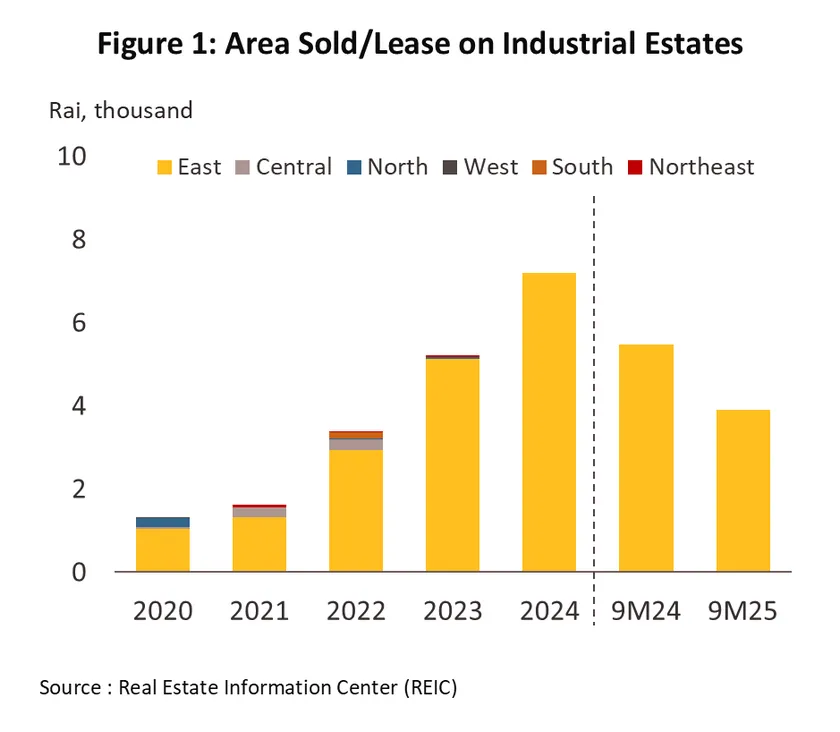
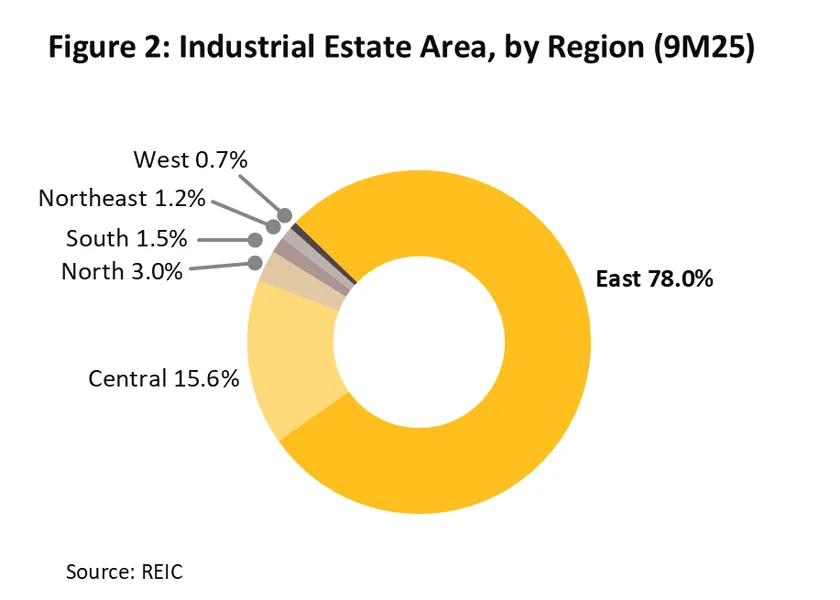
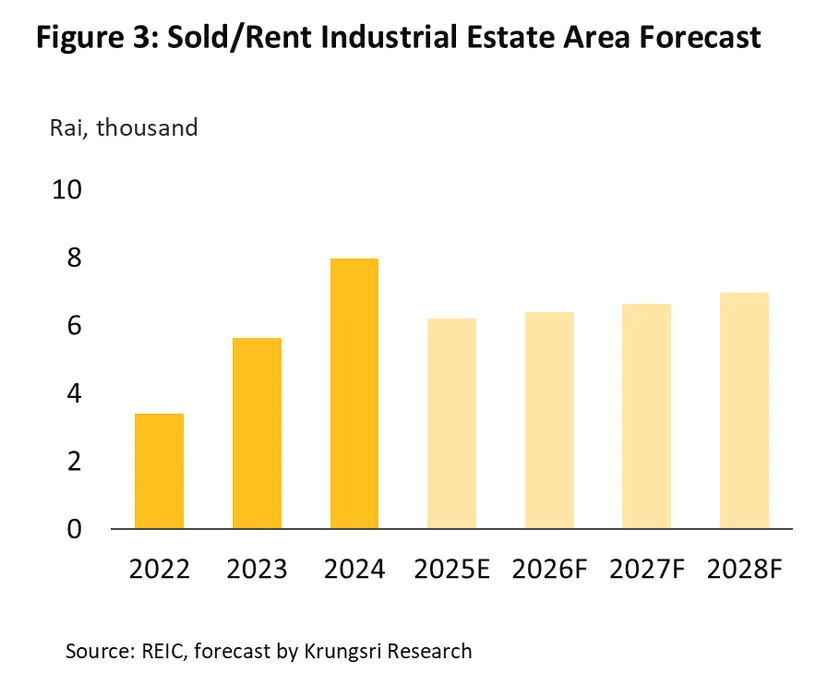
HOSPITALITY
Hotels
Situation in 2025
-
In 2025, foreign tourist arrivals totaled 32.97 million, down -7.2%, due to contractions in major source markets—particularly China, which accounted for 13.6% of total foreign arrivals and declined -33.6% YoY amid recurring safety concerns in Thailand. During the first nine months of the year, Chinese tourists increasingly diverted to Vietnam and Japan, where arrivals rose 43.9% YoY and 42.7%, respectively. Malaysian arrivals (13.7% share) decreased -8.7% in 2025, reflecting economic uncertainty, higher outbound travel costs, and late-year flooding in southern Thailand—especially Hat Yai and Surat Thani, key destinations for Malaysian tourists. In contrast, arrivals from India (7.5% share) increased 12.1%, alongside growth in long-haul markets such as Russian tourists (5.8% share) grew 8.8%, supported by expanded flight capacity. Domestic tourism reached 202.4 million trips in 2025, up 2.7%, partly supported by government stimulus measures, including the ‘We Travel Together’ scheme (4 Jul–31 Oct 2025) and tax deductions under the ‘Tourism Tax Incentives’ scheme (29 Oct–15 Dec 2025).
-
During 11M25, the nationwide average occupancy rate remained stable at 71.0%, while room rates declined -3.4% YoY. As a result, revenue per available room (RevPAR) fell to THB 1,292 (-3.2% YoY). For full-year 2025, the occupancy rate is expected to be 71.5%, unchanged from 2024.
-
The total hotel building construction permits grew 20.2% YoY to 0.86 million sq.m. over 8M25. Bangkok accounted for 30% of total permitted hotel area and saw a sharp increase of 95.6% YoY, while Phuket—representing 33%—grew 45.2% YoY. The surge in both locations underscores developers’ confidence in major tourism hubs which continue to demonstrate strong potential.
2026-2028 Outlook
-
International arrivals are expected to recover gradually, driven mainly by travelers from India and Europe and supported by more direct flights, though overall growth will remain limited by (i) a global economic slowdown and the impact of U.S. tariff increases, which could weigh on travel spending—especially in 2026, (ii) domestic concerns over safety and Thai–Cambodian border tensions, (iii) a weakening value-for-money perception amid high living costs, and (iv) stronger competition from Asian destinations such as Vietnam. As a result, international arrivals are projected at 35.5 million in 2026, 37.5 million in 2027, and 39.0 million in 2028, while domestic trips are expected to average 215–220 million p.a., keeping nationwide occupancy at roughly 72–73%.
-
Hotels in major tourist destinations (Bangkok, Pattaya, and Phuket): Revenue is expected to grow strongly as average occupancy approaches 75% annually, supported by a steady increase in international arrivals.
-
Hotels in tourist destinations and regional centers: Revenue is expected to improve gradually in line with the recovery of the domestic tourism market, particularly the rebound in the meetings and events (MICE) segment.
-
Hotels in other provinces: Revenue is expected to remain stable, with average occupancy rising on the back of continued government support for secondary cities, though still below levels in major tourist destinations.
Private Hospitals
Situation in 2025
-
Income growth was sustained through 9M25 thanks to: (i) rising numbers of individuals with infectious or seasonal illnesses that included influenza (+39.6% YoY) and pneumonia (+17.9% YoY); (ii) continuing demand from non-Thai patients; and (iii) ongoing investment in service provision, the construction of new hospitals, and acquisitions and partnerships (to support referrals and resource-sharing). However, headwinds included sluggishness in the domestic economy that encouraged some individuals to access medical services via government hospitals or cheaper private clinics, and a drop off in some overseas markets (especially for patients from China and Cambodia) that affected income for players most active in these segments.
-
For the rest of 2025, revenues will be supported by the resilience of spending power among upper-middle-income and wealthier patients, as well as by the onset of the cold season and an uptick in seasonal illness, especially influenza. The government’s new “Healthy body, happy wallet” scheme (in effect since 28 October) is also unlikely to significantly impact earnings since this targets cheaper general medicines, not high-value specialist treatments, and so for the year, income should be up by 6.0-7.0%, down slightly from 2024’s 8.0-9.0%.
2026-2028 Outlook
Going forward, turnover is forecast to rise by 5.0-7.0% annually, restrained somewhat by slower growth in the economy and the effect of high rates of household indebtedness on overall consumption. Nevertheless, growth will be supported by the following.
-
The share of the elderly in the population (i.e., those aged over 60) will rise from 2026’s 22.4% to 30% by 2040 (source: NESDC), adding to spending on chronic and complex conditions.
-
Rates of non-communicable diseases and seasonal illnesses will rise, as will the number of foreign patients and medical travelers seeking treatment in Thai hospitals. The latter will be helped by continuing growth in tourism and the playing out of global megatrends relating to health and wellness.
-
An expansion in the services offered to self-insured patients will allow private-sector providers to raise their charges (e.g., social security payments for dentures and the treatment of wisdom teeth have been expanded, and from 2026, the new formula for calculating payments will increase these).
-
Operators will likely grow their market by expanding their branch size, their geographical coverage, and the range and complexity of the conditions that they treat.
-
Major providers: These will benefit from economies of scale, while they will also be able to grow their customer base by opening new branches and extending treatment to cover more complex conditions.
-
Small and mid-sized operations: Serving social security patients will help to reduce income volatility, but for hospitals that are not part of wider commercial groups, stiff competition will drag on opportunities for growth.
RETAIL TRADE
Modern Trade
Situation in 2025
-
Spending in modern trade outlets came under pressure through 9M25 from high levels of household debt that dragged on purchasing power, as well as from weakness in the tourism sector, where arrivals fell -7.6% YoY through the period, though declines were especially sharp (-35.0% YoY) among relatively heavier- spending Chinese visitors. Worries over the state of the economy and fears around competition with online sellers (who can offer a wider range of choices) have thus kept the Retailer Sentiment Index below 50 points since January. Nevertheless, government stimulus packages, including the ‘Half-half Plus Copayment Program’ (29 October-31 December) and ‘Tourism Tax Incentives’ (29 October-15 December), should help lift retailers’ income, and so for the year overall, revenue in the modern trade industry should rise 2.0-3.0%.
2026-2028 Outlook
-
2026 retail sales will remain flat or possibly contract slightly due to continuing weakness in the Thai economy and the ongoing trade war. The latter is adding to uncertainty over the outlook for the global economy and undermining consumer confidence, with negative impacts on spending by foreign visitors. However, the sector should return to annual growth of 3.0-3.5% in 2027 and 2028 on: (i) rising tourist arrivals, which should reach 39 million by 2028; (ii) ongoing work on infrastructure projects (e.g., the metro and real estate developments) that will accelerate urbanization and open up new markets; and (iii) growth in the customer base driven by the development of omnichannel strategies that seamlessly integrate on- and offline distribution, and by expansion into CLMV markets, thereby creating new sources of long-term income growth.
-
The outlook for individual segments is as follows.
-
Department stores: Turnover will rise by 1.5-2.5% annually thanks to resilient spending power among mid- to upper-income earners and growth in tourism. Players are extending their customer base through AR/VR technology and app-based membership schemes and are attracting high-spending shoppers by opening mega mixed-use projects.
-
Discount stores: Annual revenue should expand by 1.2-2.2%. These retailers focus on value for money and have expanded into smaller cities, allowing them to connect with a broad range of consumers. Players are also using AI and big data to strengthen sales and customer retention, though competition from online and cross-border e-commerce is intense.
-
Supermarkets: Revenue growth of 3.0-4.0% per year is forecast, supported by a customer base with strong purchasing power. Supermarkets are benefiting from stocking more high-quality products, including organic and health goods, though competition from convenience stores (which also sell fresh foods and health products) is intensifying.
-
Convenience stores: Turnover is expected to rise by 4.5-5.2% annually, supported by branch expansion into urban areas, new communities, and transportation hubs. The move into quick commerce is also attracting younger consumers, though competition from other segments is intensifying as product lines converge.
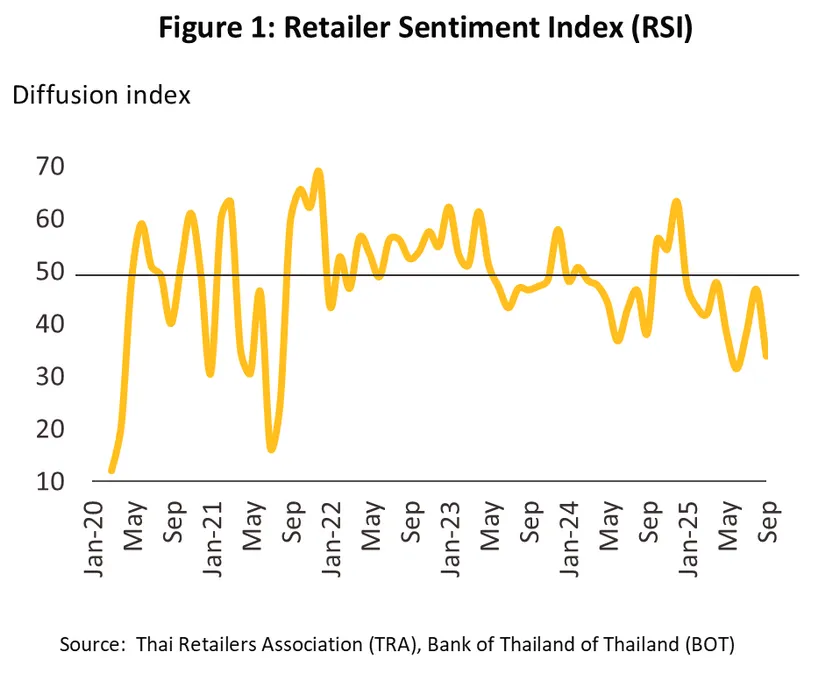
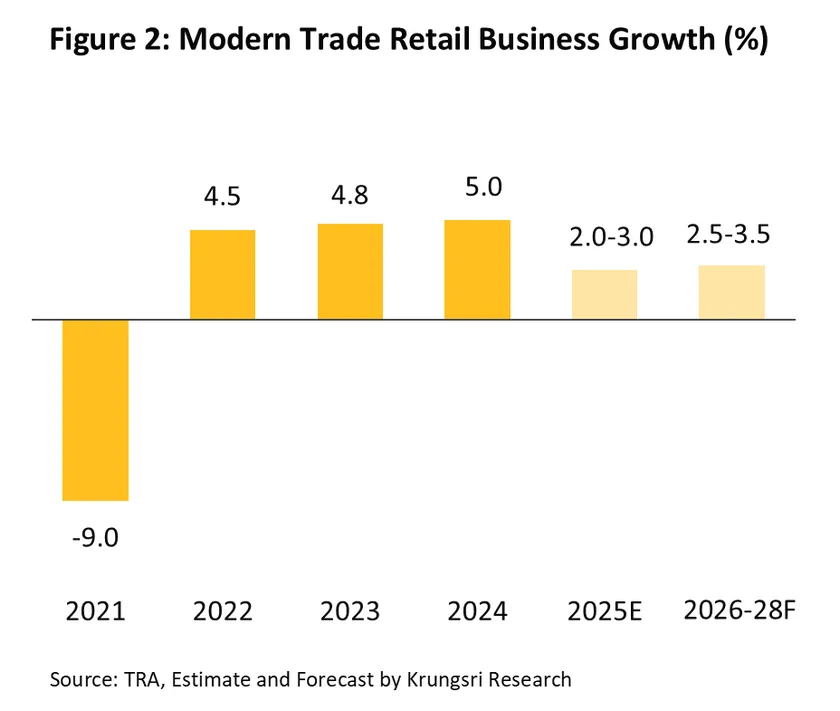
FINANCIAL SERVICES
Credit Card
Situation in 2025
-
Spending on credit cards contracted -1.2% YoY over 9M25 as sluggish economic conditions (especially in the tourism sector, where growth slackened) combined with high levels of household debt to push consumers to exercise greater care over their spending and to avoid this where it was unnecessary (e.g., on fashion items and home decorations), focusing instead on essentials and value-for-money purchases. Spending on bank-issued cards fell by -1.5% YoY, sharper than the -0.8% YoY drop in spending on non-bank cards. However, government stimulus packages, e.g., the Easy E-Receipt program (15 January-28 February), and ongoing growth in e-commerce helped to sustain spending somewhat. The total number of accounts also edged up 1.1% YoY, rising 2.8% YoY for non-bank accounts but falling -1.8% YoY for bank-issued cards.
-
Spending will improve slightly in the last quarter of the year thanks to the start of year-end festivities and the rollout of government measures that allow consumers to temporarily offset spending on travel against their tax, but overall, the economy remains weak and this will drag on spending by more exposed consumers. Thus, for the year, credit card spending will be down -1.4%, although the number of cards issued will rise by 1.0-2.0%. However, with NPLs rising from 3.8% at the close of 2024 to 3.9% in Q2 of 2025, issuers will look to tighten the release of new credit.
2026-2028 Outlook
-
Going forward, credit card spending is expected to climb by Spending on credit cards is expected to grow by 2.0-3.0% per year, and although forecast economic growth of just 1.8% will cause spending to dip, this will recover in 2027 and 2028 on: (i) an improving outlook for the domestic economy that will be led by the tourism sector, while wealthier consumers will tend to travel abroad more and this will increase credit card use proportionately; (ii) the accelerating move to the use of cashless electronic payment systems; and (iii) ongoing expansion in the e-commerce market, which Priceza sees doubling in value, jumping from a total of THB 1 trillion in 2025 to THB 2 trillion by 2030.
-
Issuers will tend to focus on attracting wealthier consumers and members of Gen Y and Gen Z earning more than THB 30,000/month. Players will also step up promotions of everyday/consumer goods and will issue new products targeted at particular demographics (e.g., tourists and individuals interested in health and beauty products). At the same time, issuers will attempt to prevent a run up in bad debts by closely monitoring changes in credit quality.
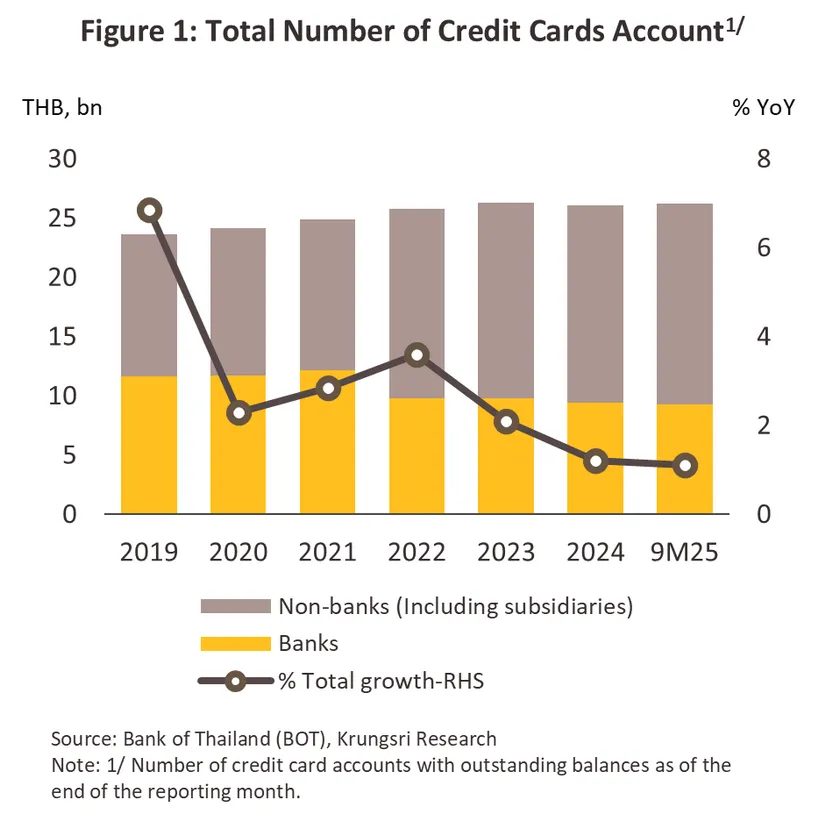
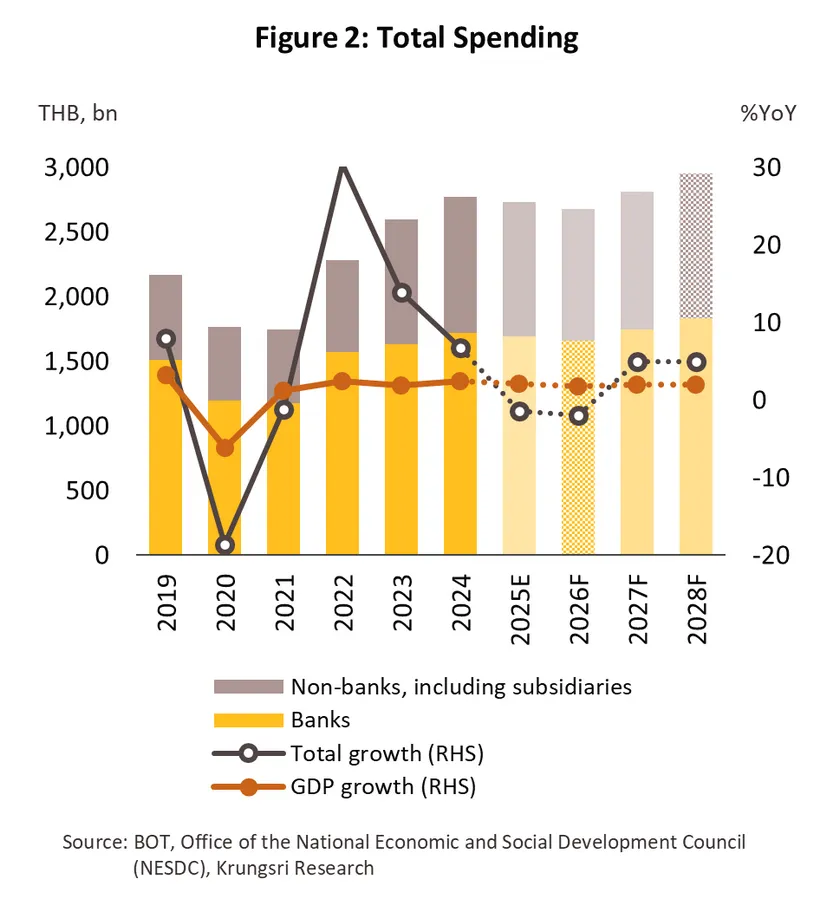
OTHER SERVICES
Mobile Communication
Situation in 2025
-
Income expanded across 9M25 thanks to the temporary boost to demand triggered by the rush to front-run new US tariffs. Industry turnover also lifted by the rapid growth in demand for data services and the growing popularity of smart IoT devices running on 5G networks, while providers further boosted sales by offering promotions that bundled related services and by focusing their marketing efforts on high-value demographics.
-
As 2025 closes, the industry will benefit from the onset of the high-spending end-of-year period, which is also the tourism high season (9.2 million foreign arrivals are expected in Q4). This will then add to the number of pre-paid accounts that are in use and so boost overall demand for mobile services. However, consumers are increasingly cautious about their spending and so income from services is expected to grow by just 2.0-3.0% this year, while average revenue per user (ARPU) will likely remain flat. Moreover, as a result of stricter rules about identity confirmation and the year’s -3.8% drop in tourist arrivals, the number of active accounts across all networks is expected to fall -4.8%.
2026-2028 Outlook
Going forward, the industry will see relatively modest rates of growth, with income from services rising by 3.0-4.0% annually. Tailwinds will come from the following.
-
Domestic purchasing power will strengthen gradually on growth in the economy, while tourist arrivals are forecast to reach 39 million by 2028, adding to demand for pre-paid services.
-
Use of mobile-based internet services will continue to rise. As of 2025, there were 67.8 million internet users in Thailand (up 3.7% from 2024) of which 56.6 million were social media users (+15.2%). Network access will also be boosted by the increasing use of IoT devices accessed through mobiles, and as such, demand for high-quality data and premium content services will increase.
-
Government policy, including the promotion of the digital economy, smart cities, and the EEC, will encourage the extension of advanced telecoms services across the country.
-
Operators will work to add value for high-potential customers through upselling 5G packages. Players will also manage network connectivity solutions for businesses in areas such as healthcare, banking, and manufacturing, and together, this will help providers develop a stable and secure revenue base.
Nevertheless, the need to provide services to a growing range of 5G applications through ongoing spending on infrastructure will put profitability under pressure.
Logistics
Warehouse Space
Situation in 2025
-
Demand for rented warehouse space firmed up through 9M25, helped by growth in international trade (+12.9% YoY), rising investment that was then reflected in a 94% YoY jump in the value of BOI applications for investment promotion, and the ongoing expansion in e-commerce, which the Priceza Thailand E-commerce Trend 2025 sees climbing by 7.0% in the year. However, both the manufacturing and tourism sectors struggled in the year, with the MPI down -2.9% YoY and total tourist arrivals slumping -7.5% YoY. At the same time, private consumption expanded at its weakest rate since 2022, and these factors then dragged on demand.
-
Through the rest of 2025, the onset of the end-of-year celebrations and the rollout of the ‘Half-half Plus Copayment’ program will lift demand for consumer goods and thus of warehouse space. Unfortunately, weakening international trade will tend to work against this trend and so overall growth for 2025 is expected to be limited to 1.0% (or to a total of 6.4 million sq.m.). Major operators are tending to push forward with investment plans and so supply will be up by 3.0%, climbing to 7.4 million sq.m., and this will then pull the occupancy rate down from 2024’s 88.0% to 86.3%.
2026-2028 Outlook
-
Demand for rented warehouse space to store inputs and finished industrial and consumer goods is expected to strengthen by around 2.5% annually on: (i) expansion in the domestic economy, driven especially by growth in the tourism sector and a rise in government spending; (ii) overseas manufacturers relocating to Thailand under pressure from intensifying trade tensions; (iii) ongoing work on national infrastructure, including the upgrade of Chiang Saen and Chiang Khong ports to multimodal logistics hubs; and (iv) estimated 15% yearly growth in e-commerce (source: e-Conomy SEA 2024).
-
Supply is forecast to expand by 3.5% annually, though some 70% of total space is in the EEC (in particular Chonburi) since this continues to benefit from investment inflows into major industries including automotive and electronics. On the demand side, renters are turning to built-to-suit and built-to-function solutions and are increasingly looking for advanced warehouses that are fitted out with equipment such as automated storage and retrieval systems and automated racking technologies. In addition, rapid growth in the food processing and pharmaceuticals industries will drive greater demand for temperature-controlled facilities. However, with growth in supply outpacing that of demand, the occupancy rate will fall to an average of 84.4%, while rents will tend to remain flat, possibly edging up slightly in areas where demand is highest.
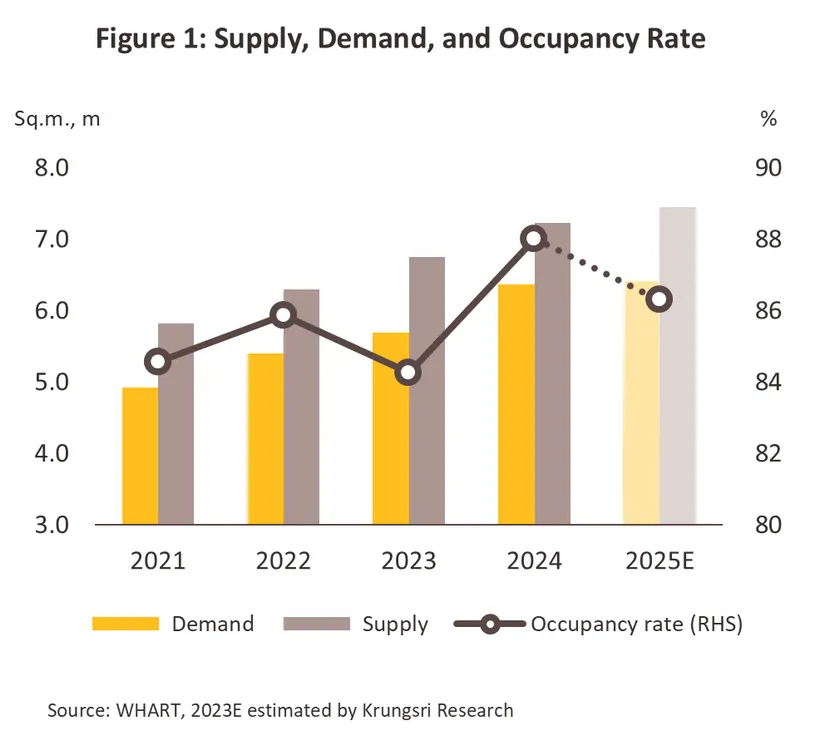
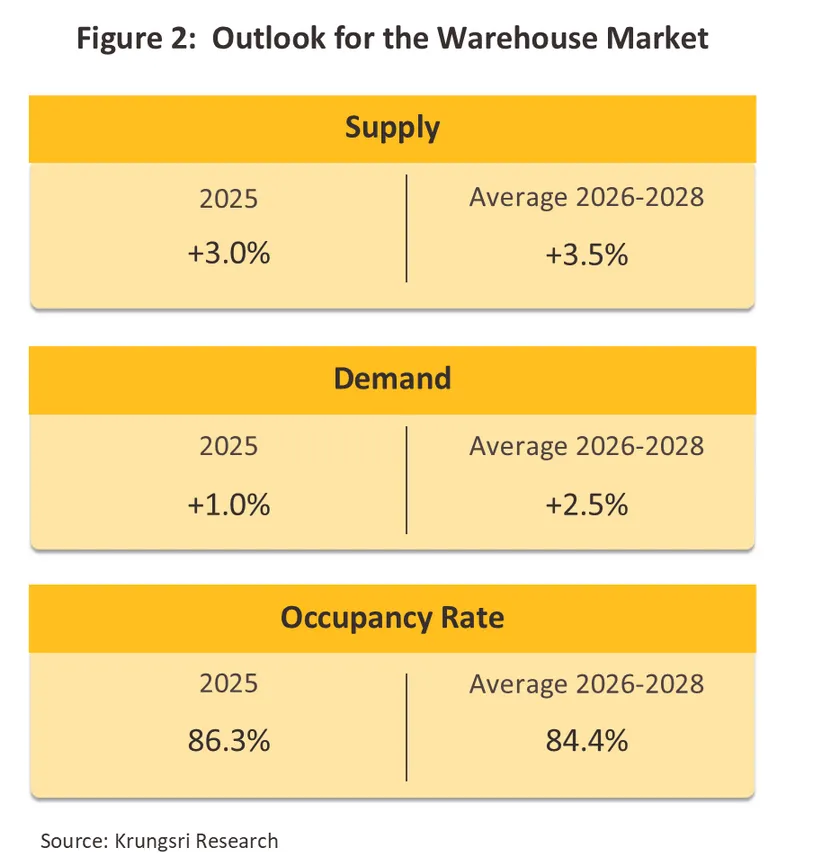
Mass Rapid Transit Operators
Situation in 2025
-
Over 9M25, operators of mass transit services benefited from: (i) the start of operations on the Pink Line extension, which increased traffic to Muang Thong Thani exhibition center; (ii) the opening of the Dusit Central Park mixed-use development, which includes a shopping center, a hotel, office space and residential units and serves as a BTS-MRT interchange, thus facilitating access to the mass transit system; and (iii) government support that came in the form of THB 20 travel on the Red and Purple lines and free travel during periods when PM2.5 levels were elevated. The general situation is described below.
-
Overall usage increased 6.2% YoY to 1.41 million passenger-trips per day. 50.9% of this was on the Green Line (+0.2% YoY), 34.5% was on the Blue Line (+0.8% YoY), and 4.7% was on the ARL (+1.4% YoY). Usage was also up 19.8% YoY on the other lines.
-
Average daily income rose 5.8% YoY on the main lines, partly due to an increase in feeder traffic from newly opened secondary lines. Traffic from the Pink and Yellow lines thus lifted income 5.0% YoY on the Green Line, while on the MRT Blue Line, additional traffic from the Red, Yellow and Purple lines boosted income by 6.9% YoY.
-
Demand will strengthen through the rest of the year with the onset of the tourism high season and the celebration of New Year events. However, the increase in fares on the Green Line extension from THB 15 to up to THB 45 (effective from 1 November) will likely reduce ridership. For the year, this is forecast to rise 7.4% to 1.43 million trips per day. Average daily income should also be up 11.5%, split between increases of 5.5% on the BTS and 22.0% on the MRT.
2026-2028 Outlook
-
Service operators are expected to see annual growth of 4-6% in passenger numbers and 5-7% in income. (i) Economic and social activity will expand in line with overall growth in the economy, while the tourism sector will also strengthen further. (ii) The opening of new lines (e.g., the Orange Line, due to commence operations in 2028) will ease travel between the suburbs and downtown locations. (iii) Work on large mixed-use developments (e.g., Dusit Central Park, One Bangkok and The Forestias), grade A office space and new residential projects in areas served by the metro system will pull in an increasing number of workers and tourists. (iv) Plans to develop Bangkok Aphiwat Station as a hub serving regional travelers will support the integration of the mass transport system and increase ridership. (v) Introducing a THB 40 flat-rate for a daily pass for use on the Red and Purple lines (from Dec 1st, 2025) will boost ridership by at least 1 million per day (source: BTS).
Challenges will include weak consumer purchasing power, high levels of household debt, sluggish economic growth, and the possible impacts on tourist spending of a slowdown in the global economy.
Maritime Shipping
Situation in 2025
-
Demand for maritime transport services strengthened over 9M25, though this was most noticeable in the first half of the year as orders were rushed through in advance of the introduction of the US ‘reciprocal’ tariffs and as such, Thai international trade volumes rose 12.9% YoY. Demand also benefited from the ongoing expansion in e-commerce, though this was counterbalanced by Thailand’s sluggish economy, weakness in private consumption and soft purchases of consumer goods. Ongoing conflicts around the world also forced shippers to reroute and this further extended delivery times.
-
Demand for maritime services for the transport of consumer goods and food will rise as the year-end festivities approach, but softness in global trade will pull down Thai freight volumes. Thus, having climbed 2.0% in 2024, UNCTAD sees 2025 rates rising by just 0.5% globally, paralleling a decline in the Sea Freight Index. Weak levels of growth in the Thai economy will also feed through into a drop off in shipments of construction materials and liquids, and so while container shippers1/ will see revenue grow by 0-3%, bulk shippers are expected to face declines of between -1% and -3%.
2026-2028 Outlook
-
Annual business revenues should climb by 1.5-2.5%, helped by: (i) growth in the world economy and global trade that the IMF sees averaging respectively 3.2% and 2.9% per year; (ii) a 1.7% annual rise in global seaborne trade (UNCTAD); (iii) greater offshoring of production by overseas companies that will then accelerate demand for import-export services; and (iv) progress on free trade agreements, which should result in 3 new FTAs in 2026 (Thailand-Sri Lanka, Thailand-Bhutan, and Thailand-EU), thus taking the total to 19 from the current 16 and boosting trade and investment. Less positively, headwinds blowing against the industry will include the US reciprocal tariffs, the intensifying global trade war, and geopolitical tensions that are likely to periodically turn violent. This will then put downward pressure on Thai exports and erode demand for maritime transport.
-
Business costs will rise, partly due to the enforcement of new environmental regulations. The IMO (International Maritime Organization)2/ has set a goal of shippers using at least 5-10% zero emission fuels (ZEFs) by 2030 and aims to establish a carbon pricing mechanism covering the release of maritime greenhouse gases as part of its plan to achieve net zero emissions by 2050. In 2026, the EU will also expand the coverage of its emissions trading system (ETS) to 100% of the shipping industry, up from 75% in 2025. In addition, the need to invest in new technologies or to retrofit older vessels with less polluting engines may further increase operators’ capital expenditure.
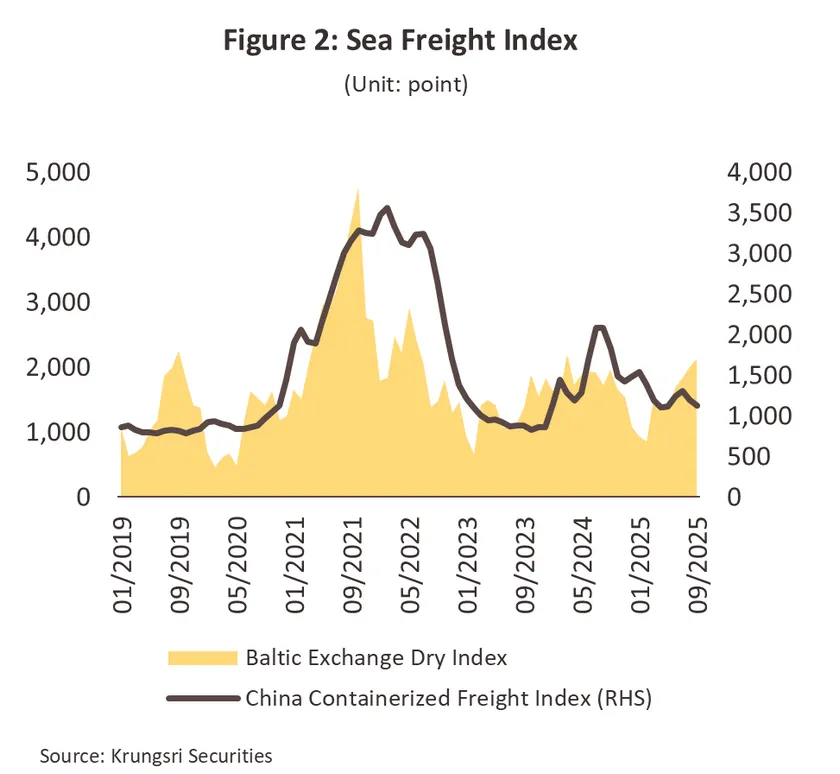
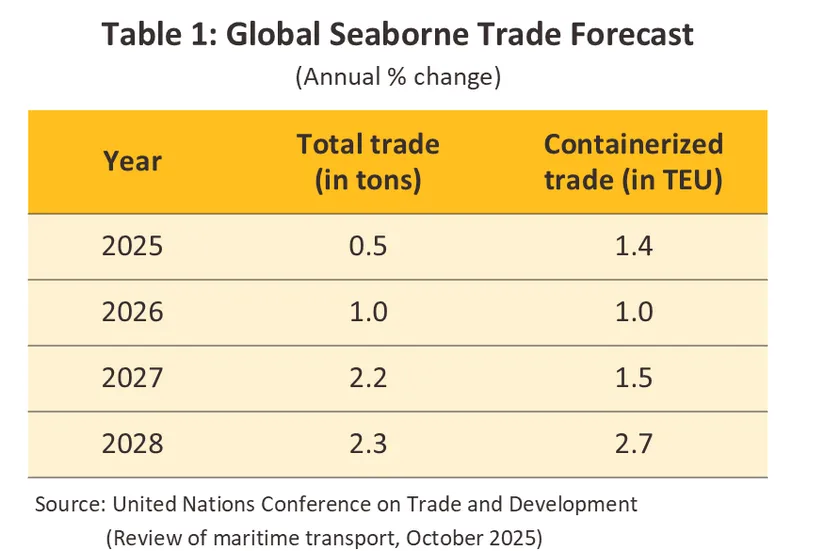
1/Source: Companies listed on the SET and MAI stock exchanges.
2/Improve the Net‑Zero Framework (NZF) in the IMO 2023 Revised Strategy
Digital Services and Software
Situation in 2024
In 2025, the overall revenue of this business is expected to grow by 4.8%, down from 14.9% in 2024, with growth likely to soften across all business segments.
-
Digital services (a key driver of the overall business): Revenue is expected to grow by 5.5% in 2025, down from 19.5% in 2024, in line with the broader economic slowdown that is prompting consumers to be more cautious with their spending. Nonetheless, growth will continue to be supported by (i) the expansion of government and large-enterprise transactions through platform services that require large-scale cloud-based data, particularly in Data Analytics and Cybersecurity, and (ii) SMEs increasingly shifting toward digital marketing via social platforms and live streaming to showcase products and broaden market reach at a relatively low cost.
-
Software and software services: Revenue is expected to grow by 4.4% in 2025, down from 8.5% in 2024, reflecting businesses’ slower spending on new software system installations amid the ongoing economic slowdown. This aligns with the moderate growth in private sector investment, which expanded by 2.3% YoY during 9M2025 (Source: NESDC). Nevertheless, growth continues to be supported by certain SME groups that remain in the transition phase toward adopting cloud-based Enterprise Resource Planning (ERP) and Customer Relationship Management (CRM) systems.
-
Digital contents: Revenue is expected to grow at a modest pace of 1.4%, decelerating from 14.4% in 2024, due to (i) online gaming businesses being affected by the economic slowdown, and (ii) animation and character businesses—whose demand largely depends on the advertising and events markets—remaining weak amid declining tourist arrivals and a slowdown in the restaurant and leisure sectors. In particular, the animation segment is facing intensifying competition from neighboring countries, such as Indonesia, which is rapidly advancing AI-driven animation production at lower costs.
2026-2028 Outlook
Overall, this industry’s revenue is expected to maintain steady growth at an average annual rate of 6.8%. However, growth in 2026 is likely to moderate to 4.7%, reflecting the broader economic slowdown and the impact of U.S. reciprocal tariff measures, which continue to dampen consumer confidence. Growth momentum is expected to gradually recover in 2027–2028.
-
Digital services: Revenue is expected to grow at an annual rate of 7.7%, supported by: (i) supply-side factors, including intensifying competition in service technologies across the financial and insurance sectors, manufacturing, logistics, and other service industries. These sectors increasingly adopt cloud-based data analytics and data centers as core strategies, helping broaden the customer base for platform and digital service businesses; and (ii) demand-side factors, driven by the continued rise in online transactions. In 2024, 94% of Thai retail consumers conducted online transactions, the second-highest share in the world after China at 95% (Source: Statista).
-
Software and software services: Revenue is expected to grow 6.3%, driven by (i) business trends favoring SaaS over traditional servers to reduce IT workload and infrastructure costs, and (ii) the development of intelligent software powered by AI and machine learning. Strong growth is expected in data processing software services and customized software network development.
-
Digital contents: Revenue is expected to recover but grow at a modest 2.0%. Although demand may gradually improve, price competition with low-cost products from neighboring countries could limit revenue growth in this segment.
Data Center
Situation in 2024
-
In 2024, Thailand’s data center industry generated total revenue of USD 2.76 billion (THB 97.6 billion), up 28.7% from the previous year. This comprised: 1) network infrastructure revenue, which grew 22.4% (67.9% of total revenue) due to rising internet usage and ongoing infrastructure investment; 2) server system revenue, which surged 59.8% (23.0% of total) driven by strong demand for Artificial Intelligence (AI) and cloud services, prompting businesses to invest in higher-performance servers; and 3) data storage systems revenue, which increased 15.6% (9.1% of total) amid growing data volumes and cloud storage demand in both the public and private sectors.
2025 Forecast
-
In the first 9 months of 2025, Thailand received 119 investment promotion applications in the digital industry, representing over THB 612.8 billion in investment value. Most applications were for the data center industry, with investors from countries such as the U.S., China, and Singapore. With the expected increase in investment value, along with positive factors that continue to provide momentum, total revenue in the data center industry is projected to grow 14.0–15.0% in 2025, with network infrastructure revenue expected to rise 11.9–12.9%, server systems 21.8–22.8%, and data storage systems 10.4–11.4%.
2026-2028 Outlook
The total revenue of the data center industry in Thailand is expected to grow at an average of 10.2-11.2% per year during 2026-2028. Revenue classified by type is as follows:
-
Network Infrastructure: Revenue is expected to grow by 7.8-8.8% per year from increasing internet usage demand and the continuous development of 5G networks by internet service providers in Thailand, which will increase demand for data connection networks between data centers and users. This requires investment in network infrastructure that supports massive data transmission volumes, as well as the investment entry of foreign technology companies that will support investment in digital infrastructure development and be conducive to revenue growth.
-
Server Systems: Revenue is expected to grow by 16.1-17.1% per year from consumer and business demand for AI and cloud systems, resulting in related companies needing to invest in high-performance server systems to support usage, as well as the growth of Internet of Things (IoT), which is a technology that requires large volumes of data for efficient real-time processing, leading to increased server demand in both quantity and variety.
-
Data Storage Systems: Revenue is expected to grow by 10.4-11.4% per year from the increase in large-scale data resulting from AI usage, the expansion of E-commerce and E-payment, which require substantial data storage capacity. Operators will need to invest further to ensure security and speed. In addition, the increasing enforcement of personal data protection laws, particularly the Personal Data Protection Act (PDPA), is another key factor driving sustained growth in demand for data storage systems.
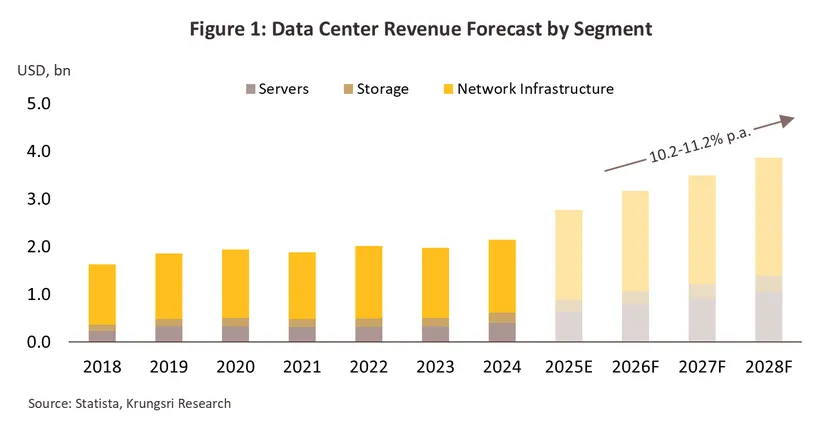


.webp.aspx)