EXECUTIVE SUMMARY
During 2026-2028, total revenue for Thailand’s food and beverage service business is projected to expand by an annual average rate of 2.9-3.9%. In 2026, revenue growth is expected to remain limited due to an economic slowdown under geopolitical tensions, particularly the conflict in the Middle East that has resulted in rising oil prices, undermining spending confidence and causing the number of international tourists’ arrival to recover slowly due to increased travel costs. However, during 2027-2028, revenue in this business will begin to improve, benefiting from leisure activities that will pick up in line with economic conditions and a tourism sector that will gradually recover, as well as the role of social media which allows operators to reach consumers through storytelling, thereby supporting increased demand for dining out. On the supply side, the number of operators tends to increase, driven by factors such as the rising use of food delivery applications and the expansion of shopping malls and modern retail stores, which help increase distribution channels and broaden the customer base of the food and beverage business. However, the industry continues to face challenges, including intensified price competition due to discounting strategies by high-end restaurants, while costs tend to remain stable at high levels, especially energy costs amid geopolitical tensions that will continue to occur periodically.
Krungsri Research view
-
Food and beverages service businesses (major players/ chains): The business is expected to grow driven by (1) aggressive branch expansion helps diversify location-related and purchasing power risks by serving both Thai and foreign customer segments, with outlets establishing both inside and outside shopping mall, (2) operators continue to develop and launch new brands while increasing their presence in more affordable mass-market segments, (3) brand popularity with wide-range access channels enhance consumer reach across various area, and (4) high-volume of raw material orders increase bargaining power of operators with suppliers, allowing them to reduce unit cost during periods of elevated food and beverage price. This cost advantage supports the profitability advantage of chain restaurant operators.
-
Food and beverages service (smaller/independent operations): The business is expected to grow in line with tourist volumes and gradually recovering economic activities. However, it remains facing risks from high energy and raw material costs and the market share expansion of large-scale or chain players. Furthermore, consumer purchasing power may still be awaiting recovery amid a high cost of living, leaving this group, which consists mostly of small and medium-sized operators, still at risk regarding profitability.
Overview
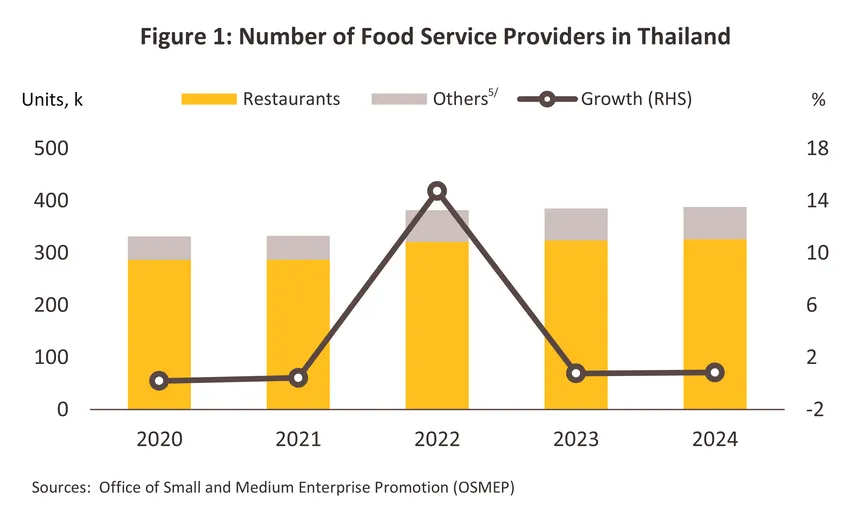
The food and beverage service business refers to enterprises providing ready-to-consume food, beverages, ice cream, and cakes, encompassing full service, limited service1/, and take-away services. In 2024, the number of Thai food and beverage businesses in the registration database totaled 388,219 outlets2/ (an increase of 0.8% from 384,974 outlets in 2023). Based on the Thailand Standard Industrial Classification3/ (TSIC), the business can be categorized into seven types as follows:
-
Restaurants4/: These provide food and beverage services prepared for immediate consumption with various facilities, such as seated or non-seated options, table service or self-service, and dine-in or take-away options, including restaurants, cafes, and counters. There are 326,403 such operators in the registration database, accounting for a high proportion of 84.1% of the total registered food and beverage service businesses in Thailand.
-
Non-alcoholic beverage stores4/: These provide ready-to-consume non-alcoholic beverage services with various facilities, such as with or without entertainment, seated or non-seated options, and table service, self-service, or take-away options, including coffee shops and juice bars. There are 57,501 such operators in the registration database, representing a proportion of 14.8%.
-
Alcoholic beverage stores4/: These provide ready-to-consume alcoholic beverage services with various facilities, such as with or without entertainment, seated or non-seated options, and table service, self-service, or take-away options, including bars and liquor stores. There are 4,133 such operators in the registration database, representing a proportion of 1.1%.
-
Foods stalls and market sellers5/: These provide ready-to-consume food and beverages at stalls and markets, offering various facilities such as with or without entertainment or seating options, with only 91 such operators in the registration database, representing a proportion of less than 0.1%.
- Mobile food businesses5/: These consist of ready-to-consume food and beverage outlets in a mobile format using vehicles or carts, with only 60 such operators in the registration database, representing a proportion of less than 0.1%.
-
Beverage stalls and market sellers5/: These provide ready-to-consume beverage services at stalls and markets, whether with or without entertainment or seating options, with only 17 such operators in the registration database, representing a proportion of less than 0.1%.
-
Mobile beverage businesses5/: These provide ready-to-consume beverages through mobile outlets using vehicles or carts, with only 14 such operators in the registration database, representing a proportion of less than 0.1%.
The primary reason categories 4-7 represent a small proportion compared to the total registered food and beverage service businesses in Thailand is that the database only covers operators within the system registered with the Office of Small and Medium Enterprises Promotion (OSMEP) and the Department of Business Development. Most of these operators are micro-enterprises or Micro SMEs operating outside the formal system.
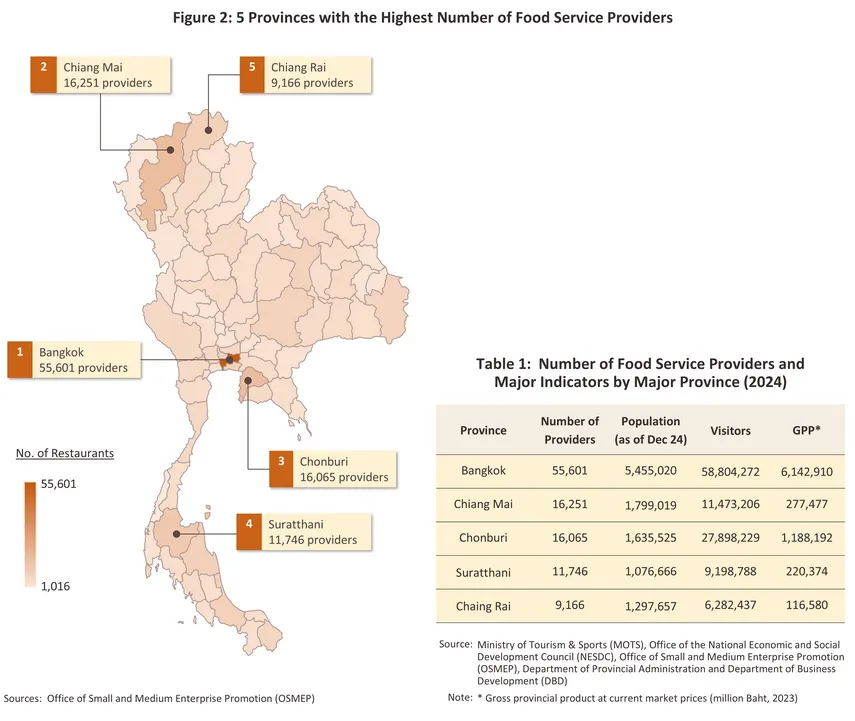
Furthermore, food and beverage businesses are concentrated in Bangkok, as the city of functions capital, a major tourist destination, a commercial hub, and the center of various economic activities in Thailand. As a results, Bangkok hosts 55,601 outlets accounting for 14.3% of the total registered food and beverage businesses in Thailand. This is followed by Chiang Mai with 16,251 outlets (4.2%), Chonburi with 16,065 outlets (4.1%), Surat Thani with 11,746 outlets (3.0%), and Chiang Rai with 9,166 outlets (2.4%). These provinces are predominantly popular destination for both Thai and foreign tourists and are characterized by relatively dense residential populations. Most food and beverage outlets are under the supervision of the Ministry of Public Health, which is responsible for regulating restaurants to ensure standards across personnel, premises, food, equipment, and utensils.
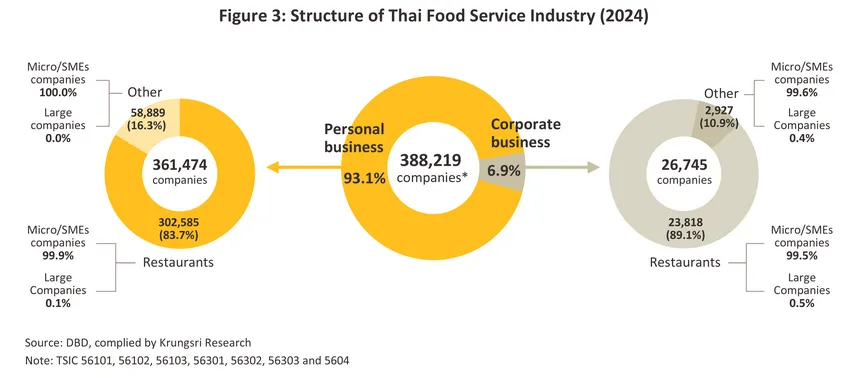
The classification of food and beverage business operators in 2024 is as follows (Figure 3):
-
Personal businesses: consist of 361,474 entities, accounting for 93.1% of the total registered food and beverage outlets in Thailand. The majority are micro, small, and medium-sized operators, totaling 361,471 entities (99.9% of all personal business operators), while the remaining 3 are large-scale operators.
-
Corporate businesses: consist of 26,745 entities, accounting for 6.9%, with the majority being micro, small, and medium-sized operators totaling 26,623 entities (99.5% of all corporate business operators), and the remaining 122 are large-scale operators.
When focusing specifically on the restaurant segment, which holds the largest registrations share within the food and beverage industry, the segment is divided into 302,585 units, accounting for 92.7% of the total registered restaurant businesses in Thailand. This is partly because the restaurant business fulfills fundamental consumer needs and requires varying levels of investment capital depending on the operator's readiness, allowing for easy market entry and exit. The remaining 23,818 entities are corporate businesses, representing a proportion of 7.3%. The growth direction of the business fluctuates in accordance with economic and tourism conditions, as well as the expansion of restaurants located within department stores or modern retail outlets.
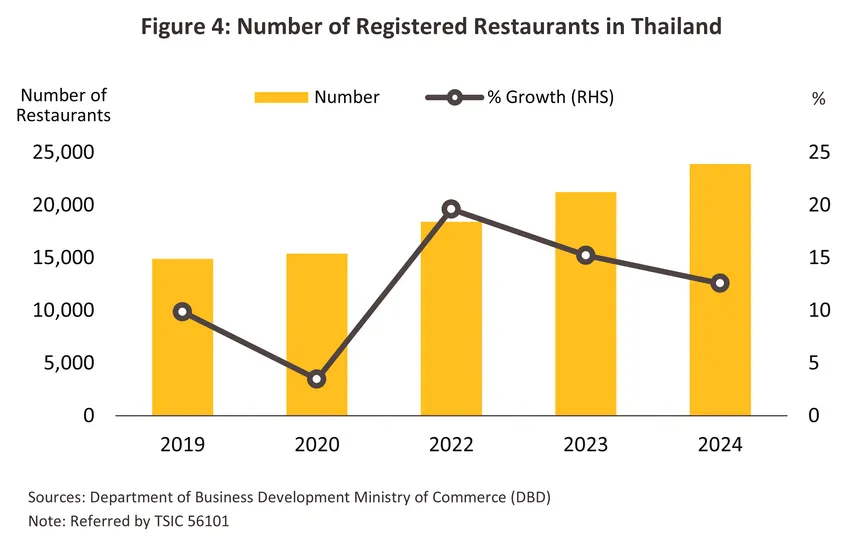
According to data from the Department of Business Development regarding registered corporate entities still in operation in 2024, the number of operators in food and beverage service activities stood at 26,820, an increase of 12.9%, representing an additional registered capital value of THB 9,009mn. The majority are restaurants totaling 23,891 outlets (89.1% of all registered food and beverage businesses), an increase of 12.6% from 21,224 outlets in 2023, accounting for an increase in registered capital value of THB 8,120mn. This resulted from economic activities gradually returning to normal, leading consumers to dine out, travel, and engage in more outdoor activities, which helped support the gradual recovery of the restaurant business. However, the rising number of operators and operating costs have led to intensified competition, pressuring some non-competitive restaurant businesses to cease operations, totaling over 861 entities in 2024, an increase of 19.3% from 2023, representing a loss of registered capital value of THB 1,994mn.
Regarding other food and beverage service businesses that are registered as corporate entities and remain in operation, there are 2,929 entities (10.9% of all registered food and beverage businesses), an increase of 15.8% from 2,529 operators in 2023, representing an additional registered capital value of USD 889mn. Similar to the restaurant business, pressure from the rising number of operators and higher operating costs resulted in 111 non-competitive operators ceasing operations, an increase of 19.4% from 2023, representing a loss of registered capital value of USD 400mn.
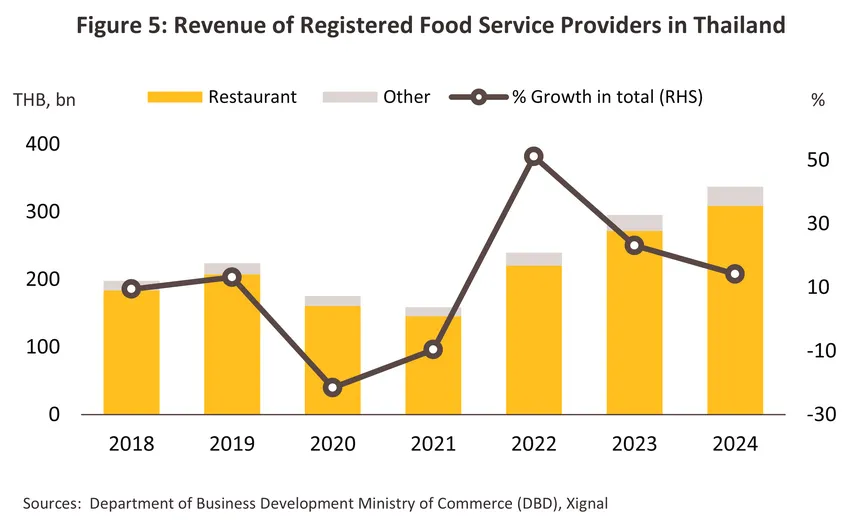
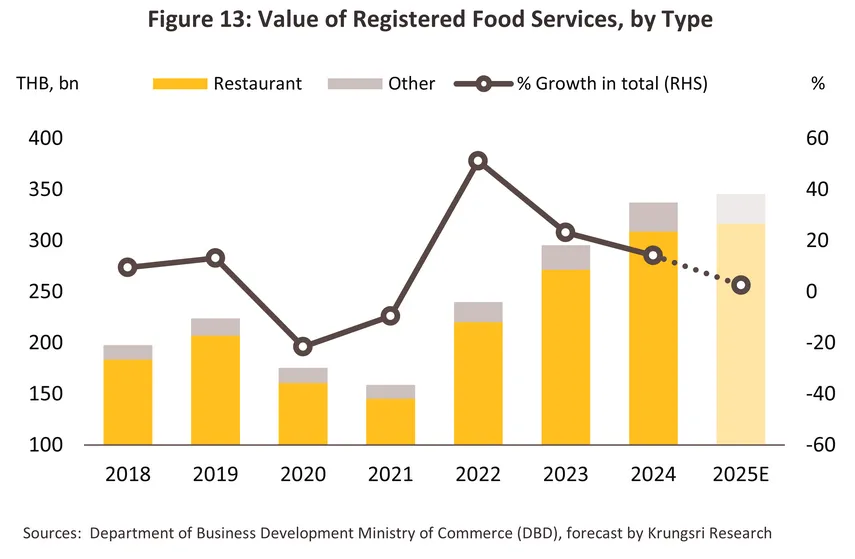
The total revenue of all Thai food and beverage businesses registered with the Department of Business Development as of 2024 stood at THB 337.2bn6/, an increase of 14.2% (Figure 5). This is categorized into two major groups as follows:
-
Restaurants hold the largest revenue share at THB 308.8bn, accounting for 91.6% of the total registered food and beverage business revenue in Thailand, with a compound annual growth rate (CAGR)7/ of 8.3%. Since economic activities gradually returned to normal in 2022, the revenue of restaurant operators has continued to grow at levels higher than the pre-COVID-19 pandemic period.
-
When classified by the nationality of the corporate entity in 2024, the primary investment value came from Thai juristic persons totaling THB 119.3bn (representing 91.6% of restaurant business investment value), an increase of 1.8% from 2023. Meanwhile, foreign juristic persons had a total investment of THB 10.9bn (representing 8.4% of restaurant business investment value), an increase of 9.5% from 2023.
-
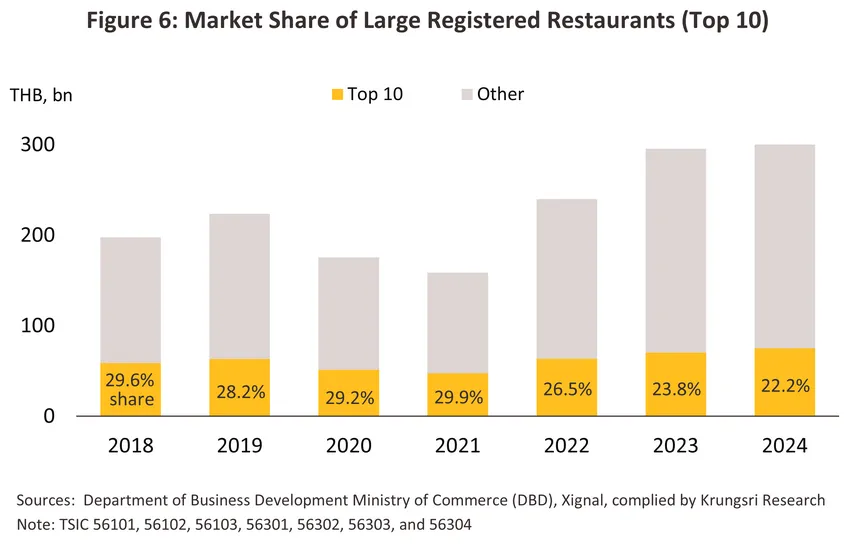
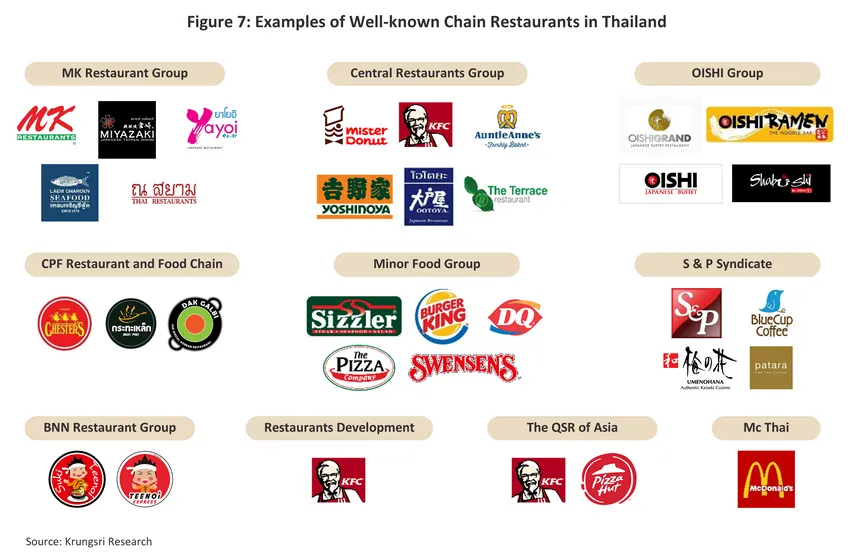
According to data from the Department of Business Development, the 10 key operators in the restaurant segment include MK Restaurant Group PCL, Central Restaurants Group Co., Ltd., The QSR of Asia Co., Ltd., McThai Co., Ltd., BNN Restaurant Group Co., Ltd., Restaurants Development Co., Ltd., S&P Syndicate PCL, The Minor Food Group PCL, and Oishi Group PCL. These groups recorded a combined revenue of THB 75.0bn, accounting for 22.2% of the total restaurant business revenue in 2024 (Figure 6 and 7), with an average growth of 3.5% CAGR8/.
-
Other businesses: These hold a revenue share of THB 28.4bn, accounting for 8.4% of the total registered food and beverage business revenue in Thailand, with an average growth of 11.4% CAGR. Driven by economic activities gradually returning to normal in 2022, the revenue of other business operators grew by 19.0%, which can be categorized by business type as follows:
-
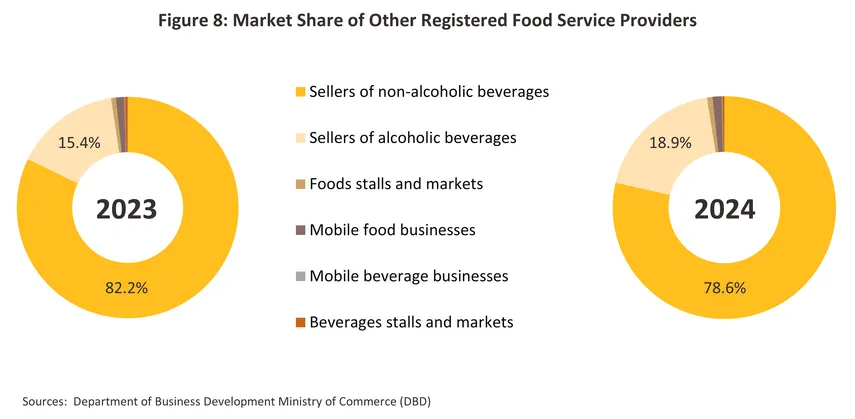
Non-alcoholic beverage services (e.g., coffee shops, cafes): With revenue of THB 22.3bn, growing 13.8% from THB 19.6bn in 2023, representing a 78.6% share of total other business revenue (decreasing from an 82.2% share in 2023)
-
Alcoholic beverage services (e.g., pubs, bars, entertainment venues): With revenue of THB 5.4bn, growing 46.4% from THB 3.7bn in 2023, representing an 18.9% share of total other business revenue (increasing from a 15.4% share in 2023)
-
Food stalls and market services: With revenue of THB 219.9mn, expanding 32.9% from THB 165.5mn in 2023, representing a 0.8% share of total other business revenue (increasing from a 0.7% share in 2023)
-
Mobile food services: With revenue of THB 368.6mn, increasing 29.6% from THB 284.4mn in 2023, representing a 1.3% share of total other business revenue (increasing from a 1.2% share in 2023)
-
Mobile beverage services: With revenue of THB 17.1mn, contracting -19.6% from THB 21.2mn in 2023, representing a 0.1% share of total other business revenue (share remained stable from 2023)
-
Beverage stalls and market services: With revenue of THB 92.6mn, contracting -2.5% from THB 95.0mn in 2023, representing a 0.3% share of total other business revenue (decreasing from a 0.4% share in 2023).
-
When classified by nationality of the corporate entity, total revenue primarily originated from Thai juristic persons with a value of THB 7.5bn (representing 87.7% of other business revenue), an increase of 44.0% from 2023, while foreign operators had a total revenue of THB 1.0bn (representing 12.3% of other business revenue), an increase of 11.7% from 2023
-
According to data from the Department of Business Development, key operators in the other business group include Coffee Concepts Retail Co., Ltd., Bangchak Retail Co., Ltd., Sunflower International Co., Ltd., Pavitch Design Co., Ltd., and KOI THE (Thailand) Co., Ltd., which collectively recorded a revenue of THB 13.8bn, accounting for 48.5% of other business revenue, with an average increase of 7.2% CAGR.
Situation
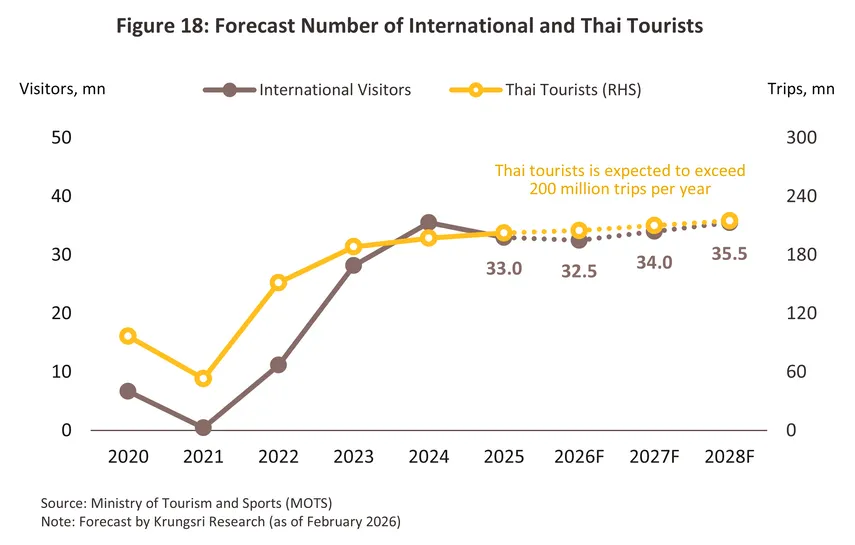
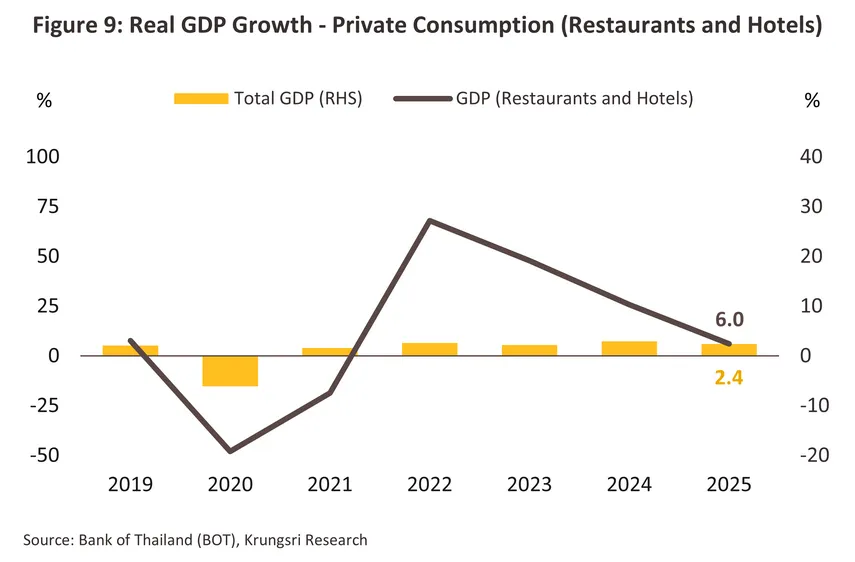
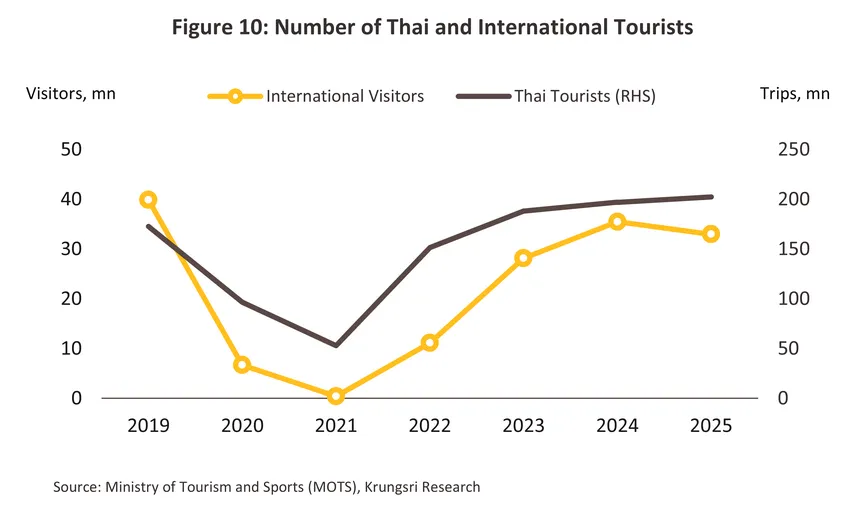
In 2025, demand in the food and beverage business rose, as reflected by the Gross Domestic Product (GDP) for private consumption in the restaurants and hotels category at constant prices, which grew by 6.0% compared to total GDP growth of only 2.4% compared with 2024. The key driving factors were the gradual recovery of economic activities, tourism, and leisure businesses, even though the expansion rate remained moderate. Krungsri Research estimates that total revenue for the food and beverage business expanded by 2.0-3.0% in 2025, a decrease from the 14.2% expansion in 2024. This deceleration was mainly due to a 7.2% contraction in foreign tourist arrivals in 2025, led by a steep decline in Chinese tourists (-33.6%) due to safety concerns and a reduction in Malaysian visitors (-8.7%) following from flooding in the South. However, the overall tourism sector still possesses growth potential, supporting foreign tourist consumption. Simultaneously, government policies to stimulate tourism and domestic spending also helped boost expenditure and domestic travel among Thai tourists.
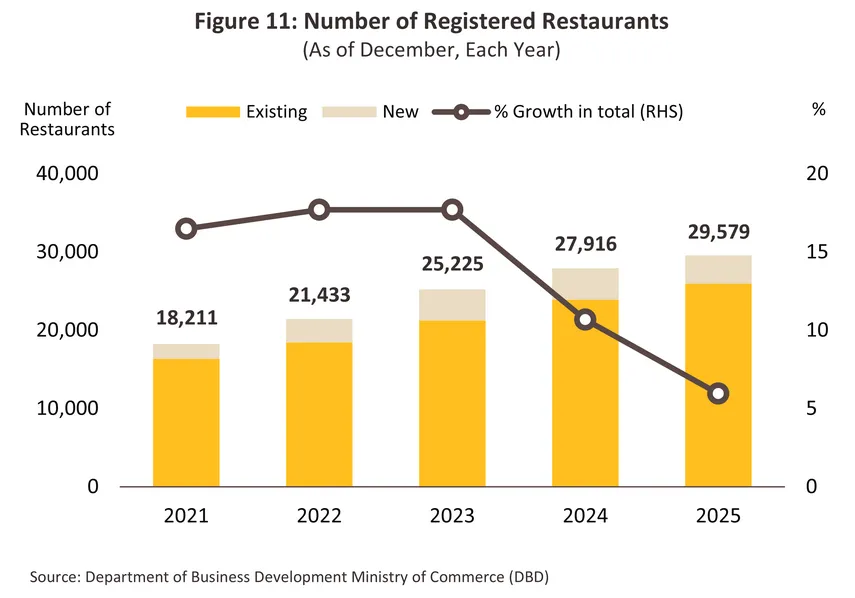
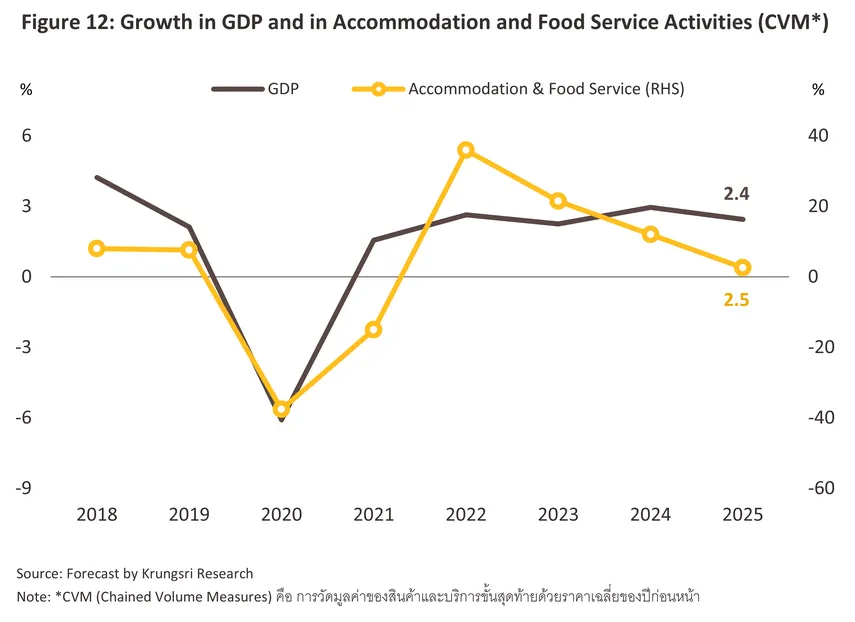
On the supply side in 2025, the total number of registered corporate restaurant businesses in operation increased by 6.0% to 29,579 outlets10/(Figure 11), consistent with the gradual recovery of economic activities. However, the growth rate showed a continuous slowing trend from the previous year, as the number of newly registered operators decreased by -10.2% to 3,616 outlets. The areas experiencing a decline in new openings were primarily tourist provinces and economic hubs with a high cost of living, such as Bangkok (-15.8%), Phuket (-15.6%), Chiang Mai (-7.2%), and Chonburi (-4.6%). This marks the first contraction in the number of newly registered operators since the economy began recovering post-COVID-19, reflecting weakened purchasing power under the pressure of persistently high debt levels. Furthermore, consumer spending per transaction trended downward as consumers became more cautious with outdoor expenditures, aligning with the GDP growth in the accommodation and food service activities sector, which slowed from 12.0% in 2024 to 2.5% in 2025 (Figure 12). Intensifying competition in the restaurant business has made it more difficult for new operators to enter the market, especially those without business networks linked to the tourism sector or tour groups.
According to the aforementioned factors, the revenue of corporate food and beverage businesses in 2025 is expected to expand at a decelerated rate of 2.0-3.0%, reaching a value of THB 340-350bn (Figure 13). This aligns with headwinds including a decrease in the number of foreign tourists, raw material and labor costs remaining at high levels, as well as shifting consumer behaviors toward increased use of food delivery platforms. However, the industry received partial benefits from government economic stimulus measures that provided support toward the end of the year, such as Half-Half Plus Copayment Program. Additionally, many restaurants have adapted by focusing on consumer value in terms of both quantity and quality, adjusting prices to be more appropriate while developing more attractive set menus, such as buffet with accessible pricing, which has helped business revenue continue to grow.
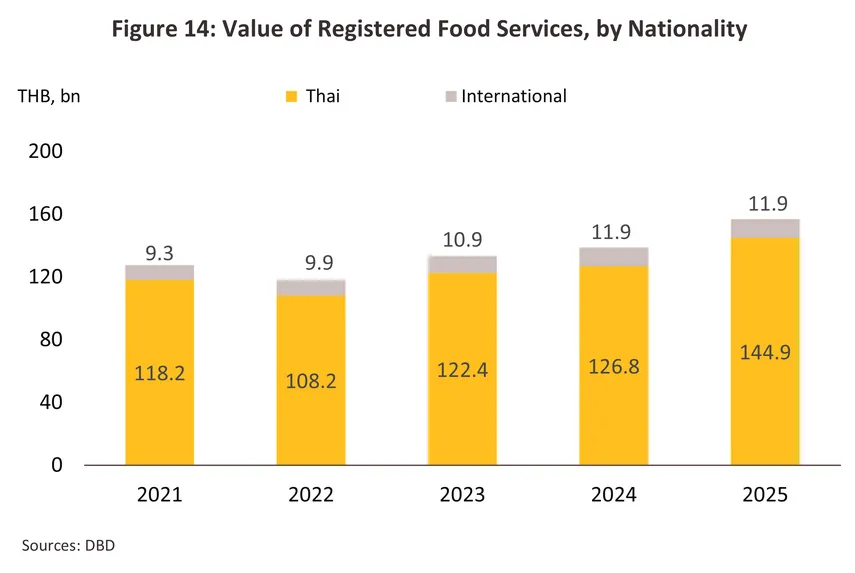
The primary revenue of the food and beverage business still originates from Thai juristic persons. In 2025, the investment proportion of Thai juristic persons increased to 92.4% from 91.4% (Figure 14). Although the overall investment proportion of foreign juristic persons declined slightly, investment by Chinese juristic persons in the restaurant segment tended to increase significantly. The investment value rose from THB 947.8mn in 2022 to THB 2,143.4mn in 2025, representing a growth of 31.3% CAGR during 2022-2025. Consequently, Chinese juristic persons have emerged as the largest foreign investor group in restaurant segment by investment value.
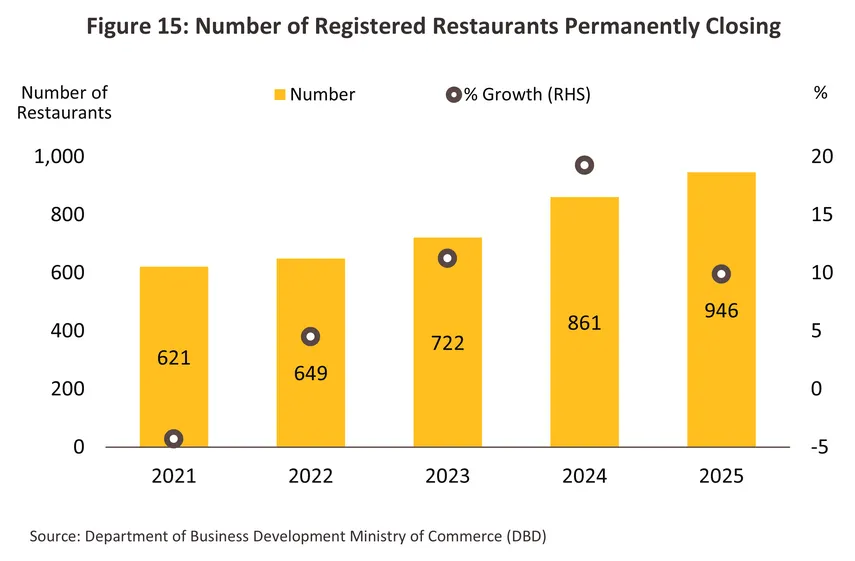
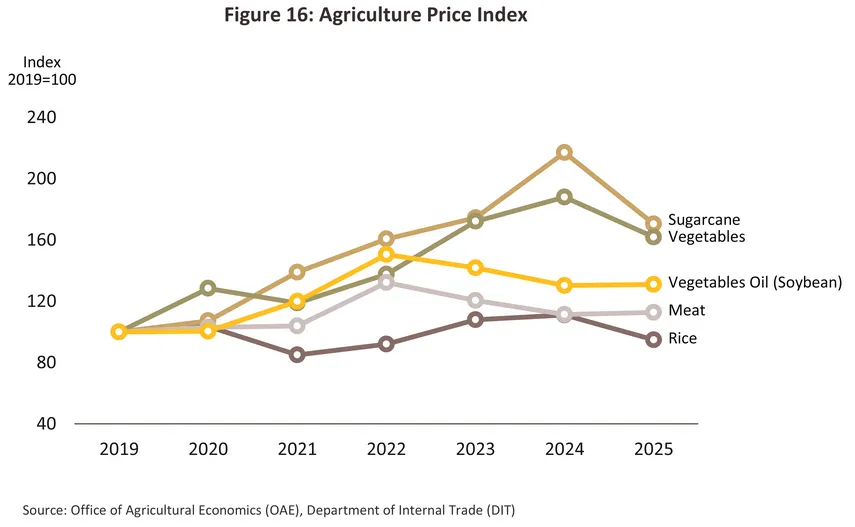
Challenges continuing to press the performance of restaurant businesses in 2025 include (1) intensifying competition, as seen in the 946 registered corporate restaurant entities that ceased operations in 2025, an increase of 9.9% from 861 entities in 2024 (Figure 15), and (2) raw material costs, which constitute the primary expenditure11/, remaining at high levels despite some moderate declines. Specifically, vegetable prices have been impacted by volatile weather conditions (Figure 16). When combined with a decelerating demand growth trend, these factors have led to reduced profitability for operators. Consequently, some businesses have scaled back new hiring and transitioned to hiring part-time staff only as necessary to reduce cost (Source: Thansettakij, December 2025).
Outlook
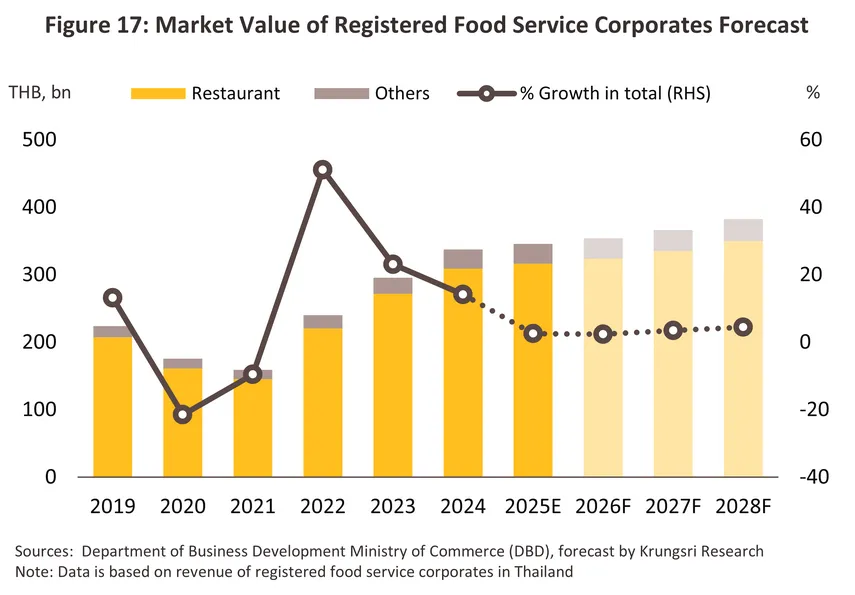
During 2026-2028, Krungsri Research expects demand in the restaurant business to continue growing gradually, with total industry revenue likely expanding by an average of 2.9-3.9% annually or reaching THB 350-390bn (Figure 17). However, in 2026, growth is projected to remain at a low rate amid several challenging factors:
-
An economic slowdown under geopolitical tensions, particularly the unrest in the Middle East which has caused oil prices and the cost of living to rise, undermining purchasing power and spending confidence.
-
A slow recovery in the international tourist market due to the impact of unrest in the Middle East, which may cause long-haul travelers from both Europe and the Middle East to delay travel due to higher travel costs, limited flight frequencies, and safety concerns. Furthermore, Thailand faces intense tourism competition from other countries implementing more aggressive policies to attract visitors. This may result in a slow recovery for restaurants relying on international tourist income, despite the easing of alcohol sale time restrictions (a 180-day trial measure effective since early December 2025), which currently allows temporary additional alcohol sales during 14:00–17.00. This measure may provide only limited support to restaurant sales under unfavorable tourism market conditions.
-
Intensifying competition, especially as consumers become more cautious with spending and prioritize value for money, forcing operators to face continuous price competition pressure. The mid-tier market will be severely affected by (3.1) price reduction competition from high-end and hotel restaurants, (3.2) value-based competition from mid-to-low tier markets, and (3.3) investment expansion by new large-scale capital groups into the mid-tier market using pricing strategies to seize market share from existing players.
However, revenue in this business is expected to gradually improve during 2027-2028, driven by the following factors:
-
Leisure activities that trend upward in line with economic conditions and the tourism sector, as the number of foreign tourists is projected to gradually increase, which will support higher overall consumption spending.
-
An increasing role of social media in consumer behavior, enabling operators to conduct targeted marketing and communicate more effectively with customers. This includes collaborating with social media influencers to promote new restaurants or menus to a wider audience, which helps build brand awareness through storytelling and further stimulates sales.
On the supply side, the number of operators tends to increase due to factors supporting the entry of new producers, namely:
-
The rising use of food delivery applications, which helps increase distribution channels, broaden the customer base, and enhance brand awareness on a wider scale.
-
The expansion of shopping malls and modern retail stores, in both large and small scales, particularly in high-potential locations or new tourist attractions, which facilitates increased commercial opportunities and better access to target customer groups.
-
The increased application of technology, such as POS (Point of Sale) systems, which helps make stock management and cost control more efficient, including the use of Artificial Intelligence (AI) to analyze sales data and consumer behavior for precise pricing and promotion planning, as well as elevating restaurant management to be more systematic.
However, the business continues to face pressure from price competition while operating costs tend to remain stable at high levels, especially agricultural raw materials which are volatile in terms of both volume and price due to extreme heat and drought conditions. This is particularly intensified as the El Niño phenomenon become more pronounced toward 2028. Additionally, operating costs that tend to remain at high levels—specifically energy costs amid ongoing geopolitical tensions, as well as rising trends in rent, electricity, and labor costs—continue to weight on operators’ profitability. Meanwhile, consumers remain cautious with spending and are price-sensitive, preventing shops from fully passing on increased cost burdens to consumers.
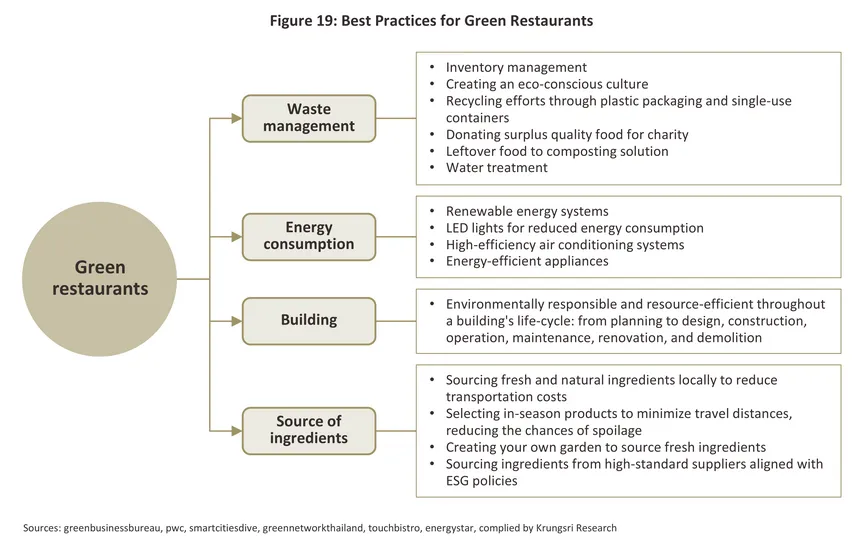
Transformation towards Sustainability
It is becoming increasingly important for businesses to focus much more heavily on their sustainability. players in the food and beverage industry are therefore now competing to overhaul their business operations and products and to ensure that their use of resources is as efficient as possible. In particular, this tends to emphasize compliance with ESG (environmental, social and governance) principles and the reuse of resources and inputs.
-
Environmental: players are beginning to adapt by: (1) using power generated from solar cells; (2) reduce water usage; (3) treating waste water before this is discharged; (4) using refrigerants that do not contribute further to climate change; (5) using EVs instead of ICE-powered motorcycles for delivery services; (6) cleaning and separating plastics and then recycling these, and using organic waste to make compost or animal feed rather than sending this to landfill; and (7) greening the entire restaurant lifecycle and reducing environmental impacts, from design and the use of materials and technologies through to construction.
-
Social: Many companies increase their involvement in social responsibilities by: (1) working harder to hire people with disabilities; (2) helping children access education through grants and other financial aid; and (3) donating surplus food that still has good quality to charities for distribution to those in need.
-
Governance: This encompasses areas relating to the enterprise, its customers, and its stakeholders, and in the case of restaurant businesses, this may extend to include issues such as animal welfare. For example, restaurants operated by Baan Ying Group12/ and Mo Mo Paradise13/ have moved to use only eggs sourced from cage-free flocks.
These changes will likely add to business overheads connected to the provision of both goods and services, but because the scope for passing these increases on to consumers is limited by current weakness in spending power, this may put downward pressure on profits.
1/ For example, restaurants offering self-service food and drink facilities, or taking advantage of self-service payment systems.
2/ Source: Office of Small and Medium Enterprise Promotion (OSMEP) and Department of Business Development
3/ Source: Department of Employment (Ministry of Labour)
4/ Restaurants (TSIC 56101), Non-alcoholic beverage stores (TSIC 56302), and Alcoholic beverage stores (TSIC 56301)
5/ Foods stalls and market sellers (TSIC 56102), mobile food businesses (TSIC 56103), beverage stalls and market sellers (TSIC 56303),
and mobile beverage businesses (TSIC 56304)
6/ Calculated from the 2024 company accounts of 14,822 businesses included in the TSIC categories 56101, 56102, 56103, 56301, 56302, 56303 and 56304.
7/ For the period 2019-2024.
8/ For the period 2019-2024.
9/ For the period 2019-2024.
10/ Source: Department of Business Development. Data as of December 2025.
11/ Raw materials account for 62.9% of all costs for food and beverage service activities (source: Office of the National Economic and Social Development Council (NESDC)’s 2021 Input-Output Table, Krungsri Research).
12/ Source: thaipr.net
13/Source: Mo-Mo-Paradise (Thailand) Facebook Page


.webp.aspx)