EXECUTIVE SUMMARY
Total revenue to the digital services and software industry is forecast to grow at an average annual rate of 19.0-20.0% over 2023-2025, due to consumers’ increasing reliance on the ease and comfort provided by digital services and the post-Covid growth in mobile-based contactless payment systems. In addition, the industry will also benefit from greater investment in businesses’ digital transformation and the accelerating drive to build added value using digital technologies.
1) Digital services: Revenue will rise by 22.0-23.0%, supported by continuing growth in normal day-to-day transactions on digital platform that expand outside areas to more rural regions. Large digital service providers are increasingly partnering with other businesses to offer a more comprehensive range of services.
2) Software and software services: Revenue is expected to strengthen by 11.0-12.0% per year, driven by business transformation towards real-time big-data analytics especially on cloud service system to add value through mass customization of goods and services.
3) Digital content: Revenue growth should average 13.0-14.0%, driven by stronger performance by the gaming industry, in particular by the development of games that offer new types of experiences for greater platform engagement. The animation and character segment will enjoy a recovery thanks to stronger demand from overseas buyers from the entertainment industry, especially from growth in Over-the-Top streaming.
Krungsri Research view
During 2023-2025, overall revenue to this business has a potential to grow further for every group of segments especially for digital services business that is forecast to be a main driver of overall performance.
-
Digital services: Revenue will tend to strengthen on more intense competition between enterprises to offer platform-based services to customers, while new technology is allowing companies to develop and expand the range of services that they offer. The markets for e-retail, e-logistics, and online media e-content are now sizeable and so turnover and growth rates will be healthy for players active in these. While the e-tourism and e-health markets are still small, the reopening of Thailand will help to support faster rates of expansion.
-
Software and software services: Revenue growth will be supported by expansion in the provision of cloud-based technologies and in the greater reach of 5G networks. This, together with the use of large-scale data analytics, will then allow businesses to engage in the mass customization of goods and services. In terms of turnover, the best-performing areas will be SaaS, and software integration and customization, which will then have the consequence of boosting demand in adjacent areas in supply chains, such as software consultancy, although competition will remain intense.
-
Digital content: Revenue growth will accelerate as platform-based game developers and distributors offer gamers new experiences, boosting turnover. For players working on animation and character development, revenue will also benefit from the recovery in demand for entertainment and media in export markets.
Overview
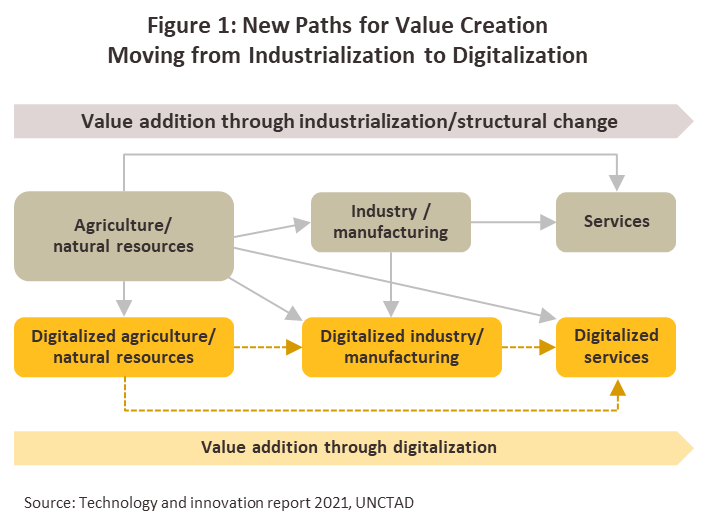
The digital services and software industry is responsible for the design of products and the offering of services that are based on digital technology. This includes the development of digital platforms and the use of these to deliver informational and other types of content to users, as well as software development and the provision of software services. This has now become a crucially important part of the value creation process towards digital economy. Indeed, the global industrial transformation is now shifting business leaders’ attention away from a focus on raising the efficiency of industrial processes to a new business model of digitalization that uses digital technology to add value to goods and services. These processes are thus tending to broaden the ways in which value-added is built into digitalized services (UNCTAD 2021, Figure 1).
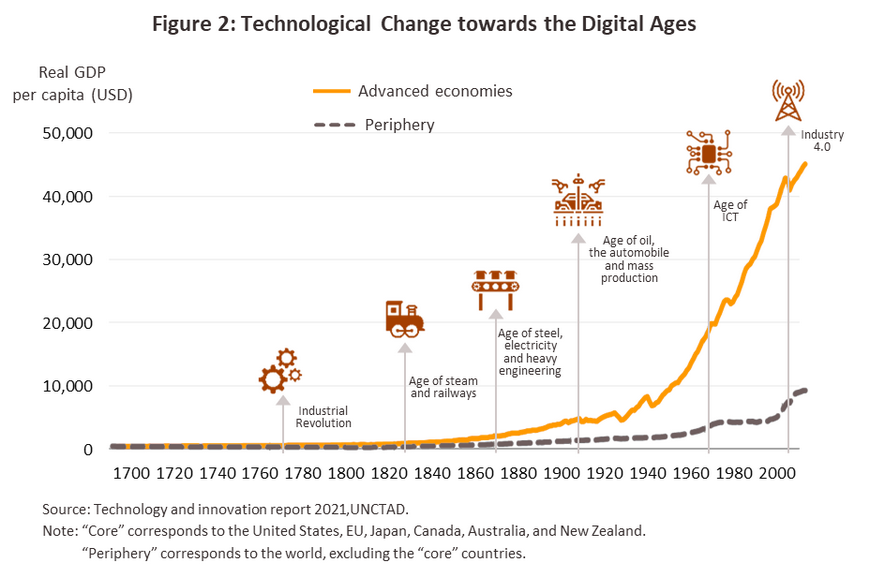
Global market: The digital industries have seen very rapid rates of growth since the start of the new millennium, with the new wave of industrial revolution to drive productivity by digital technology (Industry 4.0), following the development of information technology over the preceding 30 years. However, the majority of digital industries remain concentrated in the advanced economies of the US, Europe, and Japan, resulting in real per capita GDP racing ahead of other regions (Figure 2).
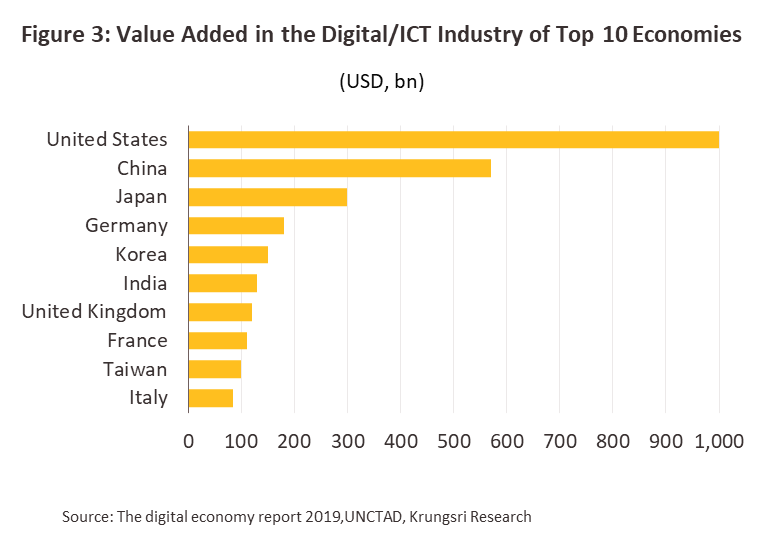
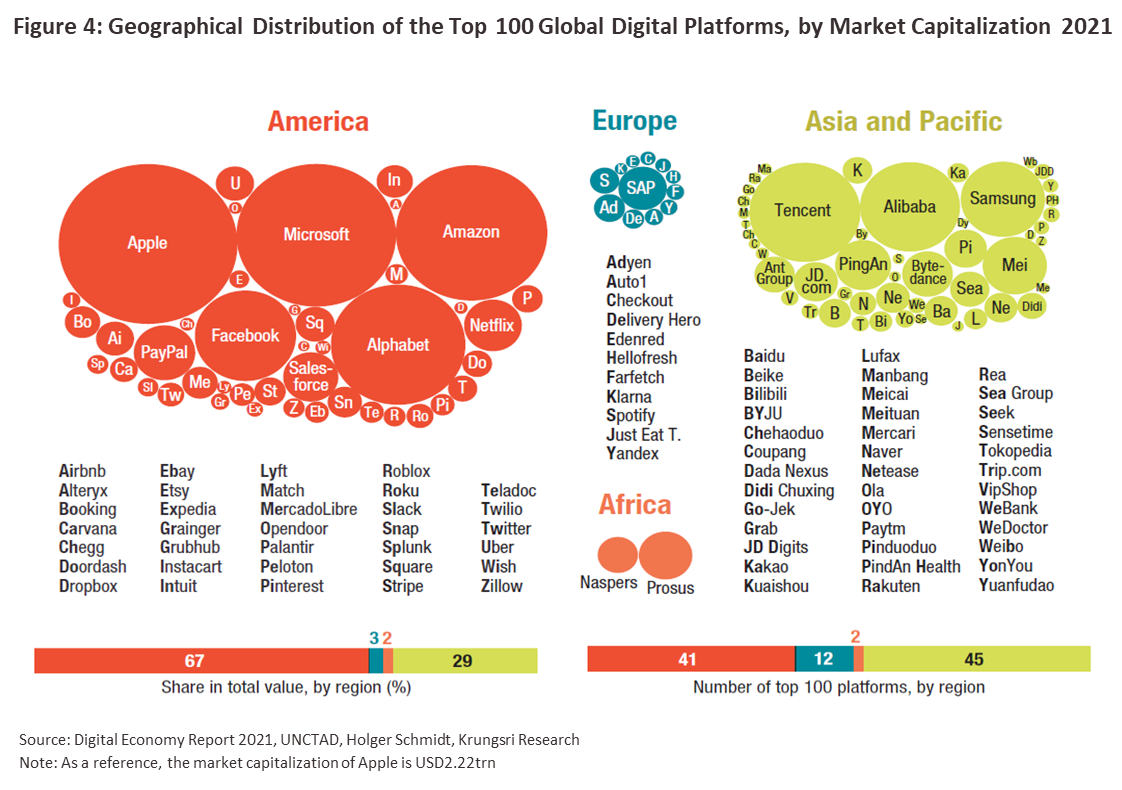
The US and China are the leaders in the digital services space, and UNCTAD’s 2021 Digital Economy Report shows that in terms of the market capitalization of transactions on digital platforms, US and Chinese companies control a combined share of almost 90%, while 94% of global funding for digital platform startups has also gone to US or Chinese companies over the past 5 years. In the US, tech companies are clustered in Silicon Valley, which is home to a huge concentration of world-leading tech giants, including Microsoft, Apple, Amazon, Facebook (Meta) and Alphabet, whereas the leading Chinese players are Tencent (Shopee, WeChat, JD.com, and JOOK), and Alibaba. The global networks that these US and Chinese corporations operate gives them access to very valuable data value chains to deliver new types of digital services and in so doing, these players generate very significant profits (figures 3-5).
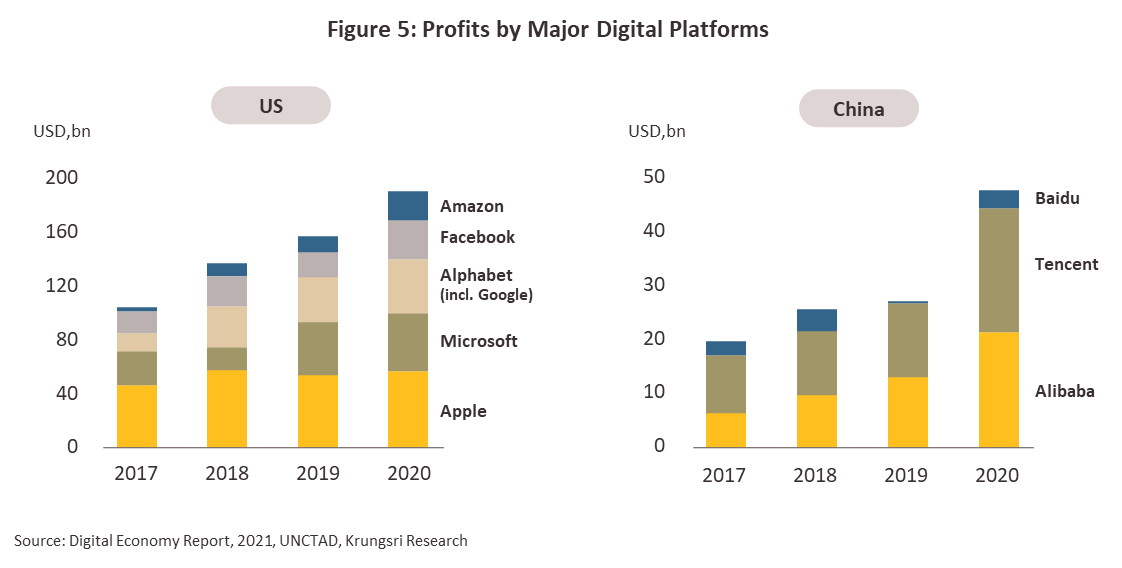
Chinese and US players saw a surge in profits during the Covid-19 pandemic (Figure 5) due to the introduction of lockdowns and the need to maintain social distancing measures. This then fed through into a much heavier demand for digital services and online transactions. Alongside this, the provision of cloud computing systems, which provide the bedrock on which systems for managing and analyzing big data are built, has also extended much wider covering developing countries, including Thailand. However, rising interest rate amid global economic slowdown during 2022-2023 are challenging factors for startups’ financial costs and capability of funding to develop new technology, especially for VC-based companies, following the collapse of Silicon Valley Bank (with 37,000 startup customers, source: The National Venture Capital Association, US, 2023) in March 2023.
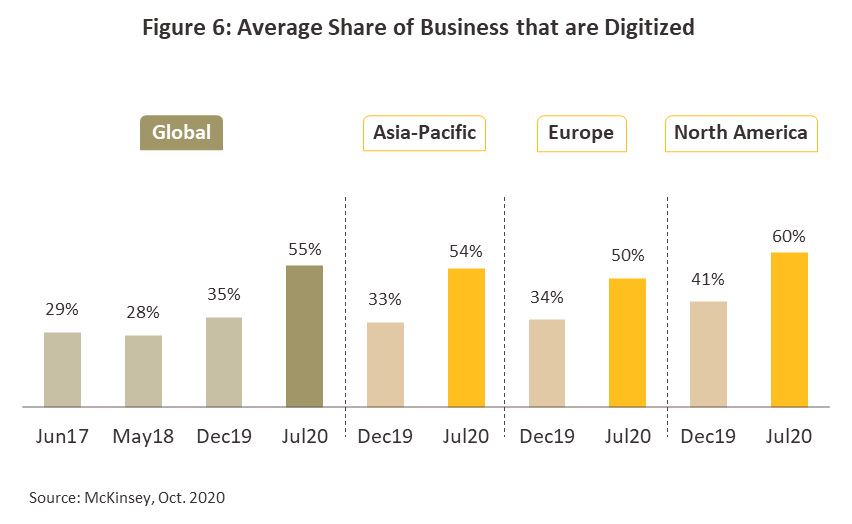
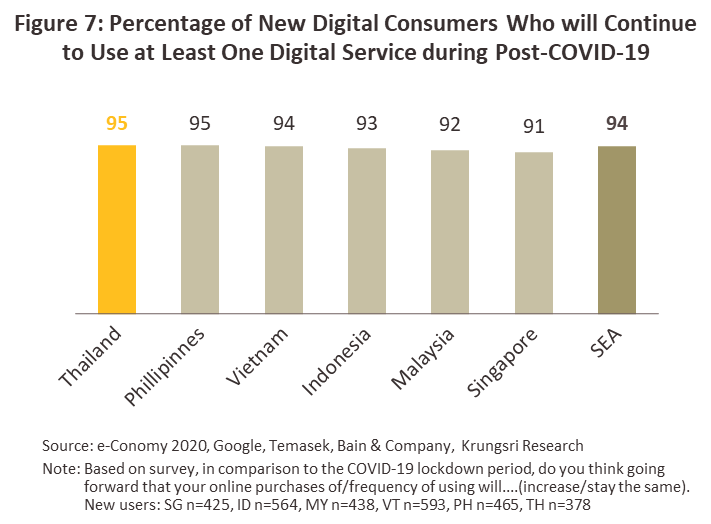
The global Covid-19 pandemic vastly accelerated the development of the digital services industries, and this is reflected in a survey by McKinsey that looked into how 900 companies have adjusted their business practices. The findings show that the proportion of businesses digitizing their activities rose from 35% at the end of 2019 to 55% in 2020 to serve the ‘new normal’ of digital service adoption in personal and business life (Figure 6). McKinsey believes that global investment in the digitalization of businesses will continue to increase through 2021-2027. This view is backed up by the e-Conomy 2020 report from Google, Temasek, and Bain & Company. This investigated 6 countries in Southeast Asia (Figure 7), and the report demonstrates that 95% of Thai digital service consumers planned to use digital platforms post-Covid (Figure 9).
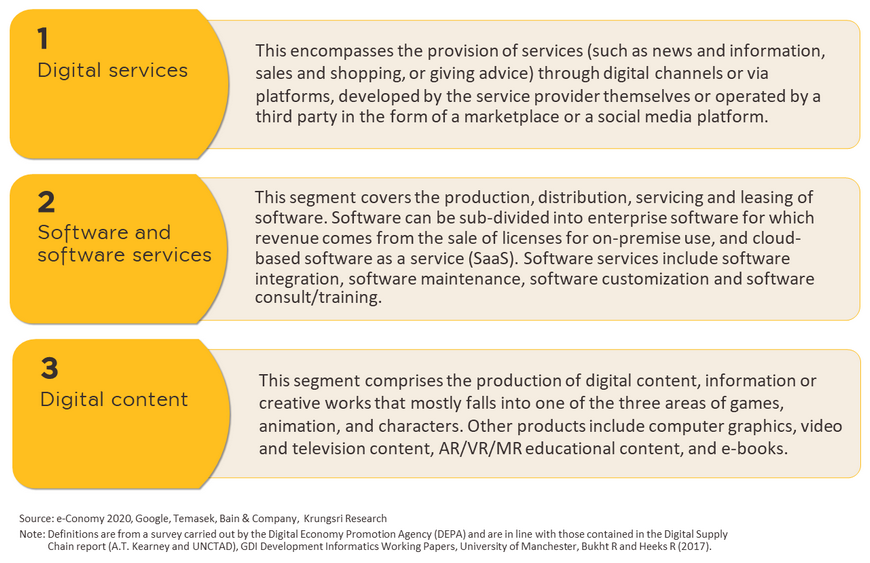
Domestic market: The Thai software and digital services sector may be divided into three main segments.
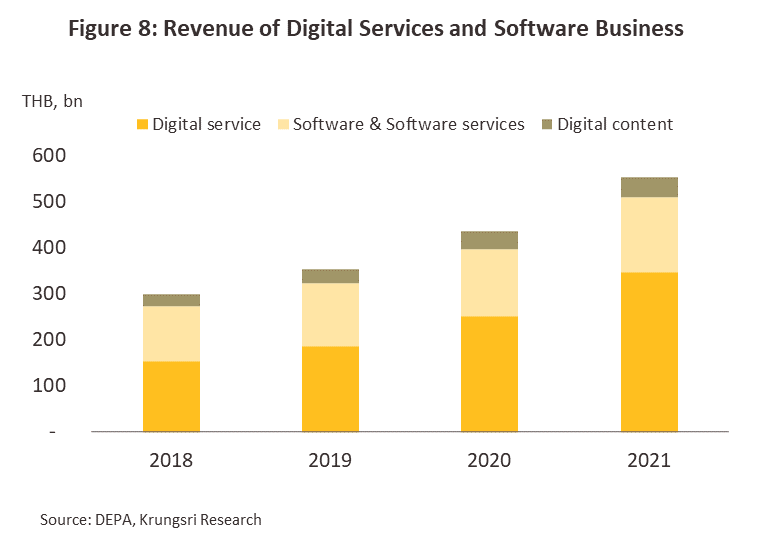
The domestic market for software and digital services had an annual average value of around THB 440 billion between 2019 and 2021 (Figure 8), though digital services alone counted for over half of the market (an average of 60%), followed by software design and services (30%), and digital content (10%). On the supply side, at 95%, almost all players in the domestic software and digital services industry are Thai, though the most competitive companies are the few large players, which are often overseas operations that can develop and exploit the latest technology. These players are also the most innovative and so they can adjust their business operations as digital technology quickly evolves. Overall, the industry is very heavily oriented towards the domestic market and so this is the source of over 90% of revenue. There is, however, some potential for exports of digital content, though this is generally for design work produced on contract (source: Trade Policy and Strategy Office, Ministry of Commerce, TPSO, MOC, and DEPA).
The digital services segment can be subdivided into the following:
1) Online media is split between: (i) online content providers, including news or books (e.g., Ookbee), restaurant reviews (e.g., Wongnai), and webboards (e.g., Pantip.com), as well as online newspapers; and (ii) providers of online entertainment and media (e.g., iFlix).
2) E-retailers operate online stores or platforms that intermediate between buyers and sellers. This includes marketplaces, websites, applications, and social media, such as Lazada, Shopee, and JD Commerce.
3) E-logistics and food delivery apps operate as middlemen to deliver goods or food to end-users. Examples include Kerry, Flash, J&T, Ninja, Line Man, Grab, and Robinhood.
4) E-tourism operators intermediate between travelers and hotel operators. Examples include Agoda, Booking.com, and Traveloka.
5) E-advertising covers online advertising delivered through websites (e.g., Google Adverse and Google Adsense) and through social media, such as Facebook, Instagram, and TikTok. Players in this space include IPG Media and iTOPPlus.
6) Fintech players use tech innovations to develop financial products. This segment includes startups involved in InsurTech, e-wallets, and payment gateways.
7) HealthTech players also act as platform-based middlemen (e.g., Arincare and Diamate).
8) EdTech players use new technology to develop novel learning experiences at all levels of ability, including the use of platform-based skills development. Examples include OpenDurian, Conicle, and Globis.
These businesses use digital channels as their principal means of delivering goods or services, for which they then charge a fee. Setting up in this sector may involve significant initial investments, but growth has been supported in recent years by: (i) the continuing development of digital technology, such as AI and the blockchain, which has helped support the emergence of social platforms that are then delivering online content through a proliferating range of new channels; (ii) the spread of 5G networks and the availability of ever-more powerful smartphones, which is feeding growing uptake of digital services; (iii) the 2018 waiving of fees for online payments and the subsequent growth in demand for mobile payment services; (iv) the introduction of new regulations in 2019 governing the operation of peer-to-peer lending platforms, which then helped strengthen the market for P2P lending and fintech; and (v) changes in consumer behavior towards online day-to-day activities, served by smartphones as a ubiquitous feature of modern life.
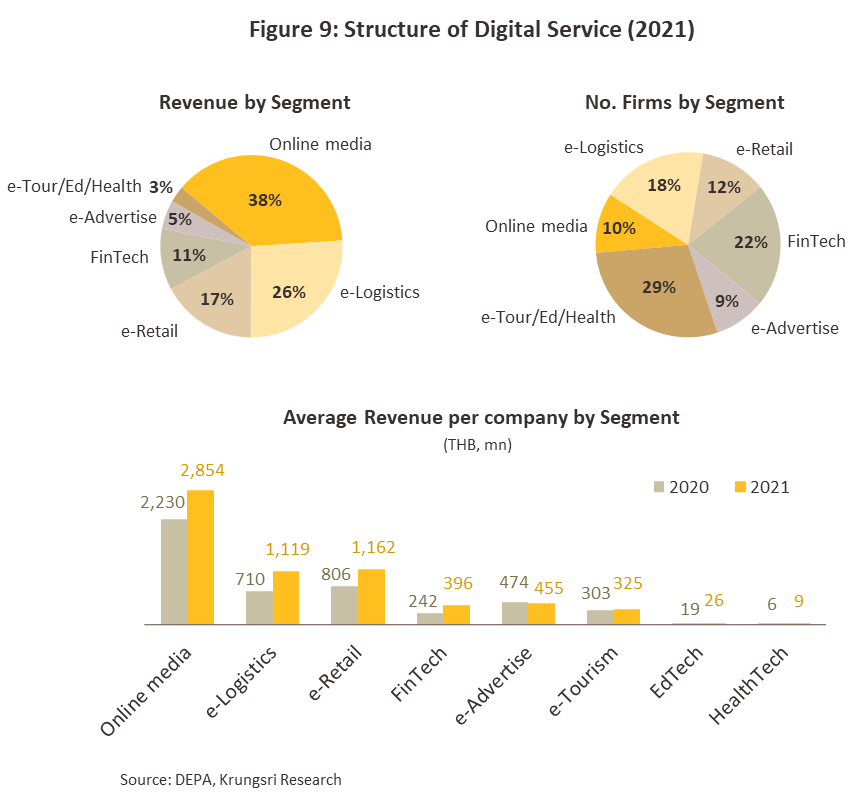
Over 80% of the market value of the digital services segment comes from online media, e-logistics, and e-retail, but over half of players are active in other areas, including e-tours, edtech, health and fintech (correct as of 2021). On average, the online media market provides the highest returns to companies as it is a creative industry and that products are distributed through social media, which adds significant added value, while in addition, the market is dominated by a few large players. By contrast, although the markets for fintech and some other digital services are growing rapidly, supply is crowded and as such, competition is stiff and average company revenue is relatively low (Figure 9).
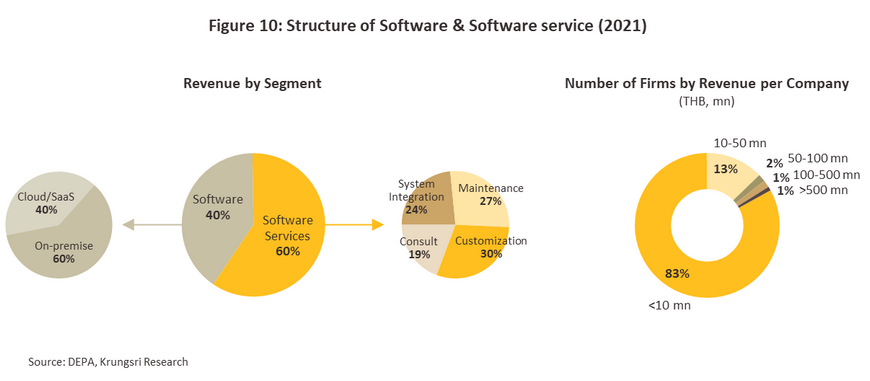
Software and software services generally operate according to one of two revenue-generating models. (i) Software may be licensed for installation on networks for on-premise use with no need for internet access. This type of software therefore does not need access to the internet to operate, and revenue comes from the sale or lease of software licenses. (ii) Cloud-based software is generally hosted by the developer and distributed as ‘Software as a Service’ (SaaS), via the internet (e.g., Microsoft Office365 and Google Drive). SaaS revenue is usually generated from monthly or yearly subscriptions. Software services are typically one of four main types, as described below.
1) Software system integration (SI) involves developing or integrating software or related systems.
2) Software maintenance where service providers source, install, maintain, and upgrade software for their clients.
3) Software customization involves the design and development of custom-made software that clients hire to produce for a particular goal, and clients will own the copyright of completed works.
4) Software consultancy/training operations provide advice and training program on software system.
Revenue for players in the software and software services segment comes from the design, development, distribution, servicing, and leasing of software products together with the provision of ancillary services. Overall, the market has been growing with the trend for digital transformation as companies adopt more advanced tools to assist with complex tasks such as data analytics. The business model is moving from one where end-users buy licenses to one where users rent or pay subscription fees for access to SaaS or software-enabled services that are more dependent on the use of the developer’s own intellectual property. Thus, as of 2021, 39.7% of all revenue to software companies came from cloud-based service delivery, up from 35.9% a year earlier (DEPA, 2022). This allows small businesses to gain access to a wider range of services.
Over 60% of all revenue to the software and software services industry comes from software customization, much of which is in the form of the design of embedded software that makes use of developers’ intellectual property to add value to the design process. This is followed in importance by software maintenance and development, and system integration. Players in this market benefit from its size and the ongoing need of private-sector players to compete through investment in their digital transformation. As of 2021, these three segments accounted for more than 80% of the total domestic software market, though over 80% of players in this space are SMEs. Given the latter, competition tends to be intense, and the average turnover is less than THB 10 million annually, with most companies generating revenue from web design and software consultancy (Figure 10).
Digital content covers the delivery of content and creative media through digital channels. Within this category, there are three subgroups.
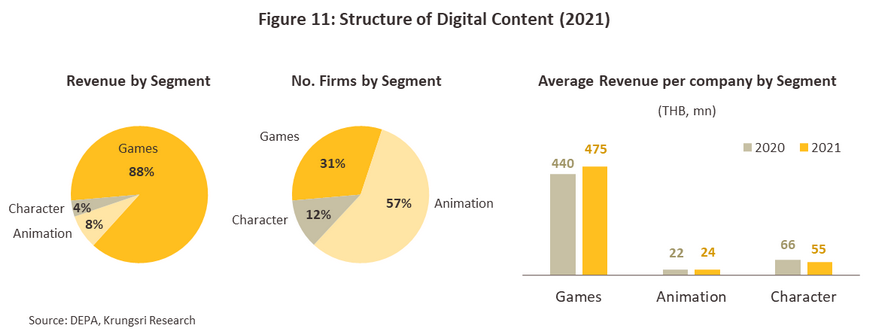
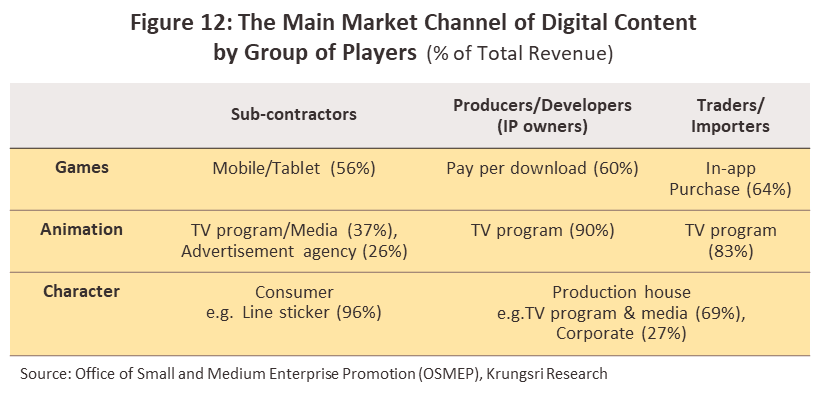
1) Games: Suppliers to the markets for games include all types of businesses, from large through small to individual freelancers. Despite a large number of players in the market, by market value, 96% of these are importers and distributors of games. At present, there is only a limited number of game developers who own copyright because developing new products requires significant investment in both software development and marketing[1]. Online games imported into Thailand are mostly from copyright holders in South Korea, China, and Taiwan (around 80% of the total).
2) Animation: This covers all types of animation, including animated feature films, TV series, mobile content, visual effects, etc. Most often, this work is carried out on contract (over half of all revenue), though work may be ongoing (e.g., for a series) or for one-off technical contracts. Independent contractors, holders of intellectual property rights, and importers all tend to depend on distribution via television or advertising.
3) Characters: This describes the market for illustrators and designers who develop characters for distribution as digital products or animations. Over 90% of the market value is accounted for by importers, distributors, and copyright holders (source: TPSO, MOC), with the remainder going to designers who hold their own copyright. Sales channels (e.g., Line Sticker) are open to small, independent operators, who may also work on contract for other businesses.
These players have benefited strongly from the growth of social media and the development of digital technology. Revenue comes from contract and design fees and the purchase of distribution rights, but only around 20% of players are also copyright holders.
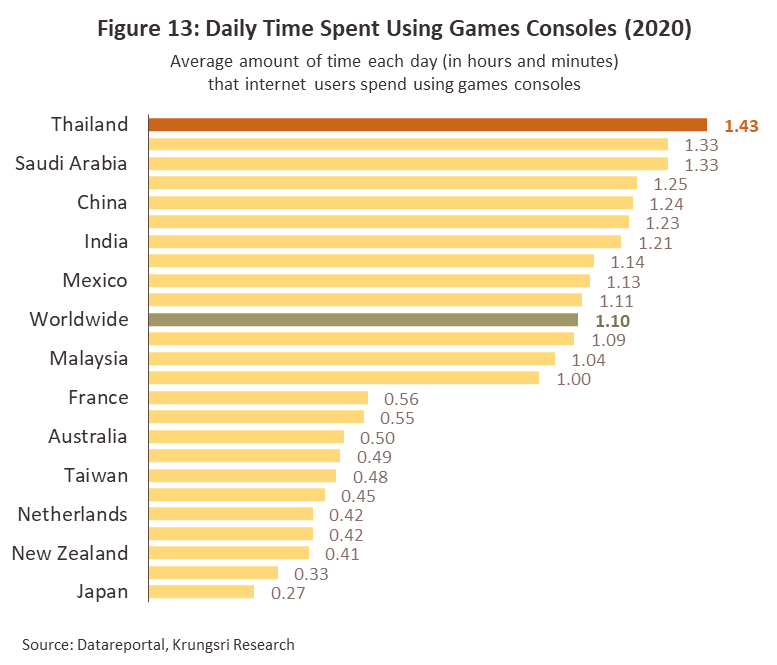
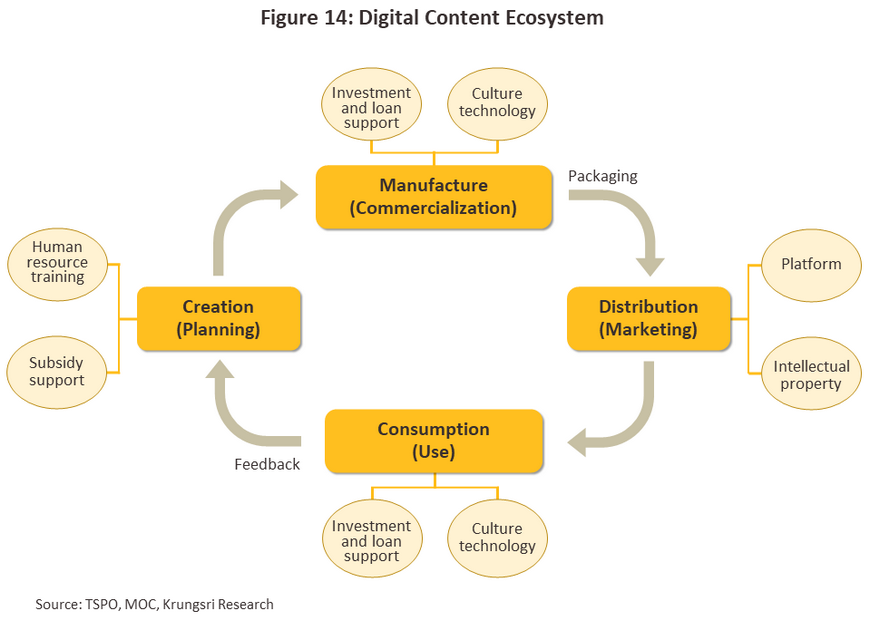
Players in the Thai digital content market tend to be small, so their ability to sell into export markets is generally somewhat limited. Their products are therefore usually relatively unknown at the global level and instead, they focus their efforts on the domestic market (source: TPSO, MOC). However, some larger players are contracted to produce products for international clients (generally in the US, Japan, and China). The business has a growth potential to serve the trend in developed economies to increasingly outsource creative work. Domestically, the market is benefitting from the growing number of people playing games online, the official recognition of e-sports, and the ever-larger uptake of streaming services delivered to mobiles and tablets. Thanks to the large amount of time Thais devote to online games relative to other countries (Figure 13), almost 90% of the value of the market for digital content comes from the games segment. The latter also reports the highest levels of revenue per company, although it is also the most crowded. Games are followed in importance by ‘character’ businesses, a high-value creative industry, with average company revenue lowest for animation. This segment is marked by the large number of suppliers, most of which are SMEs or contractors (figures 11-14).

The important driving agencies: The public sector has a significant role to play in driving the development of the Thai software and digital industries, especially now that the rapid growth in digital technology is pushing the world into the era of Industry 4.0. However, many obstacles in Thailand need to be overcome, and the authorities have developed several policies under the banner ‘Digital Thailand’, including the 2017 Act on Digital Development for the Economy and Society and the establishment of the Office of the National Digital Economy and Society Commission to accelerate the development of the digital transformation of the public and private sectors as described below (Figure 15).
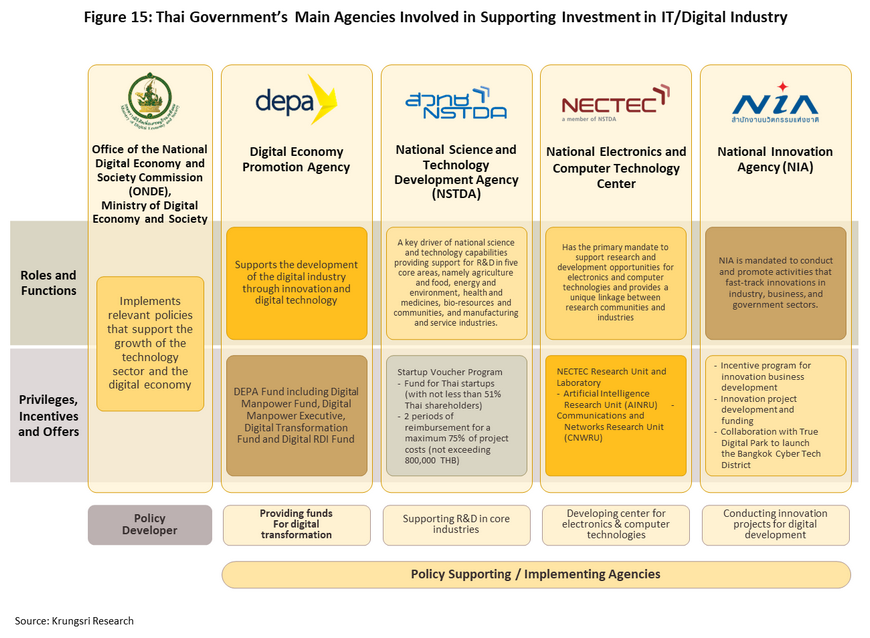
1) The Office of the National Digital Economy and Society Commission (ONDE) operates under the Ministry of Digital Economy and Society and is the main state body responsible for policy development in this area. ONDE is charged with managing the national master plan for the digital economy, in both its general and particular aspects, emphasizing the need to upgrade national infrastructure, create a supportive digital ecosystem, and use digital technology to underpin economic development (e.g., through the creation of e-commerce platforms, smart cities, and the support for R&D in the digital industries).
2) Policy-supporting/implementing agencies include the following:
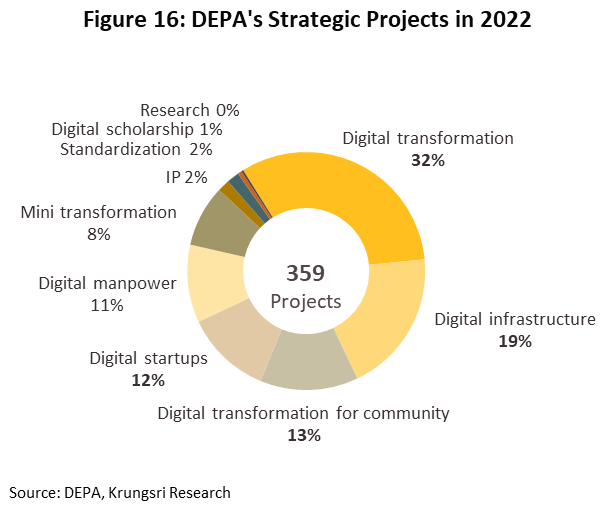
2.1 The Digital Economy Promotion Agency (DEPA) is also under the control of the Ministry of Digital Economy and Society. DEPA is the main agency responsible for implementing government policy with regard to the digital industries, focusing on the development of digital skills, cultivating startups, and scaling-up them to full commercial profitability. As of 2022, over half of all support has been directed at digital transformation and digital infrastructure (Figure 16).
2.2 Supporting agencies under the Ministry of Science and Technology: the National Science and Technology Development Agency (NSTDA), the National Electronics and Computer Technology Center (NECTEC), and the National Innovation Agency (NIA). These help with research and development in each’s target industries. Thus, the NSTDA is focused on the five areas of agriculture and food, energy and the environment, health and medicines, bio-resources and communities, and manufacturing and service industries, while NECTEC concentrates on electronics and computers.
2.3 Other agencies include the Board of Investment (BOI). By offering 5- to 8-year exemptions for corporate tax and waivers for duties on the import of machinery and parts, the BOI promotes investment in digital businesses (including the development of digital technology, software, digital services and digital infrastructure) that are part of the ‘new S-curve’ industries and that use advanced technology or that are based on new innovations (the A1-A3 industries).
Situation
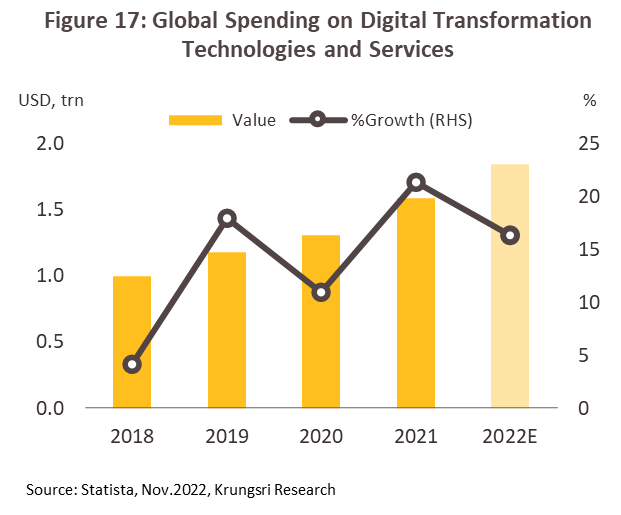
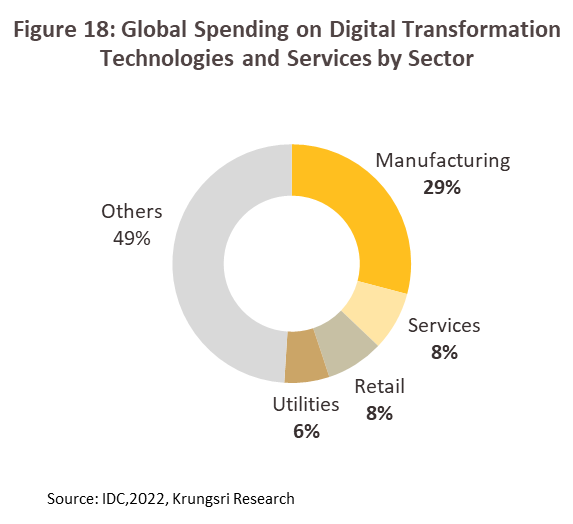
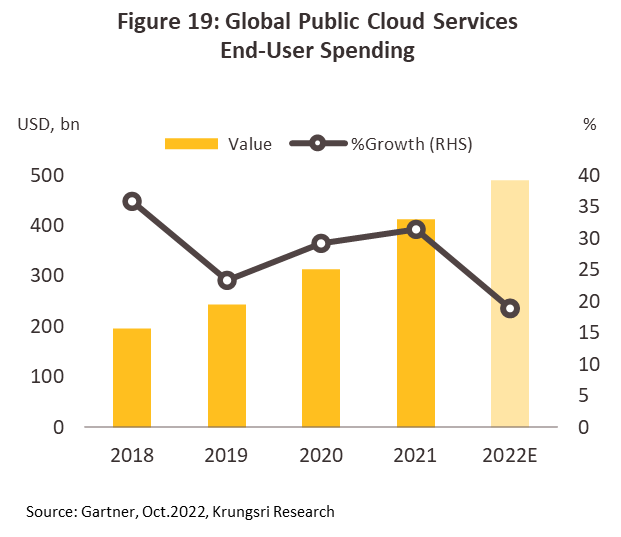
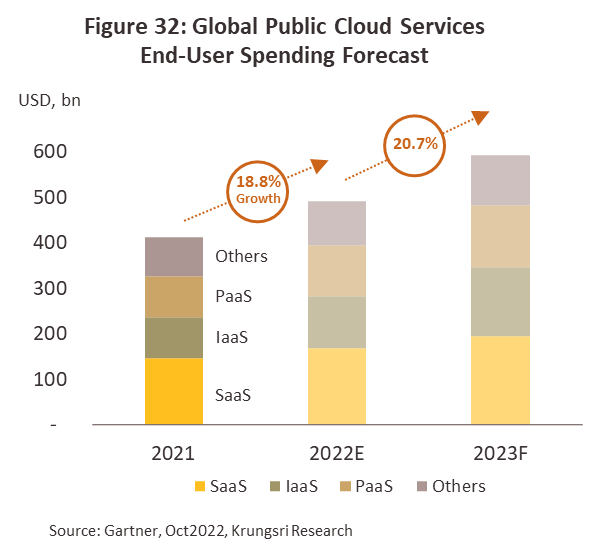
Global market: Spending on digital transformation technologies and services grew by 21.4% in 2021, with this expected to have risen by another 16.4% in 2022 to give a total value of around USD 1.9 trillion (Figure 17). 35% of this expenditure was made by US companies, followed in importance by Europe and China. By economic sector, manufacturing occupied almost 30% share of the total, followed by services, retail, and finance (Figure 18). Demand for software services is being driven by continuing competition between leading companies across the economy, to use digital technology to transform customers’ online experience and develop value creation. This typically depends on big data analytics to provide real time insights into consumer demand, which in turn requires investment in the cloud-based infrastructure
[2] that underpins the development and delivery of software as a service and other types of digital platforms. Given this, spending on cloud technology is expected to climb 18.8% in 2022, rising to USD 490.3 billion from USD 412.4 billion in 2021
(Figure 19).
Domestic market: Revenue to the domestic software and software services industry jumped 23.8% in 2022, having already increased 26.8% in 2021 (Figure 20). As at the international level, demand is being driven by the leveraging of digital transformation as a tool for establishing competitive advantage and by the unfolding of global megatrends. Support has also come from the government, which has introduced tax measures that encourage businesses to take advantage of cloud- or IoT-enabled data analytics software. Moreover, the extension of 5G networks is boosting demand for digital communication services in day-to-day life. This process has been further accelerated by the Covid-19 pandemic and the transition to what has been called the ‘new normal’ of maintaining social distancing that made much greater use of digital platform. By both market size and rate of growth, the leading drivers of the domestic market are digital services, followed by software development and then digital content providers. The situation for each is described below.
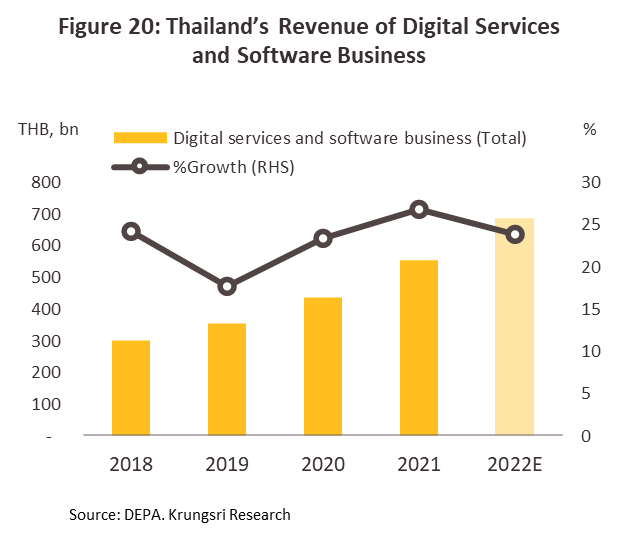
Digital services: Revenue jumped 31.0% in 2022 (compared to growth of 37.8% in 2021) thanks to positive impacts on both the demand and supply sides of the market.
-
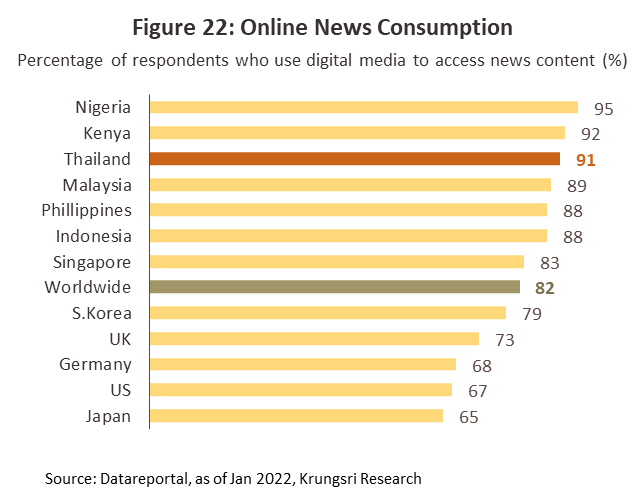
Demand: With easier access to the internet, both consumers and businesses are accelerating their uptake of and reliance on digital technology. This is then feeding greater demand for big data analytics and for more complex services, as is reflected in the following:
1) Compared to a world average of 82%, 91% of Thai consumers read the news via online sources, the 3rd highest rate in the world (Figure 22).
2) At 0.22%, the share of Thai consumers’ spending via mobile phone apps to GDP is the 6th highest in the world and compares to a global average of 0.20% (Figure 23) (source: Datareportal, January 2022).
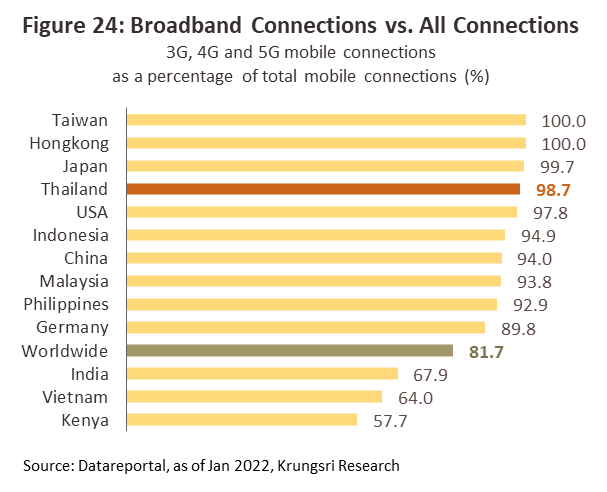
- Supply: Thailand benefits from its relatively advanced digital infrastructure and its use of smart connection systems to manage high density services. Against a world average of 81.7%, 98.7% of Thailand’s mobile phone network provides access to 3G-5G services (correct as of 2021) (Figure 24), and this is then accelerating the development of online platforms to offer a wide range of services.
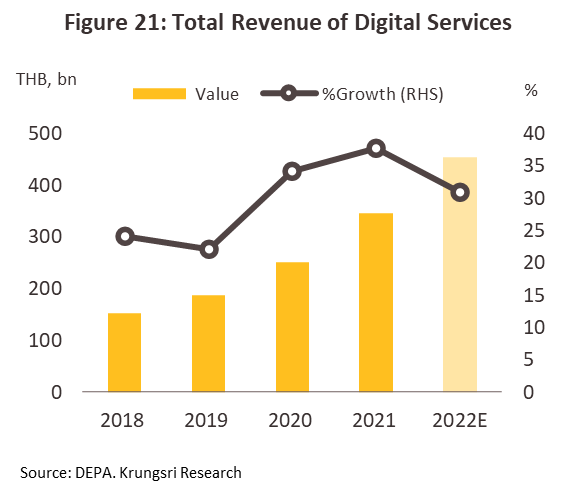
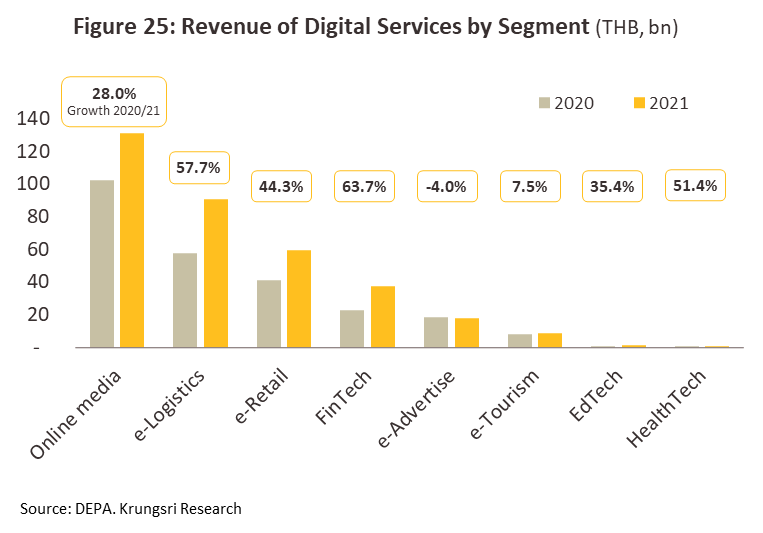
Within the general category of digital businesses, online media had the highest overall revenue of all sub-groups in 2021 (the most recent data available) (Figure 25) and enjoyed growth of 28.0% in the year. Players in this market benefit from offering online news and information services as well as from providing entertainment services, for which consumer demand is steadily building. E-logistics and e-retail were the next most important industries. Growth in these markets is coming from competition between large, foreign-owned e-marketplace platforms (e.g., Lazada Express and Shopee Express), which are using e-logistics to develop comprehensive e-delivery systems. In addition, Thai players such as CP All’s ShopAt24 have also enjoyed a steady expansion in their revenue base (Pay Solutions, January 2023). However, in terms of revenue growth, the fintech industry is the most vibrant segment. Fintech solution providers are benefitting from changes in consumer behavior, especially among the young, that are encouraging greater uptake of financial apps, further catalyzed by the Covid-19 pandemic. However, the large number of players in the fintech market means that competition is stiff and so in 2022, as the country reopened, tourists began to return, and economic activity started to pick up again, online media, e-logistics, and e-retail remained the primary drivers of growth for this segment.
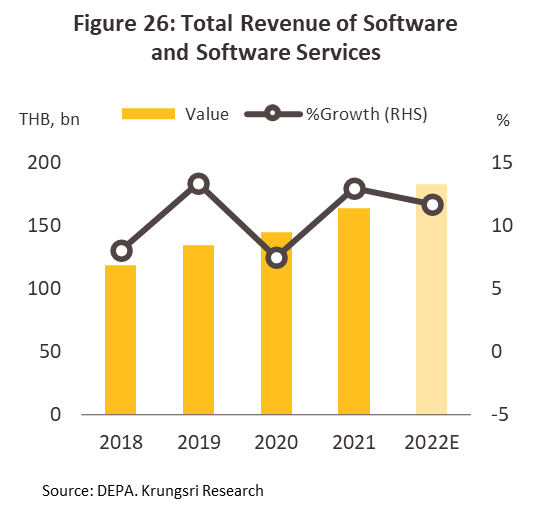
Software and software services: Revenue rose 11.7% in 2022 (down slightly from 2021’s 13.0%) as businesses made the necessary investments in the development of IT and software systems needed to adapt successfully to the post-Covid environment, to respond to demand for mass customization, and to offer comprehensive after-sales services. Likewise, many government bodies are also shifting their operations to the cloud as a way of improving the quality of their services, while many organizations are moving to the use of cloud-based SaaS, in particular for data management and end-point protection. PwC Thailand thus estimates that as of 2022, over 50% of Thai companies were using cloud services, with the hybrid cloud particularly popular since this facilitates flexible and remote working while maintaining data security.
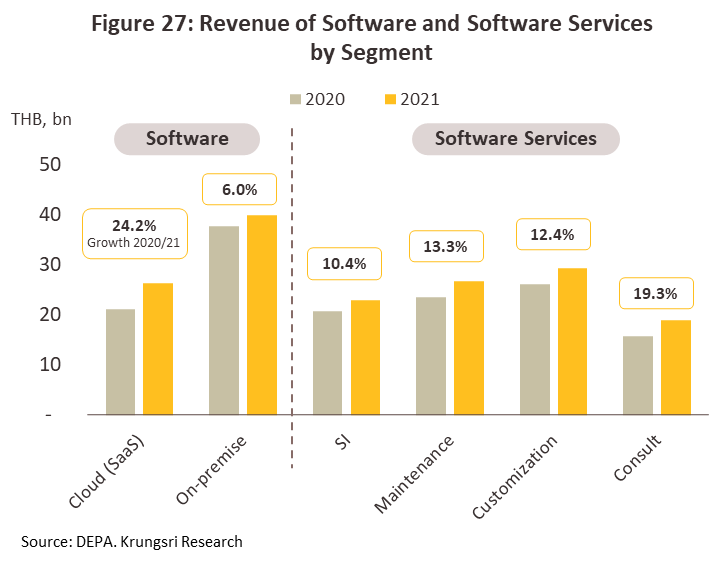
Within the software segment, although less than 50% of revenue was generated by SaaS in 2021 (Figure 27), this grew by 24.2% in the year. Demand is strengthening on companies’ rising need for data analytic capabilities, while on the supply side, the extension of 5G networks is also helping. By comparison, on-premise licensed software still occupies a larger market share, but this grew by just 6.0%.
All parts of the software services segment enjoyed growth in excess of 10.0%, though the consultancy market stood out with a growth rate of 19.3%, while around 30% of total revenue for the provision of software services came from the design and development of customized software. Demand was most clearly driven by companies engaging in internal reorganization as they move to cloud-based data management and the use of software to identify potential new customers, especially through online channels, with these insights then providing the basis for the development of new products. Growth in revenue from system integration services was boosted by an increase in the number of SMEs looking to build competitiveness by improving their organizational management. These currents were then strengthened by government policy, specifically by the offering of tax breaks over 2021 and 2022 that allowed SMEs to reclaim twice their expenditure on software and software services (up to a maximum of THB 100,000). Over 2022, system integration and software customization were thus the main drivers of growth in the software services segment.
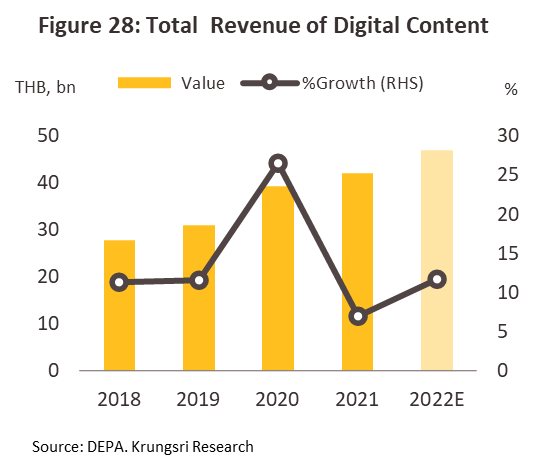
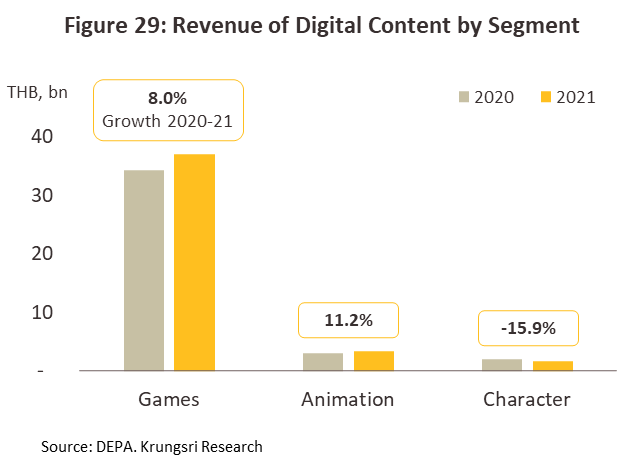
Digital content: Revenue was up 11.6% in 2022, which marked an improvement on 2021’s 6.9% growth. Turnover was overwhelmingly (around 80%) from online games, sales of which were lifted on the demand side by shifts in consumer behavior that now favor building widespread online communities among individuals who may be geographically dispersed but who share similar interests. Statista also estimates that the number of Thai online gamers increased by 6.0% in 2022. The following factors also had an impact on the supply side of the market.
1) Connecting gameplay to social media platforms and introducing new technology into game design (e.g., AI, AR/VR and blockchains) to provide players with richer playing experiences.
2) Developers have adapted their business models of ‘gaming as a service’ (GaaS), which encourages more in-game purchases.
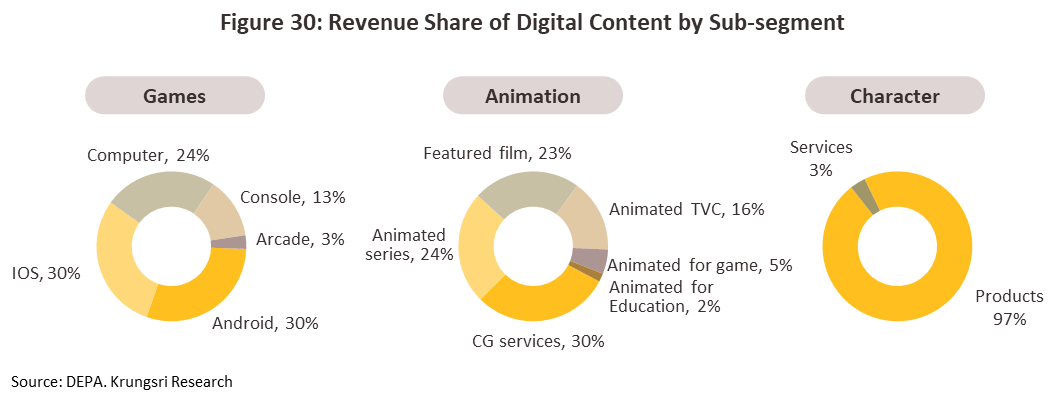
3) The rollout of 5G networks has made it easier to deploy games to Android and iOS platforms (together the source of around 60% of revenue from games) (Figure 30).
Growth in the animation and character markets has been somewhat sluggish because Thai players generally work on contract for Chinese and Japanese companies, where purchasing power and economic activity is still struggling to fully recover from the pandemic. Likewise, the domestic market is in a state of transition, with distribution moving from TV channels that show animation to platform OTT distribution. However, content remains somewhat thin on the latter.
Outlook
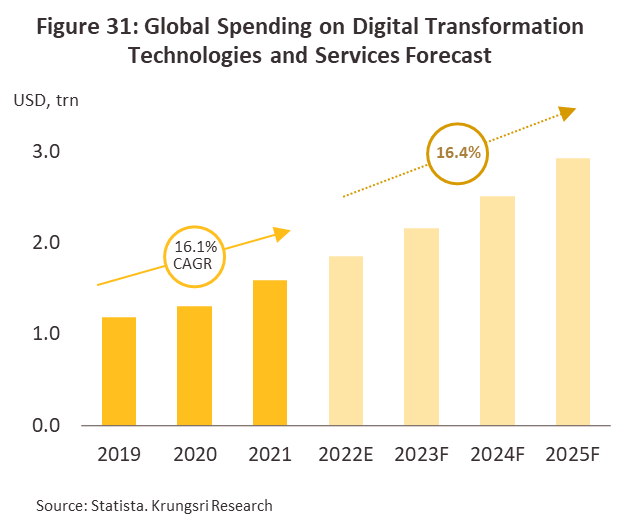
Global market: Going forward, companies will continue to use new technology to build novel consumer experiences, and this will drive global spending on digital services, with Statista Research seeing this expanding by 16.4% annually over 2023-2025 (Figure 31). This will be matched by growth in investment in cloud infrastructure around the world as operators look to meet still-strong demand for real-time big data management and analytics services, especially in sales and the marketing and promotion of new products and services through digital platforms in the post-Covid environment. Gartner thus sees global spending on cloud services expanding by 20.7% in 2023, up slightly from 2022’s already strong growth of 18.8% (Figure 32), and this will help major cloud SaaS providers, including Amazon Web Services (AWS), Microsoft Azure and Google Cloud Platform (GCP), gain access to enterprise-level customers around the world. This will drive greater spending on software, and IDC (2022) sees purchases of enterprise-level SaaS software accounting for 80% of the total corporate spend on software by 2030, up from 30% in 2022. This will then drive more business to players in software and software services around the world.
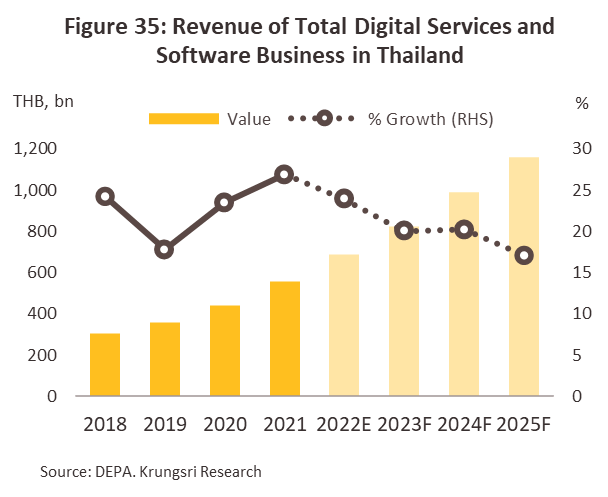
Domestic market: Overall revenue to the digital services and software business is forecast to grow at an average rate of 19.0-20.0% over the three years during 2023 and 2025 (Figure 35), driven by the post-Covid rise in consumer demand for simple-to-use contactless mobile-based transaction services, as well as by the continuing need for businesses to add value through a process of internal change by investing in digital technology.
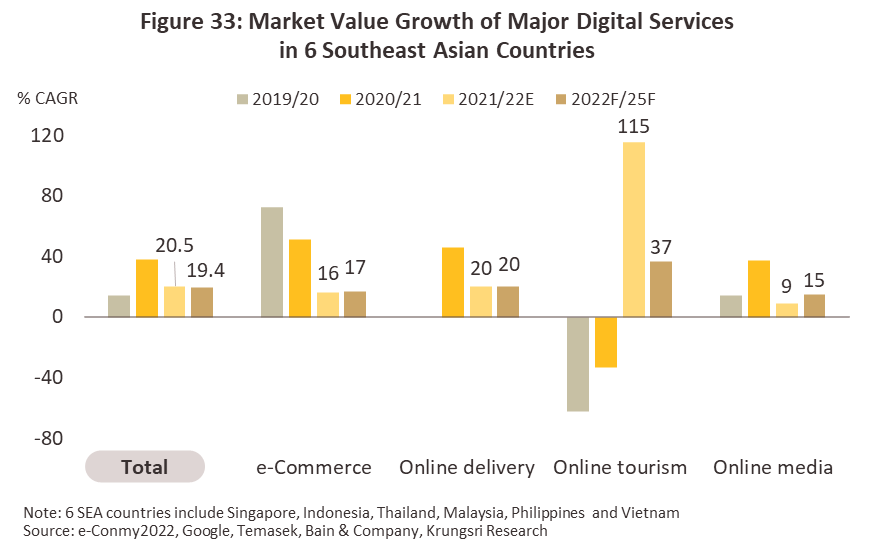
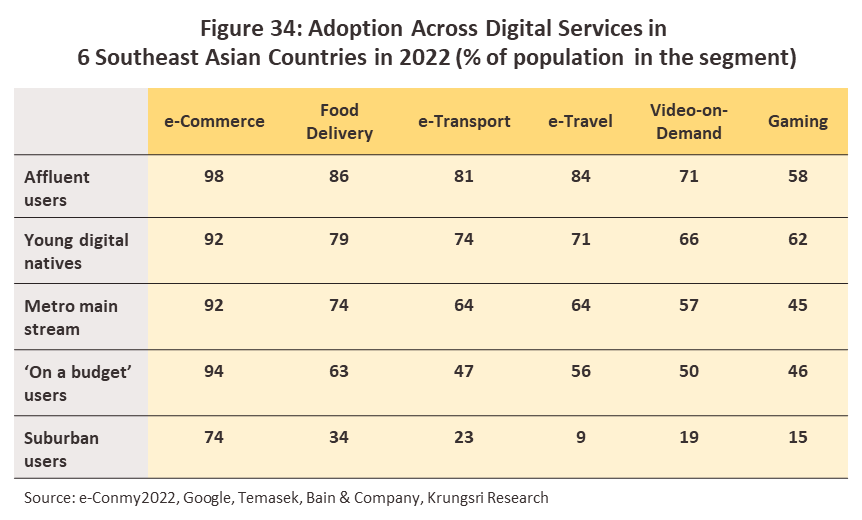
1) Consumers are increasingly reliant on the use of digital platforms to complete normal day-to-day activities, in line with the value of the ASEAN market that all segments of digital services have the potential to grow outside urban areas to more rural regions, especially in e-commerce, transport, tourism, and online entertainment (Figure 33 and 34).
2) Operators are using advances in technology to develop new digital platforms to enter the market for on-demand commerce. For example, Grab has now expanded from its core business areas of food delivery and ride-hailing with Grab Mart (an on-demand grocery delivery service) and Grab Home Services (an on-demand home cleaning service).
3) Large digital service providers are increasingly partnering with other businesses to offer a more comprehensive range of services. For example, the Lineman-Wongnai partnership now offers combined ride-hailing and food delivery services.
Growth in digital services will largely be driven by businesses connected to online trade and transport supply chains, such as e-retail, e-logistics and e-content delivered through online media. These are all large and expanding markets, partly thanks to the fact that these are often accessed via mobile and mobile engagement rates are high, in particular for using apps to make payments, check information and consume content. These trends will be accelerated by the development of the metaverse, which as a social platform will extend the capabilities of social media, that should deliver virtual experiences to customers and to present new products. By contrast, the market for e-tourism remains weak at the moment, though the reopening of the country and the rapid recovery in the tourism sector will feed through into higher rates of growth, while the e-health market will also benefit from its links to medical tourism supply chains.
-
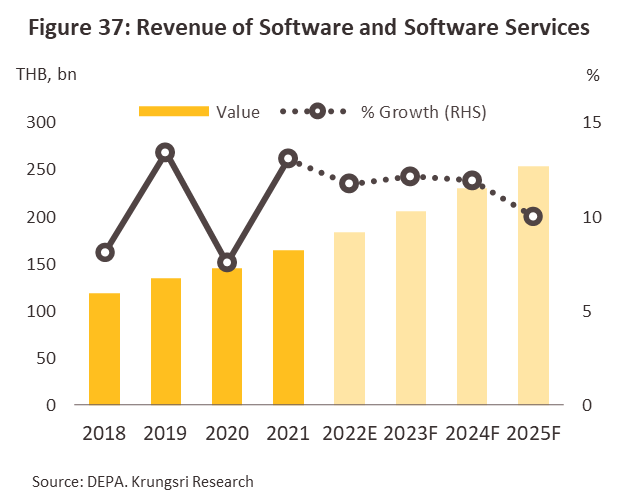
Software and software services: Revenue should expand by an average of 11.0-12.0% per year over 2023-2025 (Figure 37) as spending on software rises. Gartner (2023) predicts that in 2023, the value of the domestic markets for software and IT services will rise by respectively 14.9% and 10.4% on greater expenditure by regional-level enterprises. This will in turn be driven by the following:
1) Competition to add value through mass customization of goods and services will intensify, and this will add to demand for access to real-time data analytics.
2) Accessing data processing technologies through a subscription model, or SaaS, is generally cheaper than following more traditional models of software licensing that involve local installation thanks to the spread of cloud-based systems and the rollout of 5G networks that help facilitate organizations’ digital transformation.
3) World leaders in the provision of cloud technology, including Google Cloud and Amazon Web Services (AWS), are planning to invest and open regional data centers in Thailand during 2023-2024, and once Thai companies have full access to modern cloud technology, the speed of their data analytics operations could increase by as much as ten-fold.
Growth in demand for software and software services will largely be driven by expansion in the markets for SaaS, software integration (SI), and software customization. Many organizations are looking to build an IT and data foundation that will allow them to be more flexible in how they support different apps, and so they are currently engaged in a process of integrating legacy data with SaaS systems with the goal of improving their real-time data analytics capabilities. This is then boosting demand for the installation of new software, and especially for the design of custom-made programs that meet the specific needs of individual organizations. Growth in these services will have the additional consequence of lifting demand for adjacent services, such as consultancy and training, though at the same time, competition will stiffen, especially for design shops offering services such as general webpage design, where the market is crowded and a large number of SMEs jostle for limited space.
-
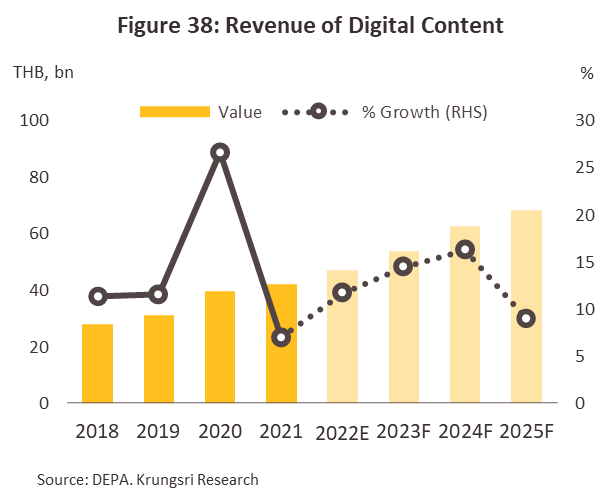
Digital content: Over 2023-2025, revenue is expected to rise by 13.0-14.0% annually (Figure 38). This will be due principally to growth in the gaming market, where players will benefit from the following:
1) Games are being developed using new technology such as the blockchain, to offer gamers new experiences. In addition, AR/VR and the metaverse are being used to build virtual worlds for gamers to explore and within this ecosystem, players will be able to make full use of different game-related items.
2) New gaming models focus on the expansion of gamers’ networks as a way of extending the overall userbase.
3) Growth in e-sports is being supported by government policy, such as the e-sport online academy and the e-sport acceleration program.
The animation and character segments can also look forward to stronger performance as demand for media services improves in export markets including Japan, China, the US, South Korea, and Europe, especially during 2024-2025 to meet growing demand for material for Over-the-Top (OTT) platform-based streaming, which will firm up in line with stronger consumer spending power.
[1] Thai games developers will invest an average of around THB 100-200 million in development and a further THB 50-100 million in marketing per game. Leading global developers often invest at least THB 1 billion in the games that they produce (source: Thai Game Software Industry Association).
[2] Growth in spending on cloud systems is an important proxy for the extent of enterprise digitalization.


.webp.aspx)