EXECUTIVE SUMMARY
In 2026, the rental retail market is expected to face continued pressure from weakening domestic purchasing power, in line with the slowdown in Thailand’s economy. Global economic uncertainties are also weighing on the recovery of the tourism sector. In addition, the increasing adoption of hybrid working arrangements by organizations to reduce commuting is likely to dampen retail activity. As a result, retail operators are expected to delay store expansion or selectively lease space in high-potential locations to optimize costs. Consequently, demand for retail space is projected to grow by only 0.9% from 2025. Over the 2027–2028 period, the retail market is expected to show signs of gradual recovery, supported by the rebound in tourism, the expansion of transportation infrastructure—particularly mass transit systems—and the continued growth of suburban communities in outer Bangkok. These developments are expected to generate new retail demand, creating opportunities for retail expansion. This trend is further reinforced by evolving consumer behavior, with younger generations continuing to value in-store physical experiences that cannot be fully replicated by online platforms.
However, the market continues to face several structural challenges. The slow pace of economic recovery in Thailand is likely to constrain purchasing power among middle- to lower-income consumers, limiting growth in leasing demand. At the same time, intensifying competition from new supply—particularly from large-scale mixed-use developments—and the emergence of alternative retail formats will continue to pressure market performance. In addition, rising cost burdens associated with enhancing omnichannel integration to meet evolving consumer expectations are expected to weigh on developers.
Krungsri Research view
Krungsri Research Outlook for the Rental Retail Market, 2026–2028:
-
Retail space in the BMR (excluding community malls): Revenue is expected to grow gradually, supported by locations that cater to expanding communities in both urban areas and key provincial cities. Developers are increasingly refining their strategies by expanding luxury retail space to attract middle- to high-income consumers. Large developers are likely to maintain a competitive advantage due to stronger financial capacity and extensive land accumulation in high-potential locations, placing them ahead of small- to mid-sized operators. However, the high concentration of enclosed malls in prime locations is expected to intensify competition for attracting both tenants and customers. As a result, the ability to raise rental rates remains limited. At the same time, relatively high operating costs—including building maintenance and utilities—as well as ongoing expenditures related to renovation and rebranding to maintain a modern image, are likely to exert pressure on operators’ margins.
-
Community malls: Revenue is expected to grow steadily, albeit at a modest pace, supported by the continued expansion of new supply, particularly in emerging suburban residential areas. This is largely driven by relatively low development costs and the availability of land for development. Moreover, the segment is characterized by relatively low barriers to entry, resulting in a large number of small- to mid-sized developers entering the market. Consequently, competition is intense, both in terms of rental pricing and the ability to attract customer traffic. In addition, community malls are highly sensitive to local purchasing power. A slowdown in purchasing power and tourist arrivals in the area would affect tenants and put pressure on overall business performance.
Overview
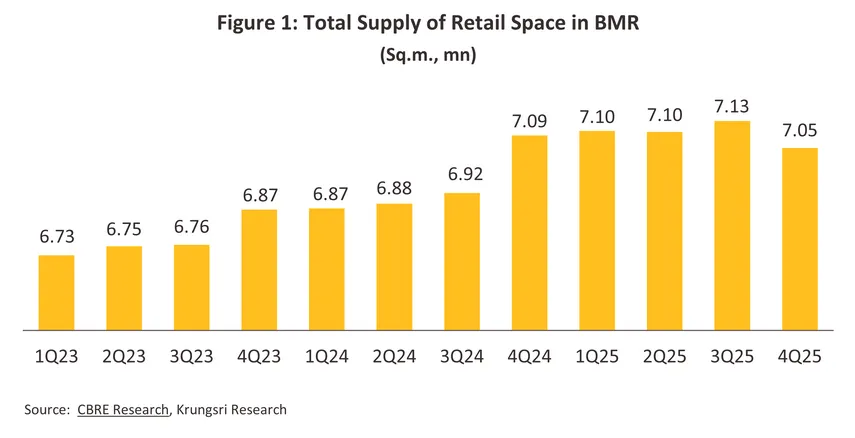
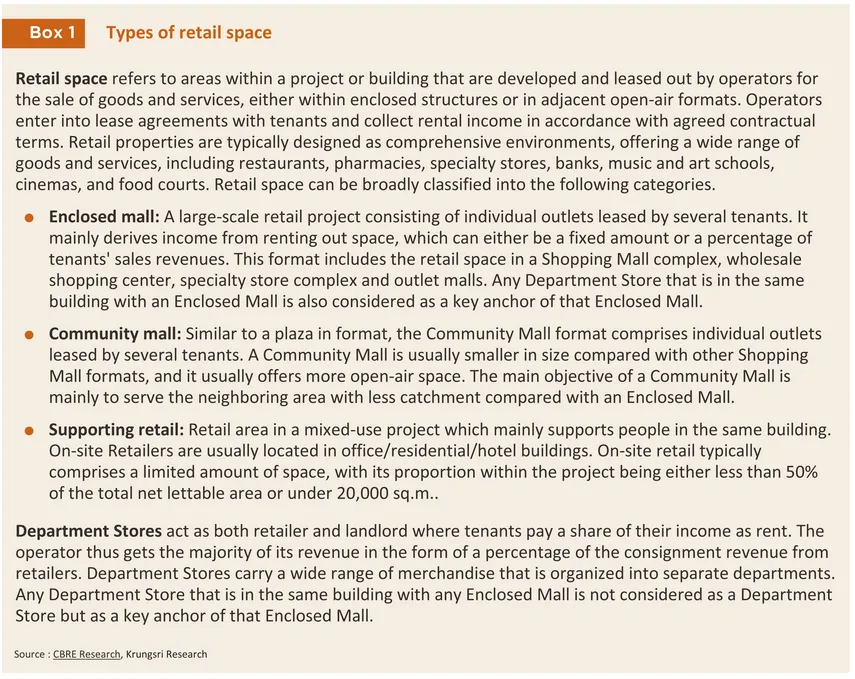
Retail space1/ in Thailand is predominantly concentrated in the Bangkok Metropolitan Region (BMR) and major regional centers2/. As of the end of 2025, the total supply of retail space in BMR is around 7.3 million sq.m. (Figure 1), with most of this space—around 85%—situated in shopping malls. In terms of asset classification, Shopping malls can be categorized into enclosed malls, community malls, and supporting retail (Box 1). Retail developers typically focus on the development and allocation of leasable space, alongside the provision of comprehensive facilities to support tenant operations. Revenue streams are primarily derived from rental income, supplemented by ancillary income sources such as common area maintenance (CAM) fees and revenues from on-site marketing and promotional activities. The retail market in Bangkok and its vicinity thus serves as a key indicator of domestic purchasing power and future opportunities for commercial project development.
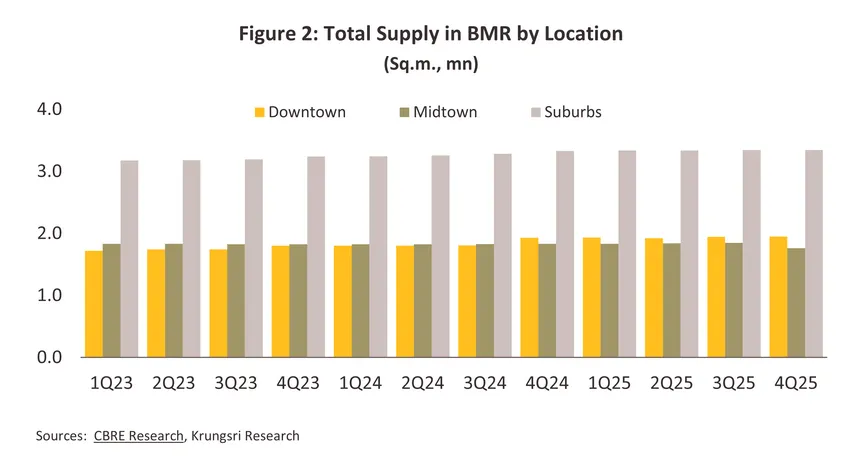
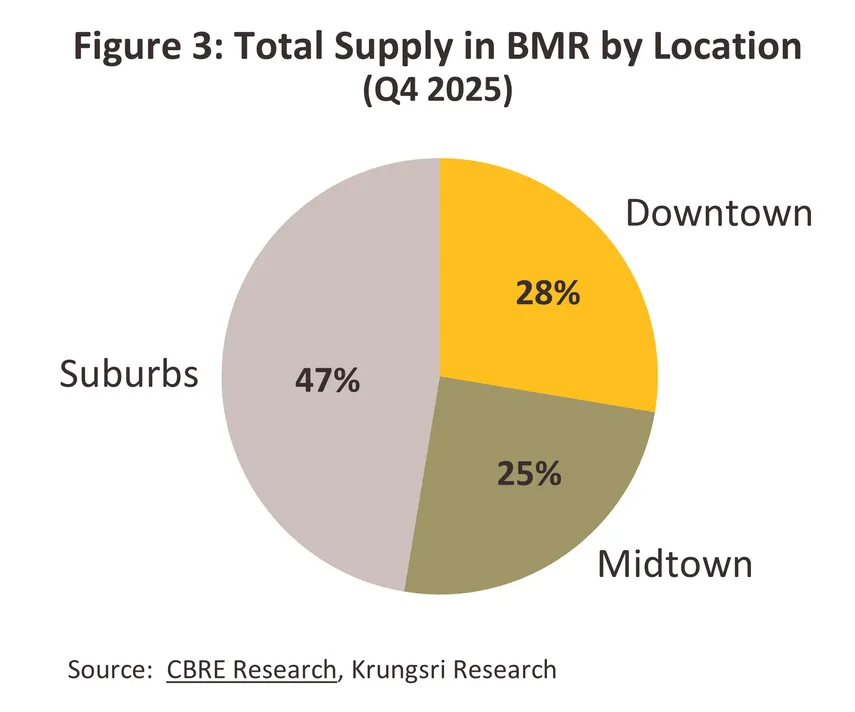
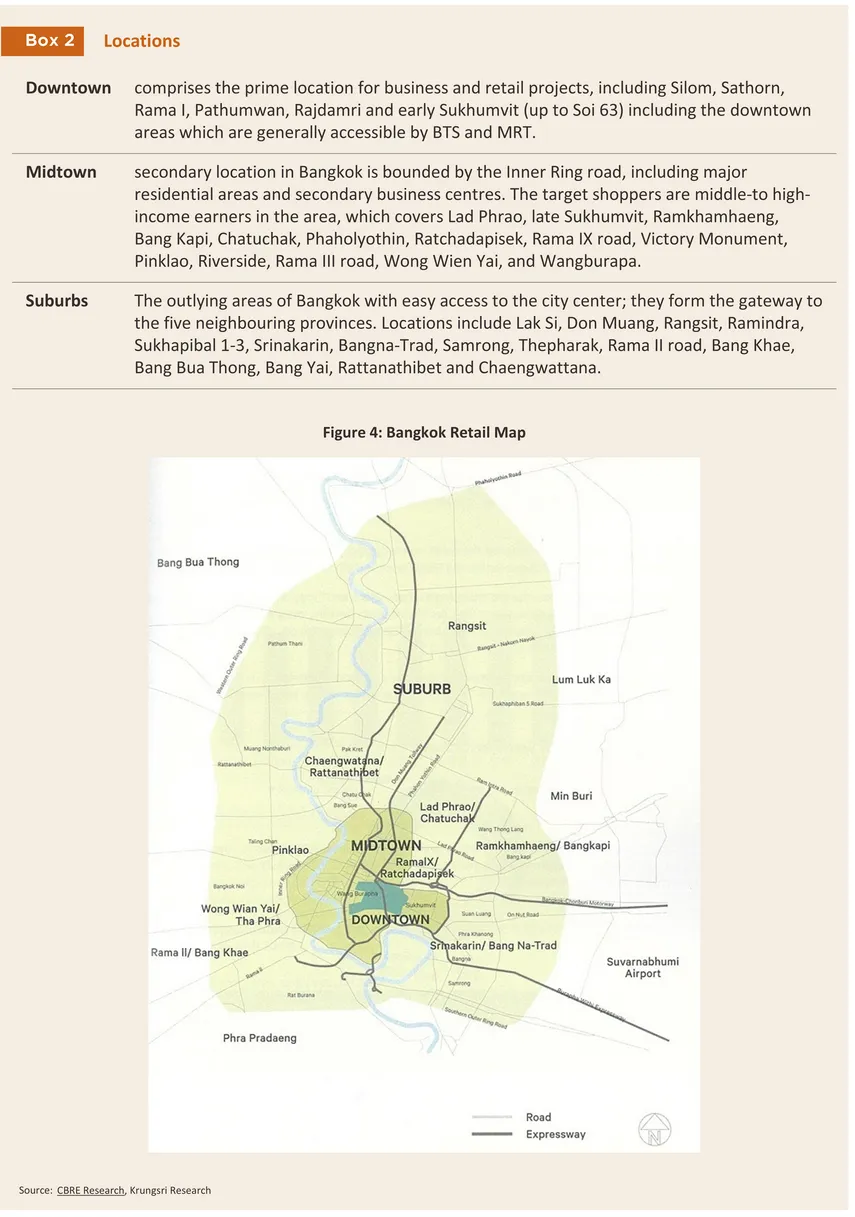
Approximately 47% of the rental retail space in the BMR is located in suburban areas (Suburbs) (Figures 2 and 3). This distribution has been driven by improvements in transportation infrastructure, including road network development and the expansion of mass transit systems, which have enhanced accessibility and supported the growth of surrounding residential communities. At the same time, urban planning restrictions in certain parts of Bangkok limit the development of large-scale retail projects. As a result, new developments—particularly in downtown areas (including Silom, Sathorn, Ratchadamri, and early Sukhumvit)—have become increasingly constrained. In response, operators have shifted their strategies from expanding gross leasable area to upgrading and repositioning existing assets, focusing on modernization and premium positioning to better serve high-income customers, particularly foreign tourists. Meanwhile, midtown areas primarily cater to middle-income consumers. Retail developments in these locations are therefore typically positioned within the mid- to upper-mid market segments, aligning with local purchasing power and the consumption patterns of surrounding residential communities.
Rental retail space can be classified by tenant type and lease structure, as follows.
In general, lease agreements comprise two main cost components: base rent (accounting for approximately 40% of total occupancy costs) and service charges (the remaining 60%). Lease arrangements can therefore be divided into two components, as follows.
-
Rental agreement: The rental rate is specified on a per square meter per month basis. Tenants are typically required to pay one month’s rent in advance, which is recognized as income by the property owner. Rental rates are determined based on unit size and floor location, and are typically reviewed every three years, with an average increase of approximately 10%.
-
Service agreement: This covers additional costs beyond the rental agreement, including insurance premiums, utility charges (such as electricity, water, telephone, and gas), management fees, maintenance expenses, and value-added tax (VAT). These costs are variable and depend on actual usage. Adjustments to service charges are therefore typically based on changes in utility and operating costs over time.
Situation
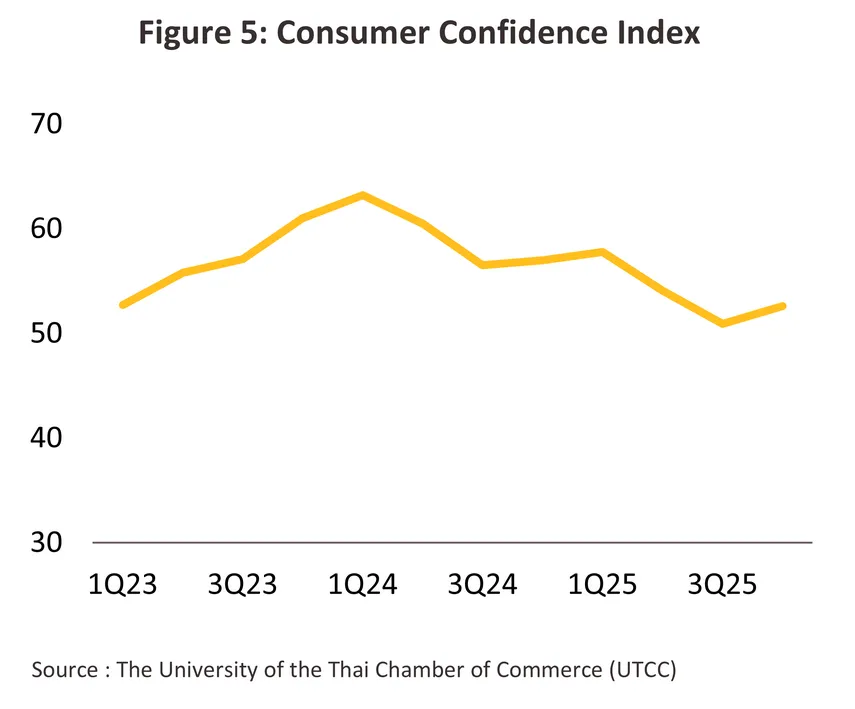
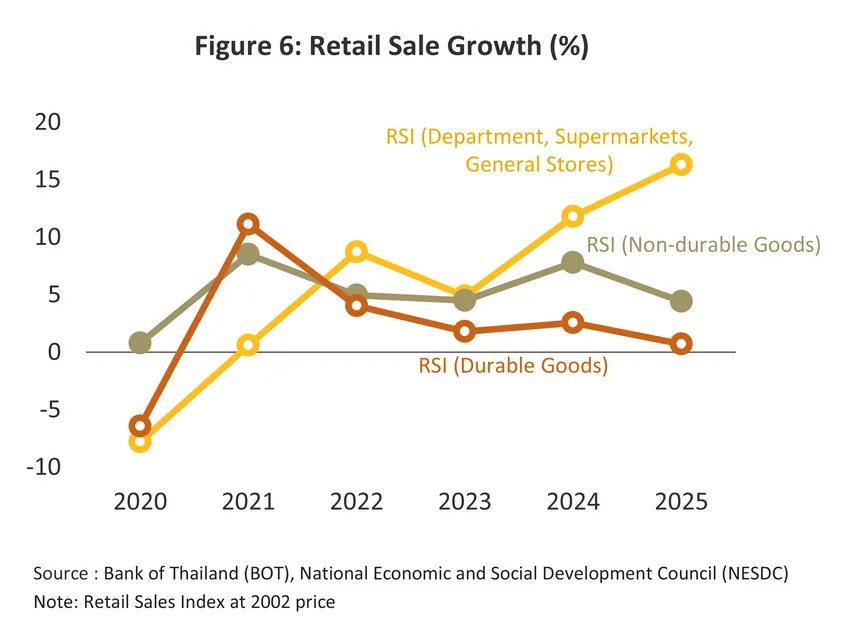
In 2025, the retail sector faced mounting pressure from fragile consumer purchasing power, resulting in a slowdown in overall growth. This was reflected in a decline in the Consumer Confidence Index (CCI), which fell by an average of -9.2% compared to 2024 (Figure 5). At the same time, growth in retail sales of non-durable goods moderated to 4.4%, down from 7.8% in 2024, while sales of durable goods expanded by only 0.7%, compared to 2.6% in the previous year. However, department stores and general retail sales grew strongly by 16.3%, accelerating from 11.8% in 2024 (Figure 6). This growth was supported by purchasing power among middle- to high-income consumers, as well as spending by international tourists, particularly in the food and beverage segment. In addition, retail tenants have increasingly adopted online sales platforms to stimulate demand, while implementing stricter cost management measures, including downsizing leased space. As a result, the rental retail market did not experience a severe downturn. The overall market situation can be summarized as follows.
-
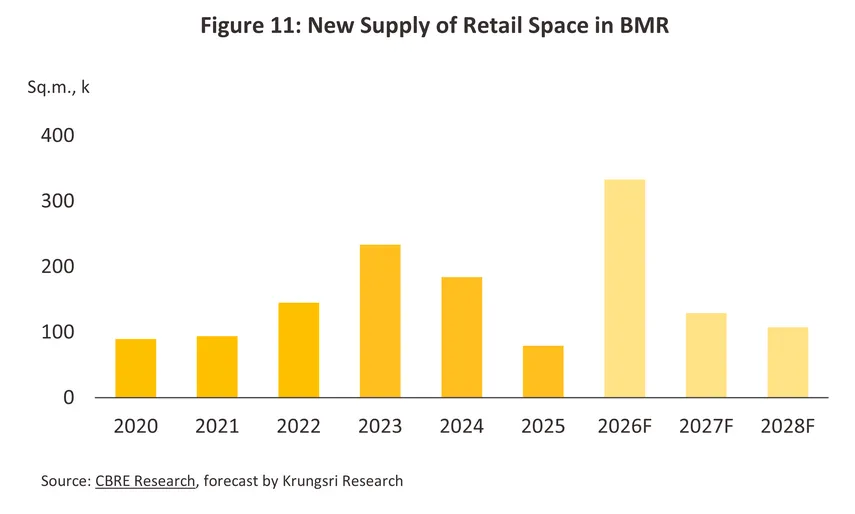
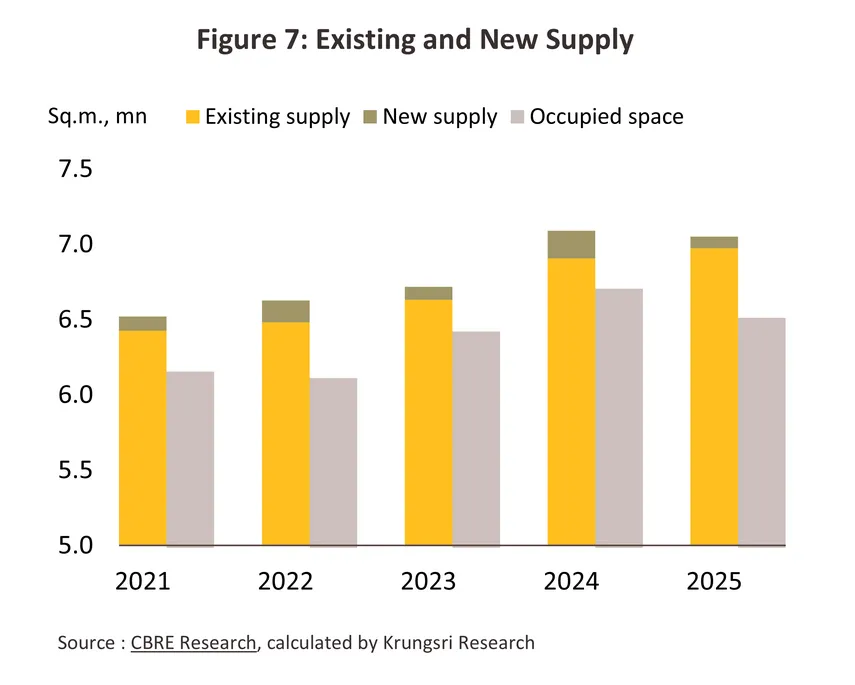
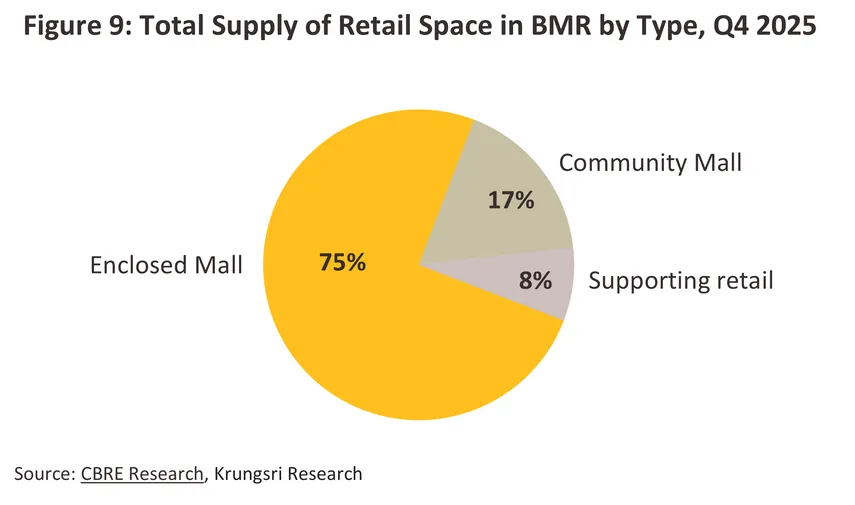
New retail supply reached a seven-year low of approximately 79,000 sq.m. The majority of this came from: (i) the launch of flagship retail space within large-scale mixed-use developments, such as Central Park at the Dusit Central Park project, located at a prime intersection of Silom and Rama IV roads; (ii) continued expansion of community malls in suburban areas (e.g., MarketPlace Thepharak, Parc Bangna, KINGSQUARE, and Little Walk Ramkhamhaeng); and (iii) an increase in supporting retail space within newly completed Grade A office buildings (e.g., Corner Ekkamai and Town Hall Sukhumvit 49). However, the slowdown in Thailand’s economy led to the closure of several underperforming retail projects in suburban areas. As a result, total retail supply contracted by -0.5% to 7.1 million sq.m. (Figure 7). Of this, 75% comprised enclosed mall space, 17% community malls, and the remaining 8% supporting retail.
-
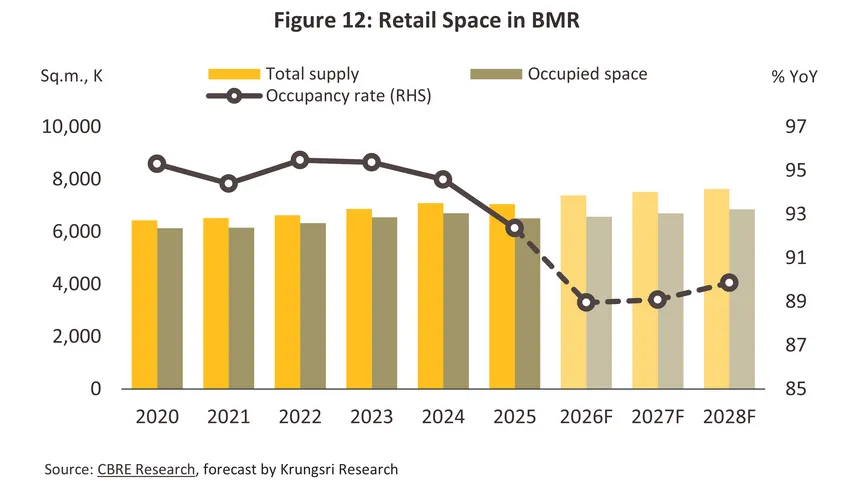
Total occupied retail space declined by -2.9% to 6.5 million sq.m. (Figure 7). This contraction was driven by weakening domestic purchasing power amid elevated living costs and high household debt, leading consumers to adopt more cautious spending behavior, particularly on discretionary goods. In addition, consumers have increasingly shifted toward online platforms, attracted by a wider variety of products and more competitive pricing. This trend is especially evident among Generation Z, who show a strong preference for purchasing goods and services through social commerce platforms, including social media channels such as TikTok, Facebook, and Instagram3/. This shift has disproportionately affected retail operators targeting middle- to lower-income segments. In response, tenants have placed greater emphasis on optimizing space utilization, while expanding online sales channels to align with evolving omnichannel shopping behavior. Demand for retail space has therefore become more concentrated in specific segments, particularly food and beverage (F&B) and health and wellness operators, especially in prime locations with high footfall.
-
The overall occupancy rate of retail space declined to 92.4%, down from 94.6% in 2024, reflecting a broad-based decrease across all locations. By area, suburban locations continued to record the highest occupancy rate at 93.2%, although this declined by -3.0 percentage points, supported by more competitive rental pricing. Meanwhile, downtown areas reported an occupancy rate of 92.5%, easing only slightly by -0.6 percentage points, underscoring the resilience of prime locations. In contrast, midtown areas recorded the lowest occupancy rate at 90.1%, declining by -2.6 percentage points. This was largely due to the influx of new retail developments in nearby locations offering more attractive rental terms, prompting some tenants to relocate to more cost-effective sites.
-
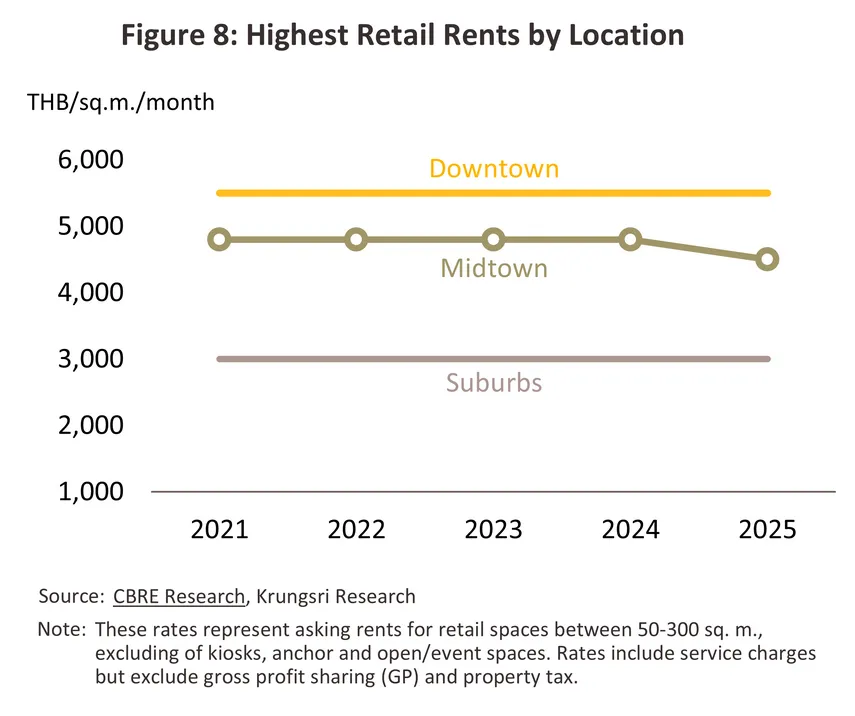
Overall retail rental rates in 2025 remained broadly stable compared to the previous year, with the exception of midtown areas, where rents softened due to intensifying competition. Downtown locations—characterized by high concentrations of economic activity and strong ability to attract tourist footfall—maintained stable average rents in the range of THB 1,500–5,500 per square meter per month. In suburban areas, rental rates averaged THB 700–3,000 per square meter per month (Figure 8).In contrast, midtown rental rates declined slightly to an average of THB 1,000–4,500 per square meter per month, down from THB 1,000–4,800 in 2024 (Figure 8), reflecting increased competitive pressure from newly launched projects. By segment, rents for enclosed malls were more than twice those of community malls across most locations. This premium is driven by the stronger tenant mix in enclosed malls, which are typically anchored by leading brands that attract higher-spending customers, including international tourists. As a result, tenants are willing to pay higher rents to maintain brand positioning and support sales performance.
Market conditions across different retail segments can be summarized as follows.
-
Enclosed mall
-
The size of each retail project typically ranges between 70,000 and 200,000 sq.m., with developments largely concentrated in suburban areas to support the expansion of residential projects and cater to middle- to upper-income consumers with urban lifestyles who prioritize convenience (e.g., Central Westgate, Mega Bangna, Central Westville, Central Ramindra, Central Pinklao, and Central Festival Eastville). In contrast, new developments in downtown areas face increasing constraints due to rapidly rising land costs. As a result, developers have shifted their focus toward asset enhancement and the modernization of existing retail space to attract high-quality tourists and high-net-worth individuals (HNWIs), who tend to be more resilient to economic fluctuations.
-
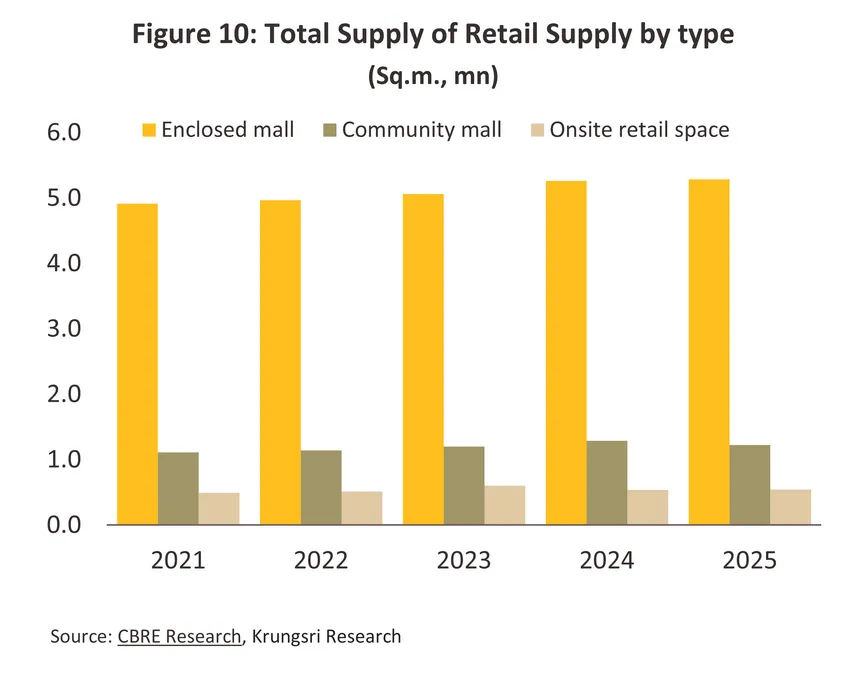
In 2025, total supply of enclosed mall space reached 5.3 million sq.m., accounting for 75% of total retail space, representing a modest increase of 0.5% from 2024. Meanwhile, occupied space declined by -2.0% to 4.9 million sq.m., reflecting weaker leasing demand in suburban areas (-3.9% YoY) and midtown locations (-3.7% YoY). These two segments together account for approximately 47% of total retail supply. In contrast, enclosed malls in downtown areas continued to show signs of recovery, supported by the launch of major projects such as One Bangkok (Phase 1) and Central Park. However, the increase in supply exerted downward pressure on occupancy rates, which declined to an average of 92.8%, compared to 95.2% in 2024.
-
Community mall
-
Community mall projects typically range in size from 3,000 to 30,000 sq.m. The majority are located in suburban areas, which account for approximately 64% of total community mall retail space. The segment previously faced an oversupply driven by rapid expansion, with supply growing at an average rate of 18% per year during 2012–2016. This led to intense competition, resulting in the gradual closure of a number of projects and a slowdown in growth to an average of 2.6% per year over 2017–2020. However, the COVID-19 pandemic during 2021–2023 acted as a catalyst for renewed growth in the segment, with supply expanding at an average rate of 5.4% per year. This was supported by shifts in consumer behavior, as spending increasingly moved closer to residential areas in order to avoid crowded locations.
-
In 2025, new supply of community mall retail space entering the market totaled 22,200 sq.m., marking a sharp decline of -63.9%. The majority of this new supply was located in non-CBD areas, where residential expansion has supported higher purchasing power and increased demand for neighborhood-based activities (e.g., Market Place Thepharak, Little Walk Ramkhamhaeng, and Parc Bangna). In the CBD, a notable project was King Square (Rama III), which targets high-end lifestyle consumers. However, a number of older projects that were unable to maintain competitiveness were gradually phased out, resulting in a contraction in total retail supply of -5.0% to 1.2 million sq.m., accounting for 17% of total retail space. Meanwhile, occupied space declined by -5.8% to 1.1 million sq.m., as small and medium-sized enterprise (SME) tenants became more cautious in their expansion plans, opting to retain only profitable outlets to maintain business stability. As a result, the occupancy rate fell to 91.4%, down from 92.2% in 2024.
-
Supporting retail
-
Supporting retail is typically integrated within mixed-use developments4/ , where retail space is generally limited to no more than 50% of the total leasable area within a project or capped at 20,000 sq.m., in order to maintain a balanced project composition. Tenant mix is carefully curated to align with the primary function of the development. For instance, retail space within office buildings is predominantly allocated to food and beverage (F&B) operators to cater to the needs of office workers during working hours. In contrast, retail areas within hotel developments are typically occupied by souvenir shops, lifestyle retailers, and premium services, designed to meet the spending preferences of hotel guests.
-
In 2025, total supporting retail supply increased slightly by 0.3% to 0.54 million sq.m., accounting for 8% of total retail space. Meanwhile, occupied space declined by -4.2% to 0.49 million sq.m.. This contraction in demand was primarily driven by the continued prevalence of hybrid working arrangements, as well as downsizing by tenants in the banking and service sectors, which have increasingly shifted toward digital transaction channels. As a result, footfall within office buildings declined. Consequently, the occupancy rate fell to 90.0%, down from 94.4% in 2024.
Outlook
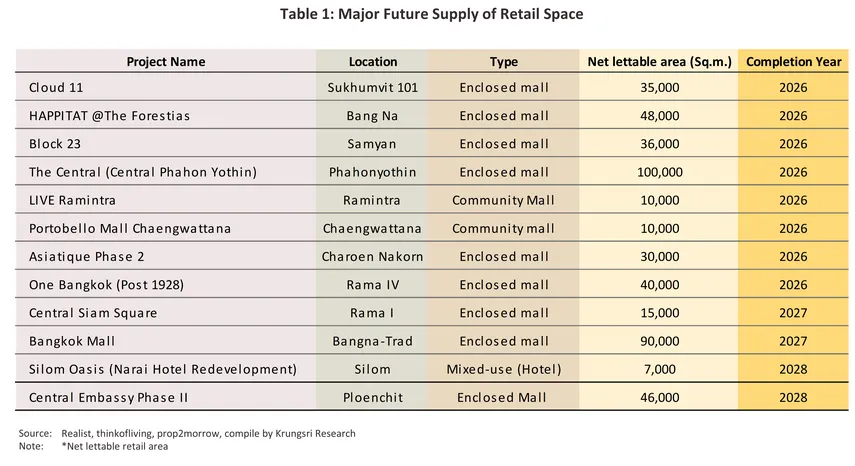
In 2026, the rental retail market is expected to face continued pressure from fragile consumer purchasing power. This is primarily driven by several factors: (i) persistently high household debt and rising living costs, which are prompting more cautious spending amid a slowing Thai economic outlook (with GDP growth projected to remain below 2.0%); (ii) heightened global economic uncertainty, particularly from geopolitical tensions in the Middle East, which have driven a sharp increase in energy prices and are likely to disrupt supply chains, leading to potential shortages of raw materials in certain industries (e.g., plastic packaging) and upward pressure on goods prices; (iii) a slowdown in Thailand’s tourism sector, a key driver of retail demand, with international tourist arrivals projected to 32.5 million, declining by -1.4% from 2025 and by -4.4% from the earlier estimate of 34 million visitors; and (iv) the increasing adoption of hybrid working arrangements by organizations seeking to reduce operating costs, particularly energy expenses. These factors are expected to prompt retail operators to delay new store expansion or selectively lease space in prime locations to optimize costs and wait for clearer market conditions. As a result, demand for retail space is projected to grow by only 0.9%, bringing total occupied space to approximately 6.6 million sq.m. On the supply side, new retail space entering the market is expected to reach approximately 330,000 sq.m.—more than four times the level recorded in 2025 (Figure 11)—driven primarily by the completion of large-scale mixed-use developments (e.g., One Bangkok Phase 2, Cloud 11, HAPPITAT @ The Forestias, Central Northville, and Central Phahonyothin). Consequently, total retail supply is projected to increase by 4.7% to 7.4 million sq.m. (Figure 12). Given the imbalance between supply expansion and modest demand growth, the average occupancy rate is expected to decline to 89.0% from 92.4% in 2025.
During 2027–2028, the rental retail market is expected to show signs of gradual recovery, supported by the following factors:
-
Demand for retail space is projected to grow at an annual rate of 1.7–2.5% during the period, remaining below the pre-pandemic average of 3.7% recorded over 2017–2019. This growth will be supported by several key factors: (i) a gradual recovery in the Thai economy and the tourism sector. International tourist arrivals are expected to reach approximately 35.5 million by 2028, supporting continued growth in lifestyle and fashion retail sales, particularly in CBD areas and major tourist destinations; (ii) ongoing urban expansion driven by improvements in transportation connectivity—especially mass transit systems—which enhance accessibility to suburban and peripheral areas, leading to the development of new residential communities. This will support the expansion of shopping malls and community malls to serve emerging demand in these locations; (iii) government stimulus measures aimed at boosting consumption, such as digital tax refund schemes and proactive tourism promotion, which are expected to encourage higher tourist spending; and (iv) evolving consumer preferences toward experience-driven consumption, particularly among Generation Z, who are expected to play an increasingly important role in driving future consumption as they enter the workforce. Survey findings from eMarketer indicate that Gen Z consumers place strong emphasis on in-store experiences—seeking to physically interact with products before making purchase decisions and favoring destinations that offer diverse activities. This underscores the continued importance of physical retail as a key channel for brand building that cannot be fully substituted by e-commerce.
-
Retail supply is projected to increase at an average rate of 1.2–2.0% per year, equivalent to approximately 240,000 sq.m. (Figure 11), driven by the gradual launch of new retail developments across multiple high-potential locations. In 2027, new supply is expected to come on stream from projects such as Bangkok Mall (Bangna area), Woeng Nakhon Kasem (Charoen Krung area), and Center Siam Square. In 2028, additional supply will be driven by the completion of several mixed-use developments, including Central Embassy Phase II, a CPN mixed-use project on Rama IX Road, and Silom Oasis. As a result, competition in the retail market is expected to intensify, driven by the continued expansion of cumulative supply. CBD locations are likely to benefit from their strong locational advantages and a greater focus on luxury segments, enabling high-quality developments to maintain a competitive edge. In contrast, Non-CBD retail areas are expected to face increasing challenges from potential oversupply, particularly as multiple large-scale projects enter the market concurrently. Operators are therefore likely to adopt more competitive pricing strategies and offer attractive leasing incentives to retain tenants.
-
The average occupancy rate is projected to 89.5% (Figure 12). Although slightly higher than in 2026, it will remain at a low level, reflecting limited recovery in retail space absorption, particularly in Non-CBD areas. In these locations, operators may need to lower their revenue expectations or adopt more proactive marketing strategies to retain tenants. In contrast, CBD locations are expected to maintain their competitive advantage as key economic and transit hubs. Despite the addition of new high-end supply (e.g., Central Embassy Phase II and Silom Oasis), these areas remain prime targets for leading global brands seeking to enhance brand positioning and access high-spending customers, including international tourists. As a result, CBD retail space can command significantly higher rental rates than other locations. However, elevated rental levels may limit accessibility for smaller tenants. As a result, occupancy rates in CBD areas are likely to remain stable or increase only marginally. Nevertheless, intensifying competition across all segments is expected to pressure retail developers to accelerate strategic adjustments, including diversifying retail formats and introducing innovative marketing strategies to retain existing tenants and attract new entrants amid an increasingly competitive landscape.
Retail developers are increasingly repositioning retail spaces into experience-driven lifestyle destinations that foster stronger community engagement. This includes the development of multi-purpose destinations that integrate art, wellness, dining, and entertainment offerings. These initiatives aim to increase dwell time, thereby supporting higher tenant sales performance. The outlook for each retail segment over the 2026–2028 period can be summarized as follows.
-
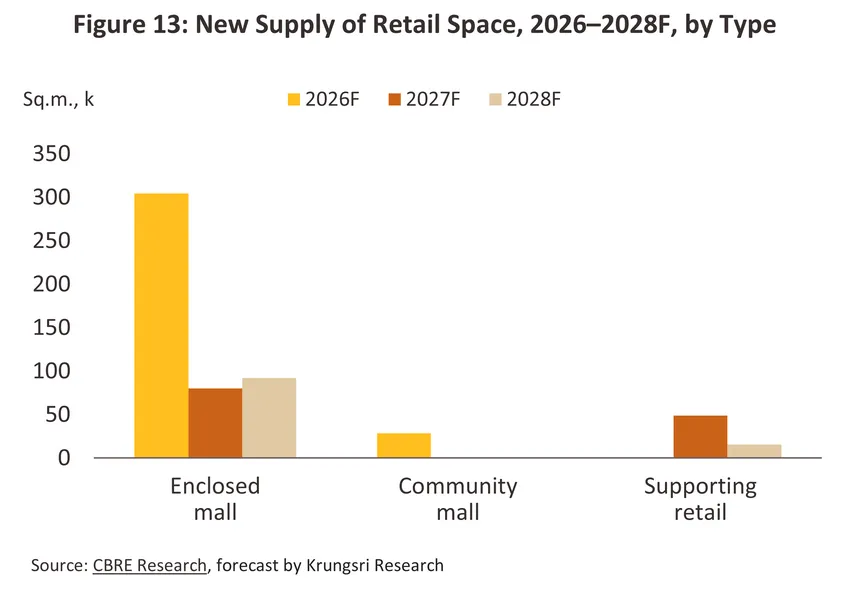
Enclosed malls: Retail supply is expected to continue expanding across both CBD and non-CBD locations, supported by the ongoing expansion of mass transit networks and the growth of mid- to upper-income residential developments. Most new developments are integrated within mixed-use projects, with a strong emphasis on experiential and lifestyle offerings to drive footfall. Competition is expected to intensify significantly, particularly with the launch of multiple mega projects in close proximity. Meanwhile, leasing demand is projected to recover gradually, supported by a relatively resilient customer base comprising predominantly middle- to high-income consumers. As a result, occupancy rates are expected to stabilize at around 90.0% on average. Rental rates in CBD locations may increase slightly, supported by stronger purchasing power, despite rising operating cost pressures. In response, mall operators are expected to adopt more proactive asset management strategies, including the development of integrated ecosystems to attract both domestic and international tenants that continue to value physical storefronts, while enhancing overall footfall.
-
Community malls: Evolving consumer behavior, with a stronger preference for convenient, one-stop retail offerings located near residential areas, continues to support the relevance of community malls. This trend aligns with the expansion of low-rise residential developments in suburban locations, where residents are typically middle- to high-income consumers. Key growth areas include Ratchaphruek–Chaiyaphruek, Bangna–Srinakarin, and Krungthep Kreetha. However, the segment faces increasing challenges from the entry of large cross-industry investors (e.g., energy sector players), intensifying market competition. Coupled with only a gradual recovery in purchasing power, these factors have placed downward pressure on occupancy rates, which are expected to decline to an average of around 87.7% from 91.4% in 2025. In response, developers are likely to pursue differentiation strategies to maintain competitiveness. These include targeting high-potential locations, attracting well-known anchor tenants, and enhancing project appeal through the integration of green spaces and pet-friendly design concepts to capture demand from affluent, modern families with increasingly fragmented preferences. Amid a growing number of tenant options, rental growth is expected to remain limited, with a stronger focus on delivering cost efficiency and value to tenants.
-
Supporting retail: New supply is projected to enter the market at an average of 15,000–20,000 sq.m. per year. This is driven by mixed-use developments, premium office buildings, and large-scale residential projects that cater to office workers and residents. However, the segment is expected to face headwinds from a gradual recovery in purchasing power, cautious consumer spending, and the continued adoption of hybrid working arrangements. As a result, demand is likely to expand at a slower pace than supply, placing downward pressure on occupancy rates, which are projected to decline to around 86.2% from 90.0% in 2025. In response, developers are expected to prioritize greater flexibility in space design to accommodate specialty retailers, while developing integrated ecosystems that better serve building users. These strategies are expected to help support rental levels, particularly in Grade A developments and CBD locations, where rents are likely to remain stable or increase slightly. In contrast, non-core locations may face heightened competitive pressures due to increasing retail supply in the market.
-
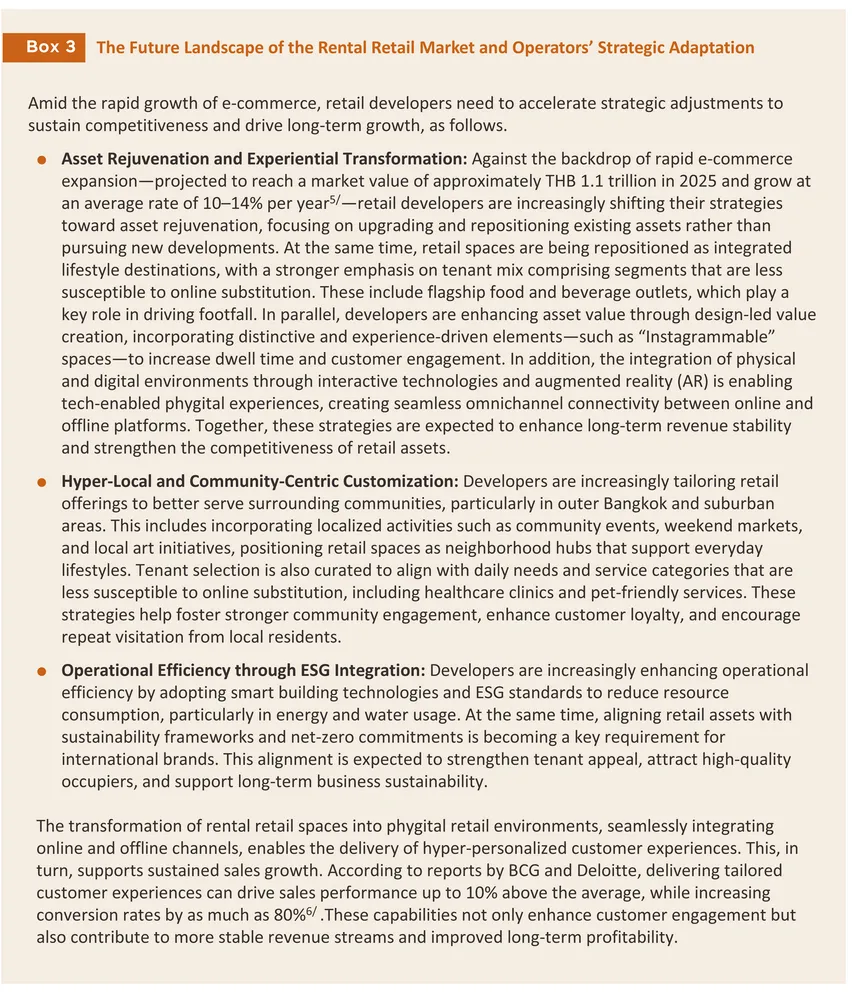
Retail developers are expected to face several key challenges, including: (i) Expected slow recovery in the Thai economy, coupled with persistently high household debt, which is likely to constrain purchasing power among middle- to lower-income consumers. At the same time, the tourism sector faces downside risks from geopolitical tensions and a slowing global economy. These may dampen both spending capacity and travel demand among international tourists—one of the key customer segments for CBD retail—thereby limiting growth in leasing demand; (ii) Intensifying competition from new supply and alternative retail formats, driven by the phased completion of multiple large-scale mixed-use developments. In addition, the market is facing increasing competition from “alternative retail spaces”. These include boutique retail in upscale residential neighborhoods, emerging community clusters, and retail offerings along major transportation corridors, which are capturing a growing share of consumer spending; and (iii) Rising cost pressures associated with enhancing in-store experiences to align with omnichannel ecosystems. As e-commerce continues to expand, some tenants are downsizing physical store footprints to manage costs. As a result, retailers must accelerate strategic shifts toward delivering tangible, experience-driven offerings by seamlessly integrating online and offline channels, in order to sustain sales and maintain long-term footfall.
1/ Retail Space is defined as shopping malls are sub-divided into enclosed malls, community malls and supporting retails.
2/ Major regional centers’ refers to important tourist destinations and centers of economic development in the regions of the country, excluding the five provinces surrounding Bangkok. Examples include Chiang Mai, Nakhon Sawan, Phitsanulok, Khon Kaen, Nakhon Ratchasima, Chonburi, Rayong, Phetchaburi, Prachuap Khiri Khan, Songkhla, Surat Thani, Krabi, Phang Nga and Phuket.
3/ Source: Trade Policy and Strategy Office (2024), “Commerce Ministry promotes authentic reviews to boost spending on dining, travel, and shopping.”
4/ Mixed-use real estate refers to an integrated property development that combines residential and commercial components—such as retail, office, and residential units—within a single project.
5/ Projections are based on data from the Thailand E-Commerce Trends 2025 report (Kantar & Priceza)and market analysis by IMARC Group on the value of Thailand’s e-commerce market.
6/ Boston Consulting Group (BCG) “Global Retail Consumer Insights: The Power of Personalization”, Deloitte Development LLC “Retail Outlook 2025: Navigating the Phygital Landscape”.







.webp.aspx)