EXECUTIVE SUMMARY
Business conditions should improve slightly in the retail rentals sector through 2022, though growth will be limited by the impact on consumer purchasing power of surging inflation and the rising cost of living. In addition, although the reopening of the country to foreign arrivals is helping the tourism sector to recover, at present this remains insufficient to have a major impact on retailers in areas that are dependent on tourist spending especially those in the downtown and tourist areas. Nevertheless, the situation will improve over 2023 and 2024 as economic recovery and a continuing rebound in tourism feeds into stronger private consumption, and progress on the build out of infrastructure helps to spur greater investment in new retail space.
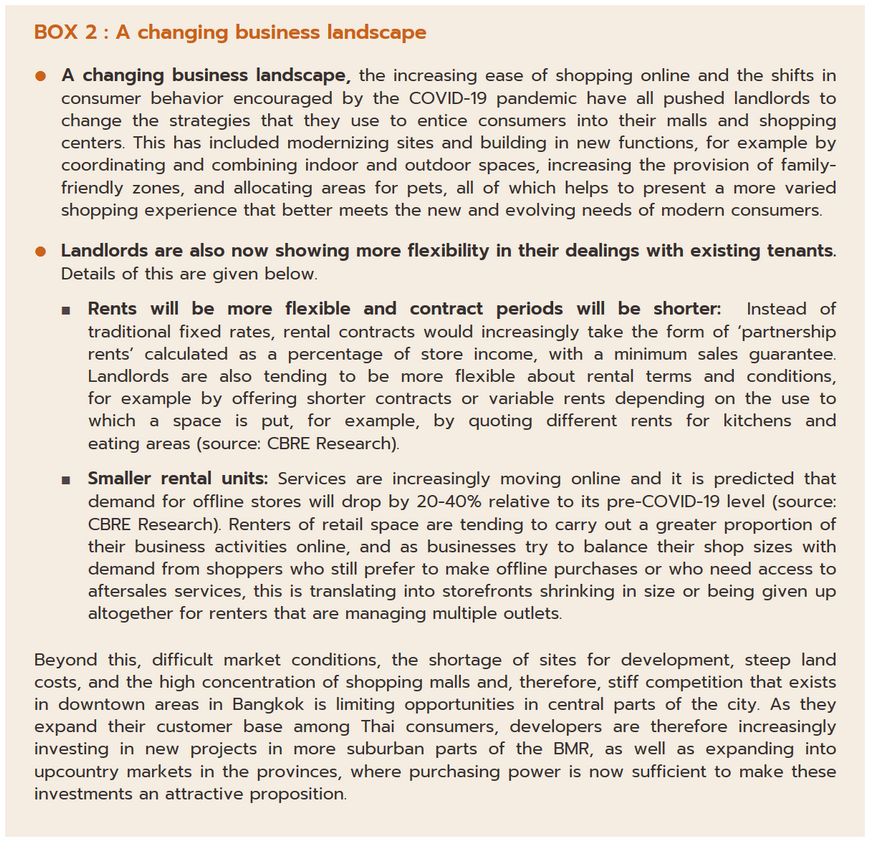
Players will need to overhaul their business strategies if they are to be successful in meeting the challenges posed by intensifying competition. The latter is coming both from an extension in supply fueled by work on many new large-scale retail developments and from growth in e-commerce, which is steadily stealing market share from bricks-and-mortar retailers. In light of these changes, players will face a rapidly transforming post-pandemic business landscape.
Krungsri Research view
Growth in demand for retail space for rent will remain somewhat weak through 2022. Although the industry will be helped by economic growth and the reopening of the country to foreign tourists, expansion in the market will be limited by the impact on consumer purchasing power of strong inflation and the rapid escalation in the cost of living. However, the situation should improve over 2023 and 2024 as domestic levels of consumption strengthen, the tourist sector rapidly rebounds, and the government makes progress on its plans for the construction of new infrastructure, which will then help to stimulate greater investment in the retail sector. On the downside, businesses will have to contend with strong competition from developers working on a large number of new retail projects and the growing intrusion of e-commerce into the market for rented retail space.
-
Retail space in BMR (not including community malls): Income will tend to rise steadily, especially for operators of sites in the downtown area since demand for prime space from large Thai and international brands remains strong. Nevertheless, demand will build only gradually, and this will be outpaced by growth in new supply, leading to greater pressure on operators. The market is dominated by large players that enjoy advantages with regard to their access to capital and to land in high-potential locations. However, it is difficult to find new sites suitable for development and so players will tend to focus on attracting customers by investing in the renovation and modernization of existing sites.
-
Community malls in BMR: Income is expected to remain flat for this group. As community malls are generally small and investment costs are not prohibitive, so it is relatively easy to find sites that are suitable for development, especially in cheaper, more suburban areas. This will then encourage new players to enter the market and the supply of properties can thus be expected to rise. The latter will tend to stoke higher levels of competition, but at the same time, continuing weakness in consumer purchasing power among mid- to lower-income earners will mean that growth in demand will be sluggish, and recovery will be a protracted affair. This may then have an impact on operators’ income.
OVERVIEW
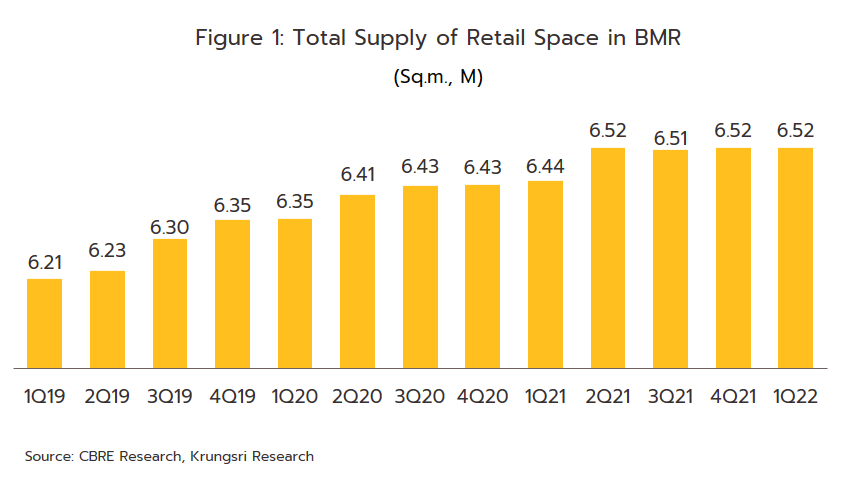
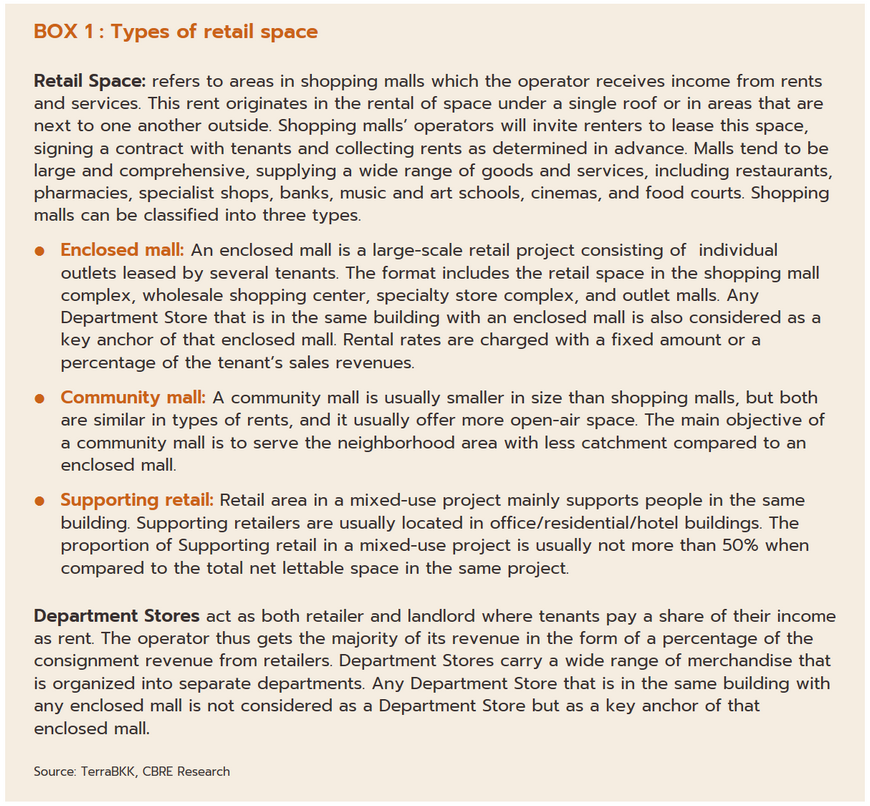
The majority of Thailand’s retail space[1] is located in the Bangkok Metropolitan Region (BMR) and major regional centers[2]. As of 1Q/22, the total supply of retail space in the BMR comes to around 6.5 million sq.m. (Figure 1), the majority of which is in shopping malls. This category includes only retail space for which the operator receives rental income. Shopping malls are sub-divided into enclosed malls, community malls and supporting retails (Box 1). Businesses operate primarily by developing the built infrastructure of a site and by providing amenities to renters and their main income then comes from the rental of this space.
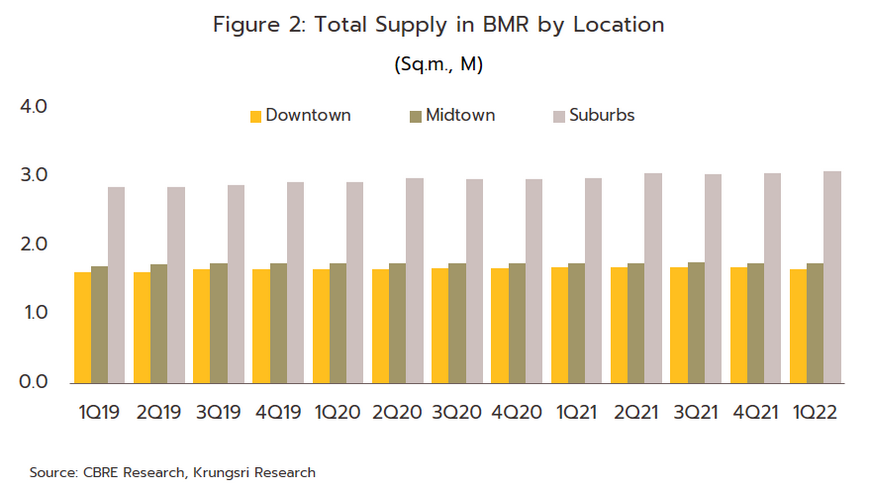
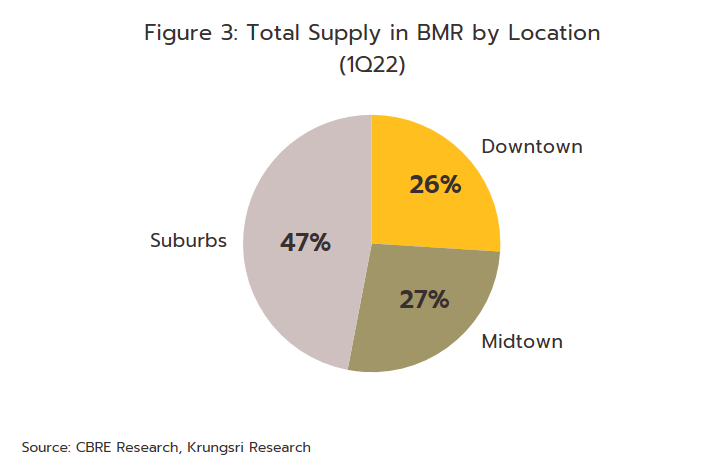
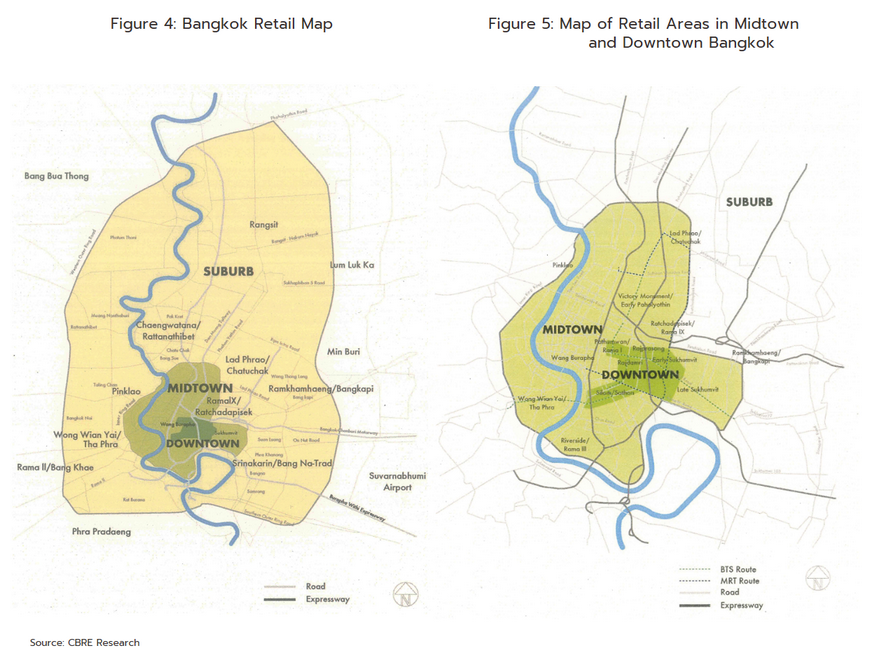
Almost 47% of the rental retail space in the BMR is in the suburbs (figures 2 and 3). Retail space in this area expanded at an accelerated pace due to development of transport network, and the extension of mass transit projects, and regulations of comprehensive plan have restricted developers to invest in large Shopping malls in some central parts of Bangkok. Those malls which are already in operation in downtown areas such as Silom, Sathorn, Ratchadamri, and early Sukhumvit are renovated to become more modern and more luxury to serve demand from high-income groups, especially from foreign tourists, while malls in midtown areas have looked to mid-income groups.
Locations
Downtown comprises the prime location for business and retail projects, including Silom, Sathorn, Rama I, Pathumwan, Rajdamri and early Sukhumvit (up to Soi 63) including the downtown areas which are generally accessible by BTS and MRT.
Midtown Secondary location in Bangkok is bounded by the Inner Ring road, including major residential areas and secondary business centres. The target shoppers are middle-to high-income earners in the area, which covers Lad Phrao, late Sukhumvit, Ramkhamhaeng, Bang Kapi, Chatuchak, Phaholyothin, Ratchadapisek, Rama IX road, Victory Monument, Pinklao, Riverside, Rama III road, Wong Wien Yai, and Wangburapa.
Suburbs The outlying areas of Bangkok with easy access to the city center; they form the gateway to the five neighbouring provinces and upcountry areas. Locations include Lak si, Don Muang, Rangsit, Ramindra, Sukhapibal 1-3, Srinakarin, Bangna-Trad, Samrong, Thepharak, Rama II road, Bang Khae, Bang Bua Thong, Bang Yai, Rattanathibet and Chaengwattana.
Rented retail space may be classified according to both the type of renter and the type of lease.
Typically, leases will cover two types of charges: rental fees (around 40% of the total lease costs) and fees for the provision of utilities and services (60% of lease costs).
1) The rental contract will specify the rent in terms of an amount per square meter per month, and this will normally be paid one month in advance. Rent provides a stream of net income for owners of the rental rates which will vary according to the size of the space rented, its floor location. Normally rents will be reviewed every three years, and on average they will rise by around 10%.
2) The service contract will specify any and all fees due for other services beyond merely the provision of rented space. This might include insurance premiums, charges for utilities (electricity, water, telephone, gas, etc.), management fees, VAT and so on. These service charges will vary depending on use. As regards increases in fees, these will largely be determined. Operators are divided into by the level of increases in the costs of utilities periodically.
SITUATION
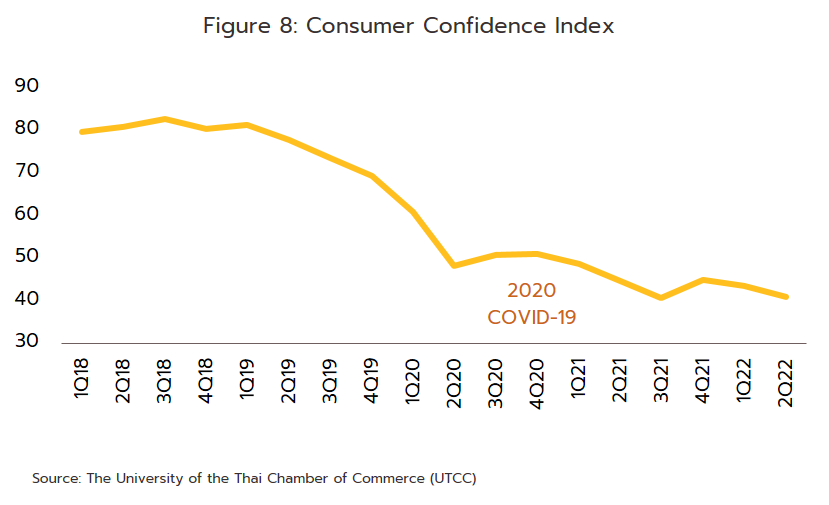
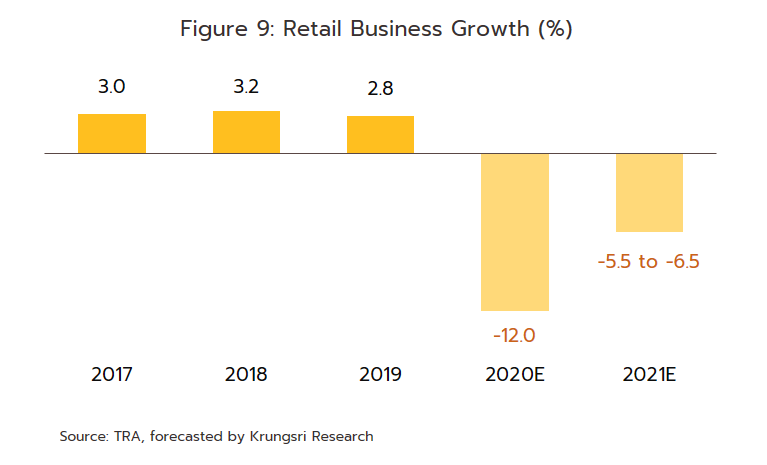
In 2021, although retail landlords saw a rebound in business conditions from the lows of 2020, the market remained substantially weaker than it was in the pre-COVID era. This was a result of: (i) the temporal extent of the crisis, which forced the government to introduce strict controls that included limiting the opening hours of department stores, shopping centers, and community malls from October 2020 to August 2021; (ii) Thailand’s only weak recovery (GDP was up 1.6%), the softness of consumer purchasing power, consumers’ increasing wariness over making purchases (reflected in the slump in the consumer confidence index to historic lows in 3Q21), and the only-anemic growth in private consumption (up just 0.3% from 2020) (Figure 8); and (iii) the over-90% crash in tourist arrivals, which had particularly severe consequences for retailers dependent on this market and especially those in downtown locations. These trends had significant impacts on retailers but the increasing reach of the vaccine rollout across the year and the steady relaxation of government controls allowed shopping centers and community malls to return to normal operations during 4Q21, and as such, footfall steadily rose. The overall situation for the retail rentals sector is given below.
-
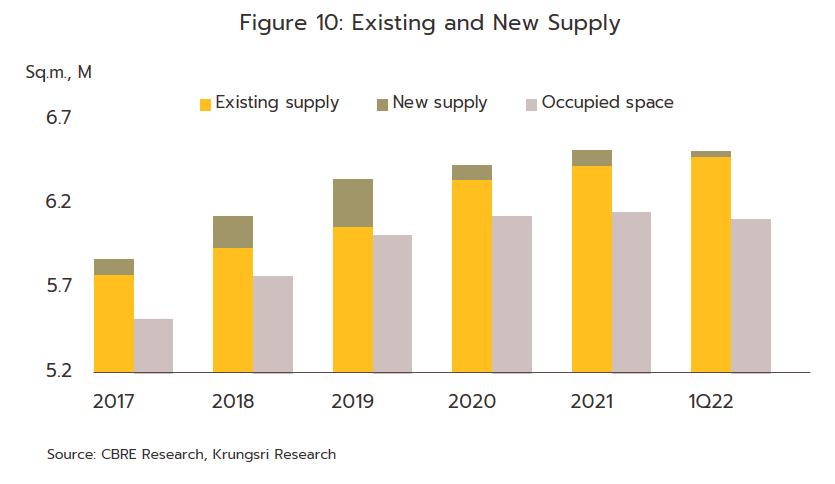
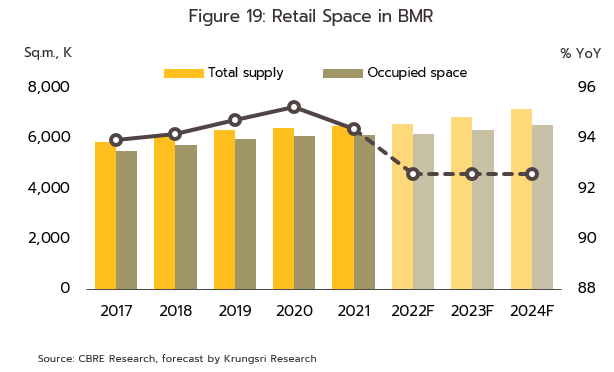
The supply of retail space increased by just 94,000 sq.m. in the year, a rise of 4.8% from 2020. New developments were held up by retailers slowing their rate of expansion or actually reducing their floorspace, while labor shortages also forced the postponement of a number of projects. In addition, much of the new supply was in fact space that had been shut for renovations and upgrades and that then returned to the market. Overall, the supply of retail space totaled 6.5 million sq.m. in 2021, somewhat above demand of 6.2 million sq.m. (Figure 10).
-
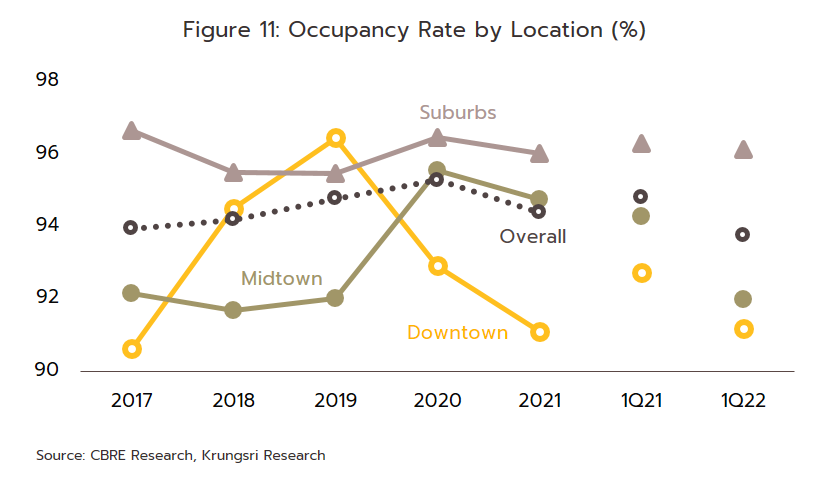
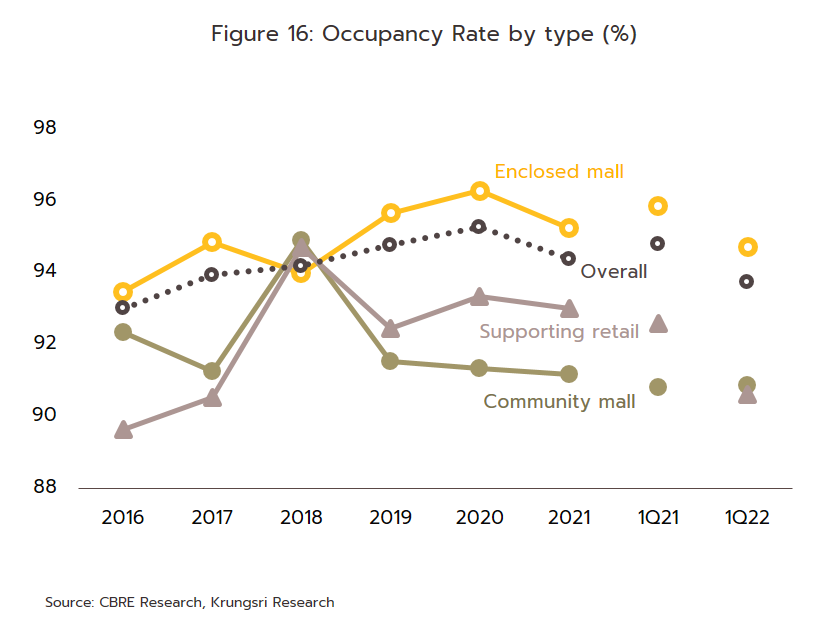
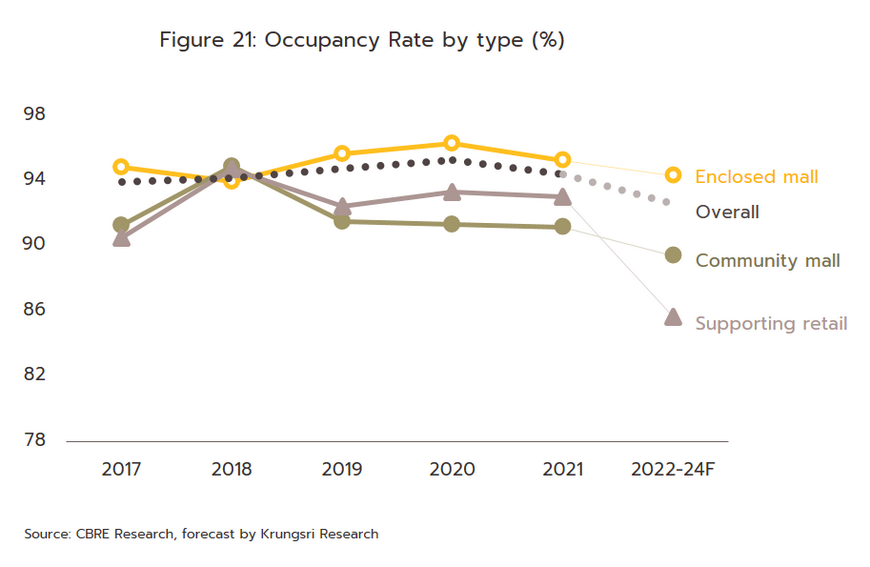
Occupancy rates slipped only slightly, dropping from 95.3% in 2020 to 94.4% in 2021 and thus remaining not far off their pre-Covid level. This was because supply is dominated by relatively few players that each rent to many retailers and brands, which then helps them to assign retailers to shopping units effectively and so manage their space more efficiently. Landlords also helped by reducing or suspending rent payments from the start of the lockdown in 2020, and thanks to this, occupancy rates dropped only fractionally. However, within the downtown areas, renters were still faced with the burden of shouldering high rents, and so a number had no choice but to abandon their leases and this then pushed occupancy rates to a five-year low (Figure 11). Against this, the more favorable rates for retail space in midtown and suburban areas meant that in these parts of the BMR, occupancy rates dipped only slightly.
-
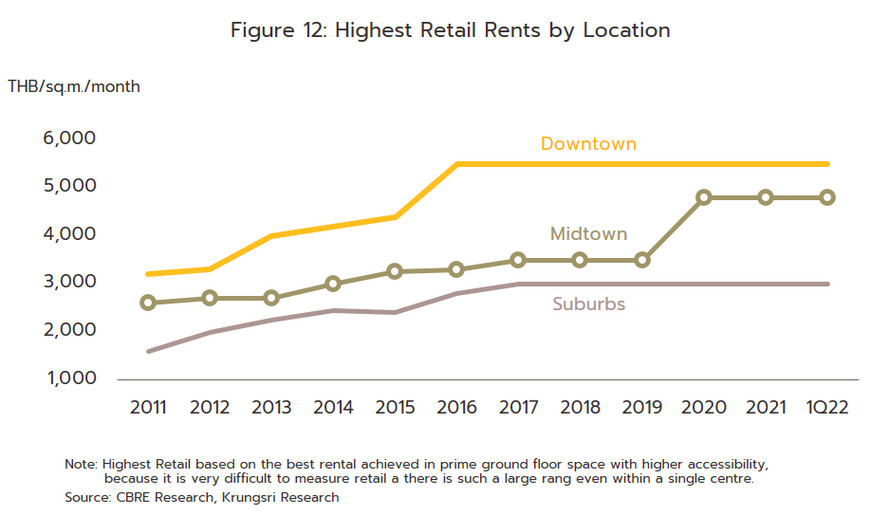
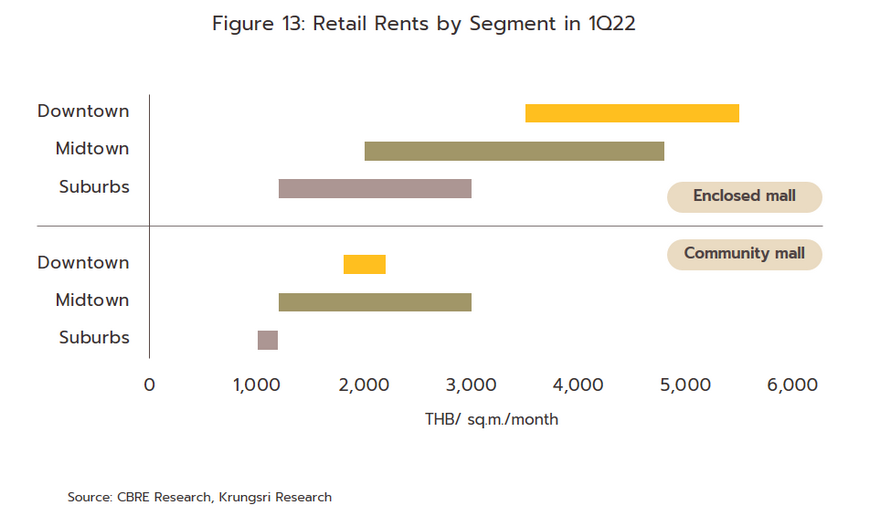
Overall, rental rates remained flat relative to a year earlier, partly because landlords looked to maintain earlier high rents. This was especially true for downtown (or CBD) locations, where rents stayed at an average of THB 5,500/sq.m./month for the 7th year. Midtown rents averaged. THB 4,800/sq.m./month, also broadly unchanged following a rise in 2020 that was triggered by the extension of metro lines (the Mo Chit-Saphan Mai-Khu Khot section of the Green Line and Bang Sue-Tha Phra extension to the Blue Line) that then helped increase access to these locations. In addition, average rents were boosted by upgrades and improvements to properties at Central Plaza Lad Phrao and Pinklao and The Mall Bang Kapi. Meanwhile, rental rates in the suburbs stood at THB 3,000/sq.m./month for the 6th year (Figure12). Considered by segment, rates for enclosed malls averaged THB 1,200-5,500/sq.m./month, above average rates of THB 1,000-3,000/sq.m./month for community malls (Figure 13).
Recovery showed signs of slowing through 1H22. On the positive side, demand was boosted by the relaxation of COVID-19 controls, the reopening of Thailand to foreign tourists (between 1 January–30 June, around 1.6 million arrivals were recorded), and the effect of government stimulus packages (e.g., the ‘Shop Dee Mee Kuen’ (Tax Rebate for Shopping Campaign) and phase 4 of ‘Khon La Khrueng’ (Let’s go Halves) and ‘Rao Tiew Duay Kan’ (We Travel Together) programs). However, the Russia-Ukraine war has pushed up the cost of energy and with this, added to prices for construction materials and the cost of living generally. Headwind putting pressure on consumer purchasing power, most notably for low-income earners, though middle-income and richer consumers are also increasingly careful about their spending. The impact of these processes is being amplified by the high level of household debt (89.2% of GDP as of 1Q22) and soft consumer confidence, which remained depressed through to 2Q22. As a result, some retailers have had to close their businesses and abandon their leases, though this has been most pronounced for fashion retailers (which are able to switch to online distribution) and smaller restaurants that do not operate extensive chains. By contrast, brand names and operators of large retail networks are tending to move forward with expansion plans (source: Phoenix Property). In response to these challenging conditions, owners of retail space are continuing to reduce rents or to hold these steady as they try to keep units occupied. The situation is summarized below.
-
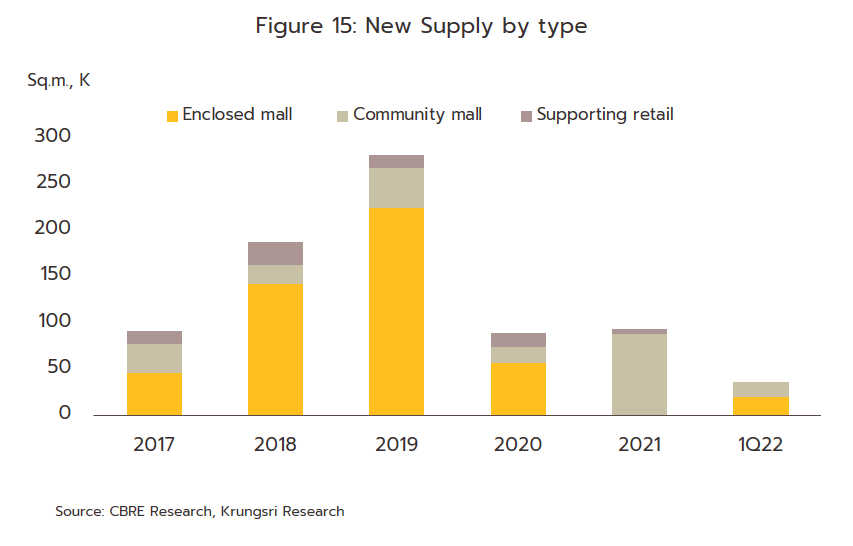
New retail space coming to market (correct as of 1Q22) comprised 4 new projects: Phase 2 of Central Village, At Ekkamai, At Saima Park Avenue, and Sai Mai Avenue. These have a combined floorspace of 36,200 sq.m. and so this represented a significant expansion in supply relative to 1Q21’s increase of just 5,000 sq.m. This then brought the total supply of retail space in the BMR to 6.5 million sq.m. (+1.2% YoY), while demand slipped from 6.2 million sq.m. at the end of 2021 to 6.1 million sq.m. (+0.1% YoY).
-
Occupancy rates averaged 93.8%, down slightly from the 94.4% recorded at the close of 2021. This was a result of a combination of increasing supply and softening demand for enclosed malls (-1.5% YoY) and supporting retails (-2.4% YoY), where some renters did not extend leases or moved to reduce their retail footprint.
-
Average rental rates remained mostly unchanged from the end of 2021. Landlords have been more concerned with keeping tenants in place than with hiking rates, and so as leases have expired, rather than increasing rental rates, these have tended to stay flat. However, rents have been cut in some locations, though this is only in individual projects and this has generally been a temporary reduction put in place to attract new retailers.
The situation for individual segments of the market is given below.
-
Enclosed malls
-
These projects tend to have a large footprint, usually somewhere between 70,000 and 200,000 sq.m. To meet demand from expanding housing projects and growth in business activities, most enclosed malls are located in suburban areas. Examples of these include Mega Bang Na, CentralPlaza Chaengwattana, CentralPlaza Salaya, Central Westgate and Central Festival Eastville. Moreover, restrictions imposed by town planning regulations and the shortage of suitable sites in downtown locations has encouraged investors in properties there to focus instead on renovations and improvements to better meet demand from international tourists and high-income earners.
-
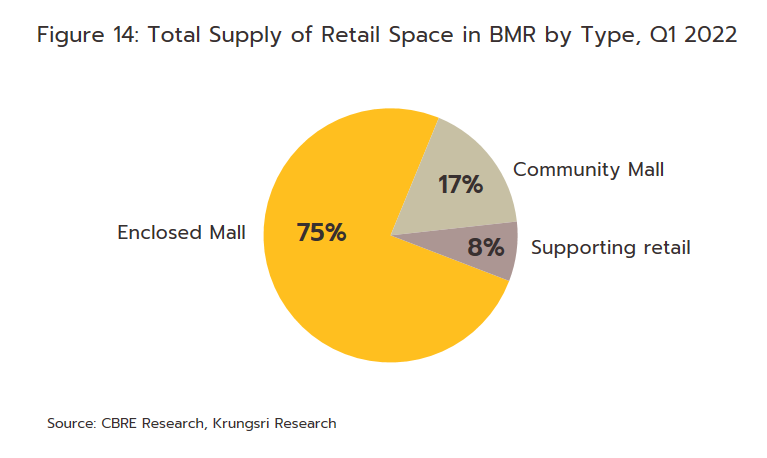
At 4.9 million sq.m., the 2021 supply of space in enclosed malls stayed unchanged from its level in 2020. (This represented 75% of the supply of all retail space). However, the prolonged COVID-19 pandemic weakened demand, which dropped -1.1% YoY to 4.7 million sq.m., and as such, the 2021 occupancy rate averaged 95.3%, down from 96.3% a year earlier.
-
In 1Q22, 1 new enclosed mall opened for business. This was phase 2 of Central Village, which had a footprint of 20,000 sq.m., though the total supply of space contracted -0.3% YoY on the closure of a downtown mall. Demand also slipped, dropping -1.5% YoY while the overall occupancy rate edged down to 94.7%.
-
Community malls
-
Developing community malls does not generally require excessive investments, though these can run in size from just 3,000 sq.m. up to 20,000-30,000 sq.m. 54% of community malls are in the suburbs, with the supply of these exploding by an average of 18% per year between 2012 and 2016 but rising competition both between community malls and with other types of shopping centers has meant that some developments have failed and have had to be abandoned. Thus, over 2017-2020, supply growth slowed to an average of just 2.6% per year.
-
In 2021, supply expanded at its fastest rate in 5 years, with 88,350 sq.m. of new retail space coming to market (by comparison, in 2020, new supply came to just 16,700 sq.m.) This then took the total supply of space in community malls to 1.1 million sq.m. (17% of all retail space in the BMR), up 8.3% from 2020. This strong showing can be attributed to the COVID-19 pandemic since this encouraged consumers to avoid crowded indoor spaces and instead spend more time engaged in shopping and other activities closer to home. Beyond this, urban sprawl into suburban areas is being encouraged by the development of communications networks that make travel in and out of the city center easier and more convenient, and this then helped to lift demand for retail space by 8.1% to 1 million sq.m. At the same time, at 91.2%, the occupancy rate remains unchanged from 2020.
-
In 1Q22, 3 new community malls opened for business: Sai Mai Avenue, At Saima Park Avenue, and At Ekkamai. These had a combined floorspace of 16,200 sq.m., which then added 8.96% YoY to total supply. Demand rose 9.02% YoY and the occupancy rate thus remained relatively stable at 90.9%.
-
Supporting retails
-
The majority of these units are in mixed-use[3] developments, and so the types of renters that will be attracted will depend on the other activities going on onsite. For example, if the supporting retails are located inside an office development, renters will tend to be food and beverage retailers looking to meet demand from office workers. By contrast, supporting retails in a hotel are more likely to sell souvenirs.
-
The supply of supporting retails increased 0.3% YoY to a total of 0.49 million sq.m. in 2021 (8% of all retail space in the BMR). Demand came to 0.46 million sq.m., close to its 2020 level, and so the occupancy rate was likewise largely unchanged at 93.0%.
-
No new units came to market in 1Q22. This was due to the closure of construction workers’ residential camps in 3Q21, which then created a labor shortage that forced the postponement of work on many projects. Supply edged down -0.3% YoY in the period, while demand slipped by -2.4% YoY, and the discrepancy between these two means that the occupancy rate fell to 90.6%.
OUTLOOK
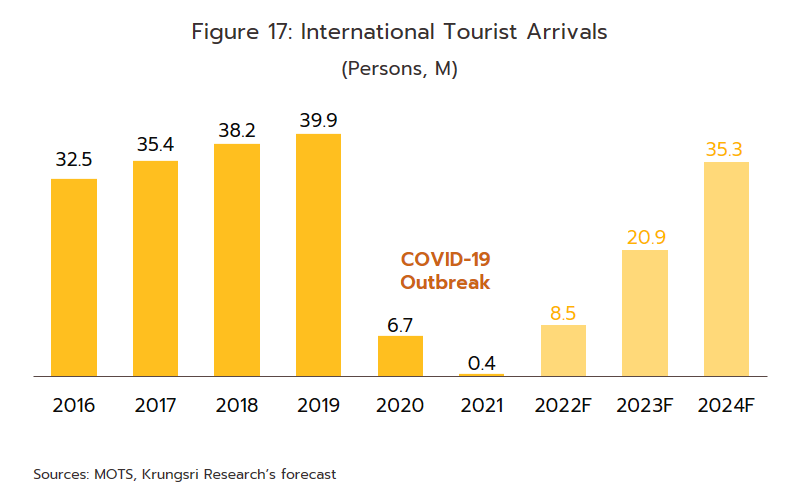
The market for retail space is slowly recovering through 2022 as worries generated by the COVID-19 pandemic ease and consumers become more confident about spending time in public. Economic growth is thus forecast to accelerate from 2021’s 1.6% to 3.1% this year, helped by the complete reopening of the country on 1 June and the boost that this will give to the tourism sector; this year, 8.5 million foreign arrivals are expected compared to just 0.43 million in 2021. The economy is being further lifted by government stimulus packages that aim to support consumer purchasing power and to encourage domestic tourism. These include phase 5 of the ‘Rao Tiew Duay Kan’ (We Travel Together) program, which has a target of increasing domestic tourism from 53 million trips in 2021 to 160 million trips in 2022[4]. However, the prolongation of the Russia-Ukraine war has underpinned a steep run-up in the price of oil and this has then translated into a sharp increase in inflation, an erosion of purchasing power, and only limited growth in consumption. Krungsri Research thus estimates that for 2022 as a whole, around 95,000 sq.m. of new retail space will become available. This would represent an increase of 14% on last year’s expansion in supply but pend-up demand would grow by 1.0%, and the difference between these two will therefore imply a slight decline in the occupancy rate.
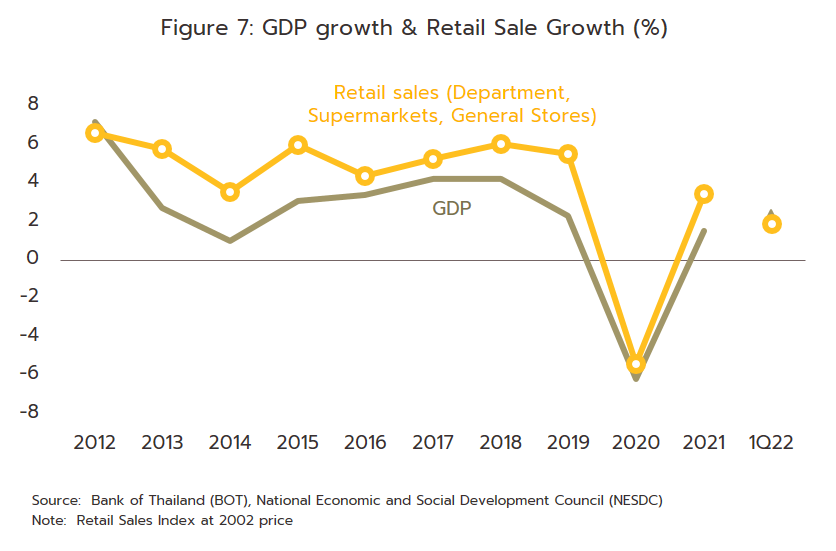
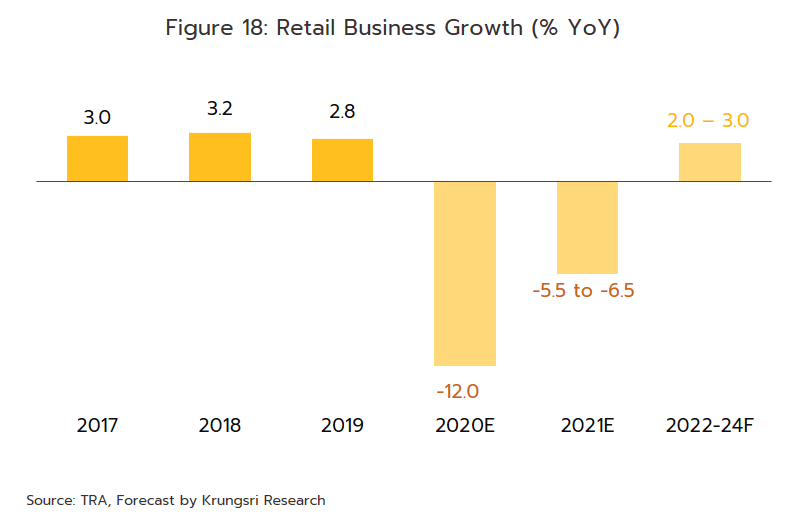
Demand for retail space is forecast to strengthen at an average rate of 2.9% annually through 2023 and 2024 (over 2017-2019, growth averaged 3.7% p.a.). This outlook is supported by: (i) economic growth that is expected to run to 3.0-4.0% per year, which will then lift private consumption; (ii) the injection of funds into the economy that will happen via progress on the buildout of new infrastructure by the government; and (iii) much stronger spending by tourists, with recovery in the tourism sector forecast to bring arrivals to 21 million in 2023 and 35 million in 2024 (Figure 17). These trends will then help to lift consumer sentiment and to encourage greater spending, which should then feed into an anticipated 2-3% annual expansion in retail sales (Figure 18) and through this, into increased demand for retail space.
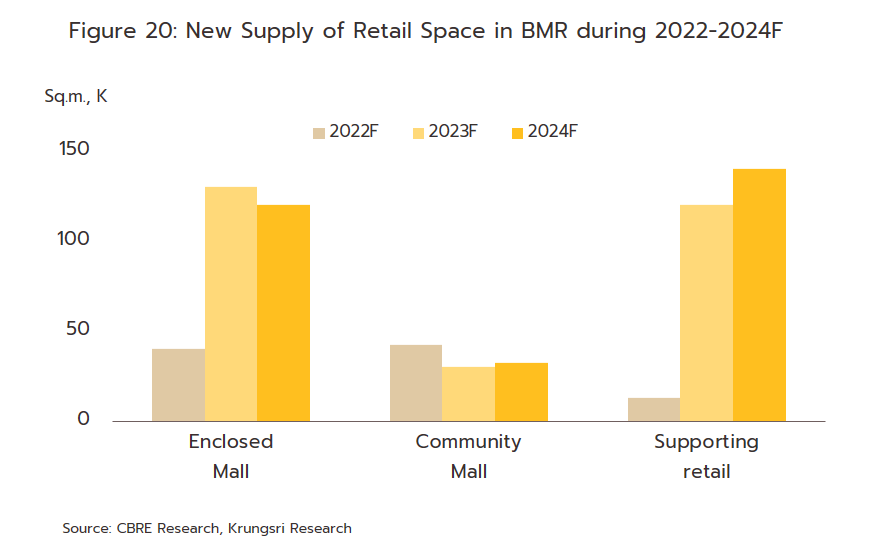
Developers will tend to add to supply through the next few years as they look to meet recovering demand from retailers. This will be particularly notable international brands that target upper-income consumers and that are continuing to expand their presence in Thailand (in 2021, many luxury brands increased their shop space in Thailand’s leading shopping malls). The majority of these will look for units that are either in mixed-use developments or in large developments in the downtown area or on the Chaophraya riverfront[5]. Nevertheless, problems with labor shortages will mean that some developments will have to be postponed. Overall, supply should expand by around 0.7 million sq.m. through the 3 years from 2022 to 2024, equivalent to an annual average growth of 3.3% (Figure 20), and a fall in the occupancy rate to around 93%. At the same time, rental rates are expected to remain broadly flat, though they may increase slightly for downtown locations and fall for properties elsewhere.
-
Enclosed malls: Supply will likely continue to expand in both downtown/CBD areas and in more suburban locations where new housing developments are being built (e.g., around Thanon Ratchaphruek ). The majority of these developments will be large-scale shopping malls, but because demand will only grow slowly, the occupancy rate will slip to around 92% (compared to an average of 94.9% over 2017-2019).
-
Community malls: Supply will expand strongly given the effects of the COVID-19 pandemic on consumer behavior, particularly with regard to the encouragement it has given to shoppers to prefer shops close to their homes. In addition, 2022 will be the first year that charges liable under the new land and buildings tax will be collected in full, and some developers will respond to this by using their land holdings to build community malls. However, this is likely to be most pronounced in suburban areas and regions around Bangkok, such as Rangsit, Phutthamonthon, Nakhon Pathom, and Samut Sakhon (in 2022, supply of new space in community malls is forecast to hit its highest since 2015). This is because community malls have the advantage of being relatively small and cheap, and land suitable for their development is easy to locate. However, growth in demand will move with what is likely to be only a gradual improvement in the outlook for the economy and so occupancy rates will slip to an average of 89% (down from an average of 92.6% over 2017-2019).
-
Supporting retails: Supply in urban areas is forecast to jump by an average of 20% per year, with this concentrated especially in downtown locations where major developers are rushing to push through large mixed-use projects. A large number of these projects are currently underway and as these are completed, at least 0.1 million sq.m. of new supply is expected to come onto the market annually. The majority of this space will be rented to companies targeting customers already using the other services available in the same mixed-use development (i.e., for work, meetings, or using business services, exercise facilities, or residential services). Growth in demand is forecast to lag behind the expansion in supply and so the occupancy rate will weaken from the 92.6% maintained over 2017-2019 to around 86%.
Challenges within the industry largely stem from the need to deal with rising competitive pressure that is coming from three main sources. (i) Players within the industry have extensive plans to increase investments in retail space, especially in large mixed-use projects, the supply of which is expected to double over 2022-2024 compared to the average for the previous 5 years. At the same time, demand for retail space to rent will grow at a slower pace, and this will add to competition. This will be amplified by the development of transport and logistics networks over the past few years and the effect of these on changes in land use for high-potential sites. The result of this will likely be to trigger business failures in some areas, especially for smaller retail rental operations. (ii) E-commerce is playing a more prominent role in the retail sector and this may eat into demand for physical retail space. The Thai Retailers Association estimates that because Thai consumers are increasingly comfortable making online purchases, in 2023, online sales will account for over 10% of all retail sales, up from just 2.0-3.0% in 2019. This thus presents an increasingly severe threat to spending that takes place outside the home. (iii) Low-rise retail developments (e.g., standalone shops in high-income areas and retail units in service station rest areas) are rapidly increasing in number as new housing developments spring up in suburban parts of Bangkok and the surrounding region. These have the advantage of low construction costs, and the growth of this segment may affect demand elsewhere in the market.
[1] Retail Space is defined as shopping malls are sub-divided into enclosed malls, community malls and supporting retails.
[2] Major regional centers’ refers to important tourist destinations and centers of economic development in the regions of the country, excluding the five provinces surrounding Bangkok. Examples include Chiang Mai, Nakhon Sawan, Phitsanulok, Khon Kaen, Nakhon Ratchasima, Chonburi, Rayong, Phetchaburi, Prachuap Khiri Khan, Songkhla, Surat Thani, Krabi, Phang Nga and Phuket.
[3] Mixed-use real estate developments include both commercial and residential uses. Mixed-use developments may thus contain retail units, office space and residential within the same project.
[4] Forecast by the Tourism Authority of Thailand
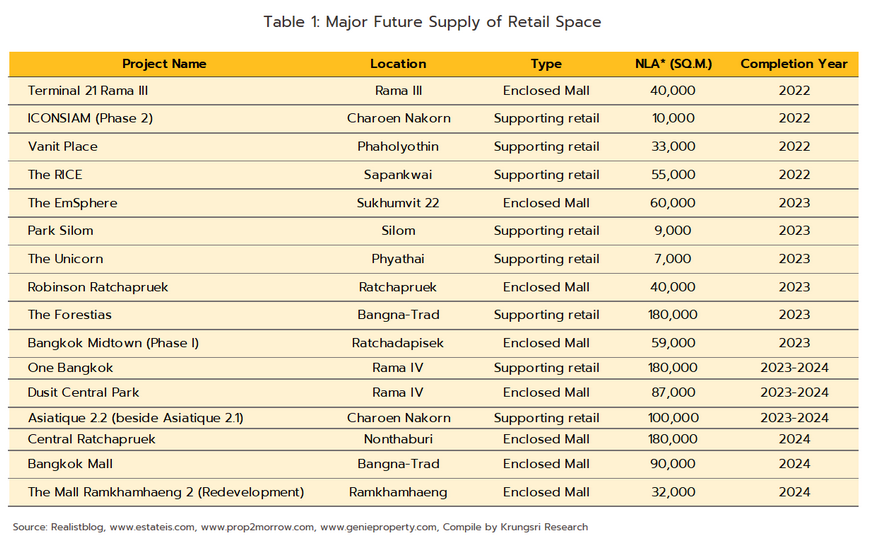
[5] e.g., The Emsphere, Terminal 21 HarborLand, Central Village (phase 2), Smile Square, Icon Siam (phase 2), Bangkok Mall, The Forestias, Dusit Central Park, and One Bangkok.


.webp.aspx)