EXECUTIVE SUMMARY
From 2023 to 2025, overall output by the Thai seafood processing industry is expected to contract by between -0.5% and -1.5% annually, with exports predicted to slide at a slightly faster rate of between -1.0% and -2.0% per year. Output will come under pressure from official quotas that will reduce the size of the catch and from the higher cost of inputs, in particular of animal feed and fuel for trawlers. Alongside this, expensive energy will also push up processing costs. Exports will be impacted by falling demand in the industry’s main overseas markets as buyers increasingly turn to cheaper imports from China, Ecuador, and Vietnam, which enjoy trade agreements with many countries. Thai exports will in addition be exposed to more intense non-tariff trade barriers, especially from the US and the EU. Meanwhile, the domestic market is forecast to expand by 4.0-5.0% per year. Sales will be boosted by increasing rates of urbanization and recovery in the tourism industry, which will support greater demand from hotels, restaurants (especially fast-food outlets), and food processors as the market adapts to changing consumer lifestyles and greater demand for food that is fast and convenient to prepare and eat.
Krungsri Research view
The Thai seafood processing industry will experience some challenges from 2023 to 2025 as exports fall under pressure from the rising cost of labor, fuel, and aquatic animals as the catch size declines as well as higher import prices. At the same time, competition in global markets will intensify from lower-cost competitors in China, Ecuador, Vietnam, and India. This will then have significant impacts on income and profitability, even though this will be partly offset by the expected gradual expansion in the domestic market.
-
Producers of processed and frozen seafood: The reopening of the country and the resulting rebound in demand from restaurants and the tourism sector will mean that businesses that target the domestic side of the market will enjoy an improving outlook. However, businesses that are primarily focused on export markets will likely see softer income as they are forced to compete on price with players from countries that have lower costs and greater access to inputs (e.g., shrimp from Ecuador and squid from China).
-
Producers of canned seafood: The relaxation of Covid-19 controls in Thailand has allowed economic activity within the country to bounce back. As the domestic market recovers, income from sales within Thailand will increase. However, income from exports will likely remain flat or possibly contract slightly, as purchasing power in many export markets has not yet recovered. Meanwhile, the signing of a bilateral free-trade agreement between China and Ecuador and the threat of increased non-tariff barriers to trade will add to competitive pressures. Given this, the space for raising prices in line with the higher cost of inputs and energy will narrow, and with this, players’ ability to generate profits will weaken, especially for SMEs.
-
Aquaculture farms: Operators will come under pressure from rising costs (for food, labor, electricity, and the farm improvements required to meet official standards), periodic outbreaks of disease, climatic changes that are impacting farm water temperatures, and stiff competition on price from cheap imports. As such, there will be only limited room within which operators may produce profits.
-
Fisheries operations: (excluding fishing that is undertaken primarily to provide inputs to a company’s own operations): Although demand from seafood processors will tend to increase, this will largely be met by imports, while most operators of trawlers do not have regular buyers, adding to uncertainty and the possibility of losing market share. In addition, operators will have to shoulder the higher cost of fuel, manage problems with labor shortages, make investments in the equipment needed to meet the EU’s regulations on unreported and unregulated fishing (IUU fishing), pay for checks on trawlers, and deal with periodic closures of fishing grounds to allow stocks to breed. There is thus a risk that operations may turn to loss-making.
-
Chilled and frozen seafood storage facilities: Demand for facilities to store seafood is forecast to remain flat on broadly unchanged output and distribution of frozen processed seafood products, but due to the significant oversupply to the market, competition in the provision of storage services is fierce. This situation has arisen because the major producers of processed seafood have invested in building their own storage capacity to be sure of meeting the requirements of export countries/ traceability standards, and as such, independent operators of chilled and frozen storage facilities are in a weak bargaining position relative to their customers. Moreover, the cost of the energy and fuel needed to operate cold storage facilities remains elevated and so turnover is expected to shrink.
Overview
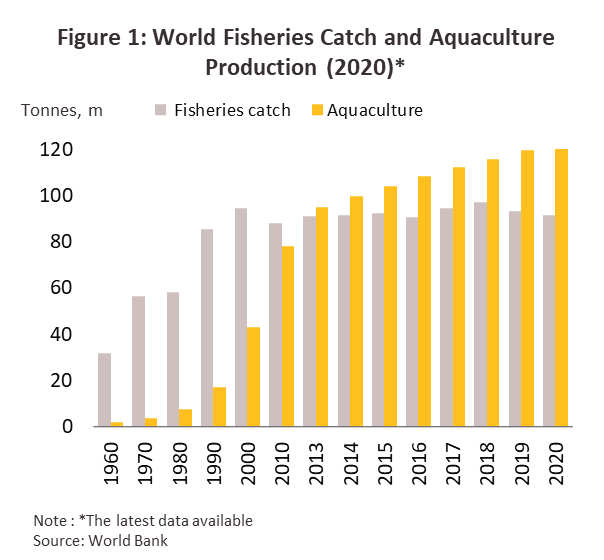
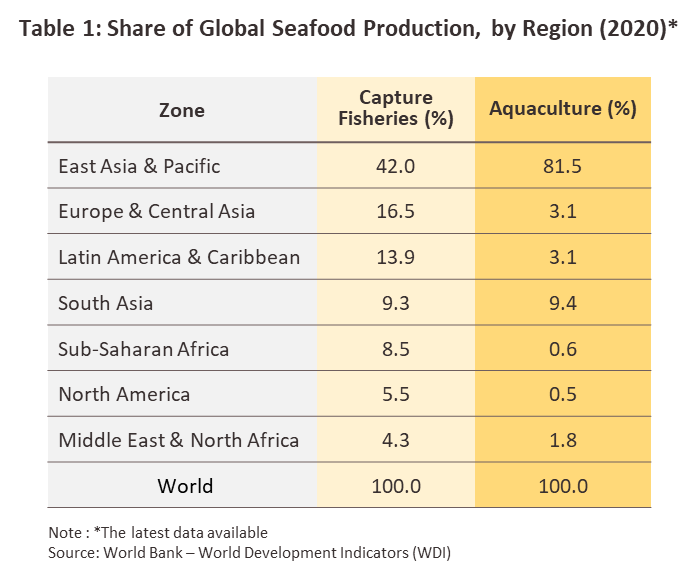
The global seafood supply chain is sustained by two primary sources of inputs: fisheries and aquaculture. As of 2020, the total global supply of seafood came in at 214 million tonnes. This historic high was split between 91.3 million tonnes (or 42.7%) that came from fisheries and 122.6 million tonnes (or 57.3%) that came from aquaculture (World Bank, 2023). Global sources of seafood are concentrated in the Asia-Pacific region since local conditions make this an ideal site for the source (of seafood). The combined total of wild-caught and farmed products originating in Asia, therefore, accounts for 64.6% of all global output of seafood. In terms of the separate parts of this, 42.4% of the world’s wild-caught fish and seafood originates in Asia, whereas a full 81.5% of the global supply of farmed fish and seafood comes from the region. The relative importance of these two sources is changing and since 2013, most of the seafood consumed around the world has come from farmed rather than wild sources. Rising investment in aquaculture farming has been driven by a combination of: (i) the need to replace declining stocks that have been overfished; (ii) rising consumption, which has climbed by an average of 3% annually since 1960, lifting per capita averages from 9.9 kg/person to 20.2 kg/person1/ in 2020; and (iii) the negative impacts of climate change on global seafood supply chains (Figure 1 and Table 1).
In addition to the region’s natural resources, players based in Asia also have advantages in terms of access to a sizeable, skilled, and low-cost labor force. These factors have helped to make Asia the world’s foremost exporter of processed seafood, and so as of 2021, 49.4 million people were employed in the region in the seafood processing industry (on both the fisheries and aquaculture sides of the business), or 84.4% of the global total2/. It is therefore perhaps unsurprising that the Asia-Pacific region is the world’s primary source of processed seafood, providing 36.6% (or USD 61 billion) of global supply by value, the latter worth approximately USD 170 billion3/. Among these exports, the most important product categories are chilled and frozen, canned, and cooked and processed seafood.
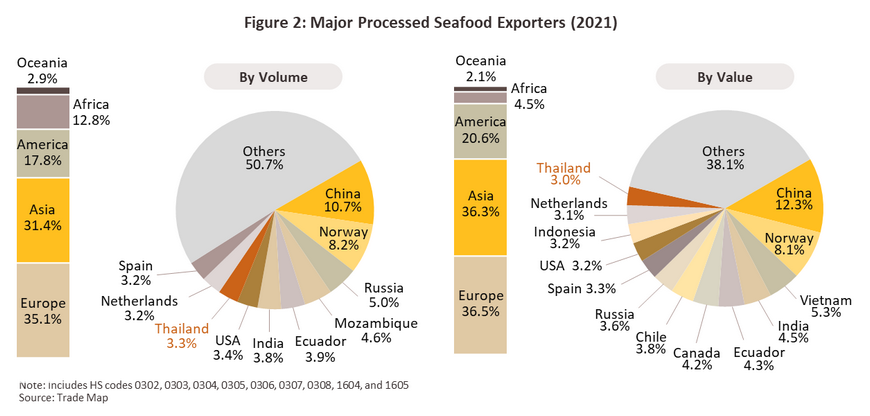
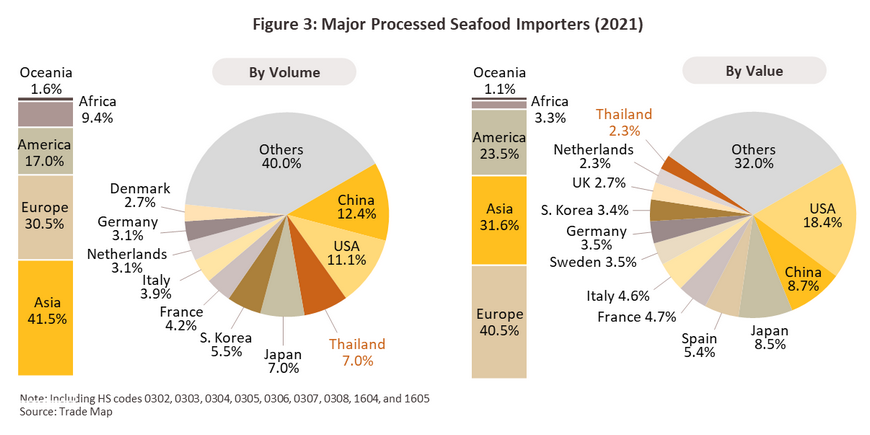
In terms of originating countries, as of 2021, China was the world’s most important exporter of processed seafood, having a 10.7% market share. China was followed by Norway (8.2%), Russia (5.0%), and Mozambique (4.6%) (Figure 2). As for importers of processed seafood, China was again in the lead, with a 12.4% share of all global imports, followed by the United States (11.1%), Thailand (7.0%), Japan (7.0%), and South Korea (5.5%) (Figure 3).
Against this global backdrop, Thailand is the world’s 8th biggest exporter of processed seafood by volume and 14th most important by value, with respectively a 3.3% and 3.0% share of the global market. A number of factors have helped the country develop its domestic industry, including its favorable geography because since much of Thailand consists of a long peninsular, there is ready access to the sea along two lengthy and fertile coastlines. The resulting extensive territorial waters that Thailand controls have been an abundant source of seafood, and this has also helped in the development of shoreline and inland fisheries, while Thailand also has advantages in terms of its access to a labor force that is skilled in preparing seafood but that is also relatively cheap to employ. Thus, current Thai labor costs come to USD 1.25/hour 4/, significantly less than in major exporting countries such as China (USD 3.19/hour 4/) and Norway (USD 19.5/hour5/)
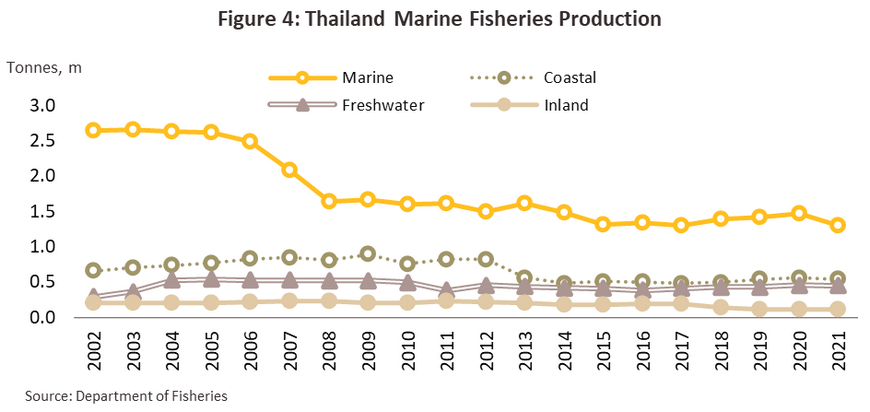
However, the size of Thailand’s marine catch peaked at 2.65 million tonnes in 2003 and has since declined by an average of -3.9% annually to reach just 1.30 million tonnes in 2021. Likewise, coastal aquaculture yields also hit a peak of 0.895 million tonnes in 2009 and have then dropped by -1.7% per year to reach 0.54 million tonnes in 2021 (Figure 4). These declines have been driven by: (i) general overfishing and fishing during the spawning season; (ii) habitat destruction; (iii) the rising cost of food and labor used in aquaculture operations; and (iv) outbreaks of disease on aquaculture farms. As a result, the supply of inputs to the Thai seafood processing industry has steadily contracted and players have not been able to expand output to meet rising global demand.
The Thai seafood processing industry6/ can be divided into two main segments. These are: (i) chilled and frozen seafood processing, which requires skilled labor that is able to carefully and precisely fillet and prepare seafood before it is frozen, thus maintaining the quality of products while allowing them to be stored for as long as possible; and (ii) canned, and processed and prepared seafood, which involves the processing of seafood with some kind of cooking to produce goods that are ready for consumption and that therefore have higher added value.
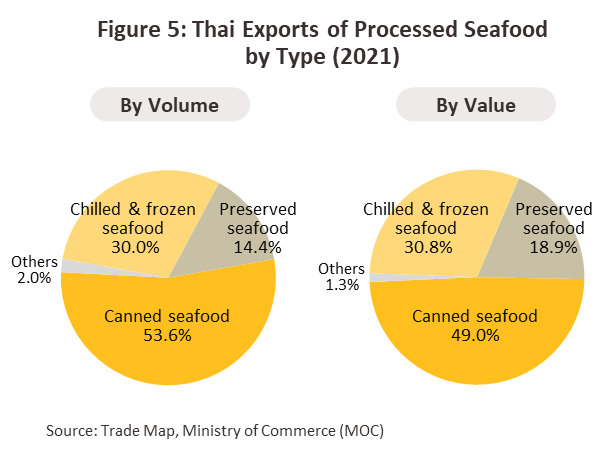
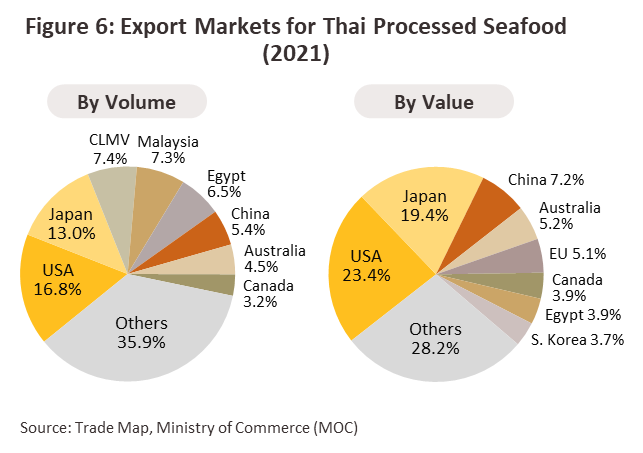
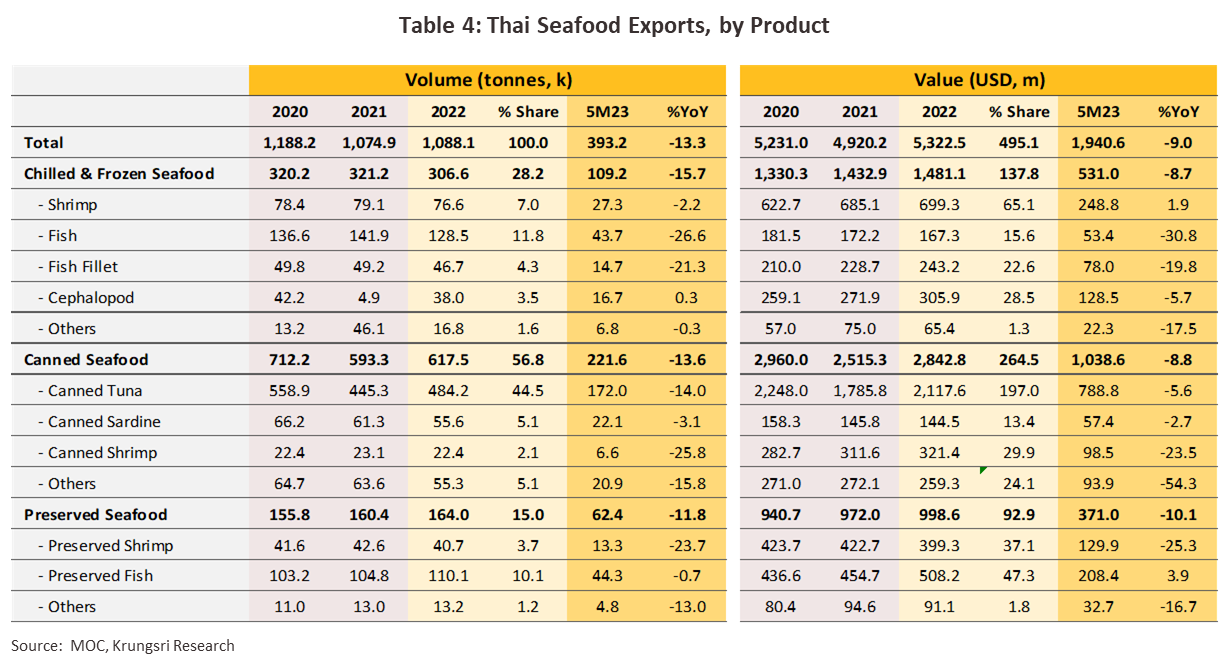
Combined output from the Thai seafood processing industry totaled more than 1.3 million tonnes in 2021, and sales of this then generated receipts of USD 61 billion. 76.4% of production was for export markets, and in the year, the most important product categories that were exported were canned products (53.6% of exports of Thai processed seafood), chilled and frozen seafood (30.0%), prepared and preserved products (14.4%), and other products (2.0%) (Figure 5)7/. The most important individual products were canned fish (46.3% of exports), chilled and frozen fish (17.4%), prepared and preserved fish (9.6%), chilled and frozen shrimp (7.4%), prepared and preserved shrimp (3.9%), frozen and chilled squid (3.2%), and canned shrimp (2.1%). As of 2021, Thailand’s main export markets were the US (16.8% of exports), Japan (13.0%), the CLMV nations (7.4%), Malaysia (7.3%), and Egypt (6.5%) (Figure 6).
The 23.6% of production that is not bound for export markets is consumed domestically, but because Thai consumers typically prefer fresh seafood, the market is somewhat limited. The goods most commonly consumed by domestic consumers are therefore canned sardines, and chilled and frozen fish and shrimp. Other types of processed seafood are also used by the fast-food industry, restaurants and hotels. However, demand for processed seafood within the country is growing in step with continuing urbanization and changing consumer behavior that is tending to strengthen the market for food that is quick and easy to prepare, and because seafood products are distributed through modern trade outlets, consumers have ready access to these.
The global chilled and frozen seafood industry
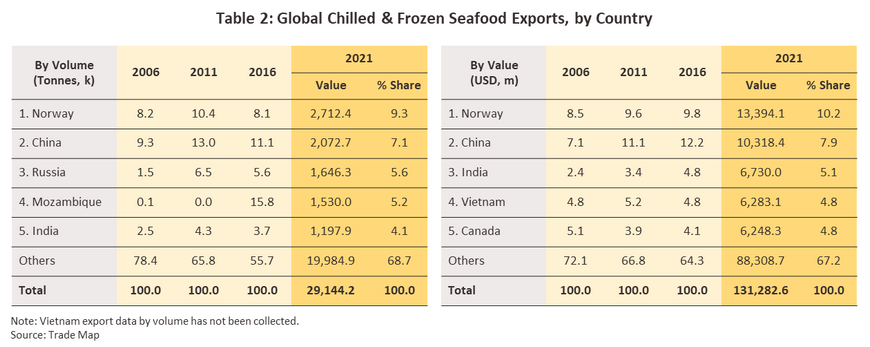
In 2021, a total of 29.1 million tonnes of chilled and frozen seafood worth USD 130 billion were traded on global markets8/. Norway was the world’s most important source of these products, accounting for 9.3% of the total, followed by China (7.1%), Russia (5.6%), Mozambique (5.2%) and India (4.1%) (Table 2), while with a 1.2% market share, Thailand sits in 25th place in the global rankings. The most important chilled and frozen products are fish, shrimp, squid, and cuttlefish, which together represent around 90% of global exports.
-
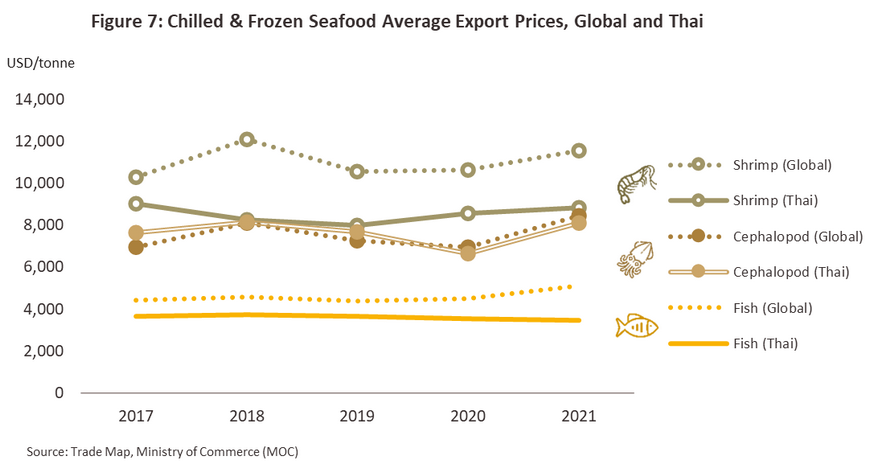
Chilled and frozen fish9/: Exports of these goods totaled 19.8 million tonnes and had a value of USD 74 billion, or 68.0% and 56.9% of the volume and value of all exports of chilled and frozen seafood globally, while export prices averaged USD 4,920/tonne. The most important exporters were in Europe (44.8% of the value of exports of chilled and frozen fish worldwide), but most of this trade is intra-regional. With a 12.7% share, Norway was the single most important source of exports, followed by Russia (7.7%), China (7.0%), the United States (4.7%), and Chile (4.5%). Thailand was in 28th position on this list thanks to its 1.0% share of the world market.
-
Chilled and frozen shrimp10/: Global exports of these goods came to 3.6 million tonnes and generated earnings of around USD 35 billion in the year. These thus accounted for a further 12.4% and 26.9% of the volume and value of all exports of chilled and frozen seafood. Average export prices came to USD 11,559/tonne. In terms of region, major exporters were in Asia (37.0% of all exports of chilled and frozen shrimp by volume). By country, the most important exporters were Ecuador (23.7%), India (19.2%), Canada (5.9%), Indonesia (5.4%), and Argentina (4.6%). With a 2.8% market share, Thailand was the world’s 8th most important exporter of these products.
-
Chilled and frozen squid and cuttlefish11/: The last major product group in this segment, chilled and frozen cephalopods (squid and cuttlefish) brought in USD 14 billion in export earnings from the sale of 2.8 million tonnes of goods, or 10.8% of the value and 9.6% of the volume of the segment. Export prices averaged USD 8,470/tonne in the year. As with shrimp, the main exporters were in Asia (46.6% of all exports by volume). By country, China was the world’s most important source of chilled and frozen squid (18.3% of the volume of global exports), followed by Peru (10.5%), Spain (8.1%), Indonesia (6.2%), and India (5.7%). Thailand had a 1.5% share of the world market and stood in 18th place in the global rankings.
The Thai chilled and frozen seafood industry
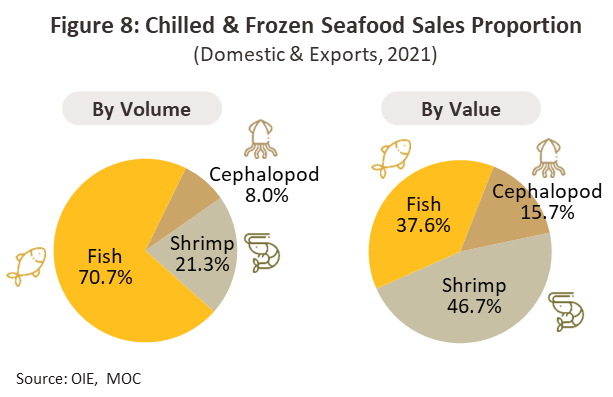
In 2021, yields to the domestic chilled and frozen seafood industry came to 240,500 tonnes12/, though the total weight of goods distributed to domestic and international markets totaled 562,700 tonnes and this then generated around USD 2.2 billion in receipts13/. Domestic production was insufficient to fully meet demand and so Thai players imported seafood for further processing, a part of which was used to produce high value-added final finished products. Details for the major product groups are given below (Figure 8 and Figure 9).
-
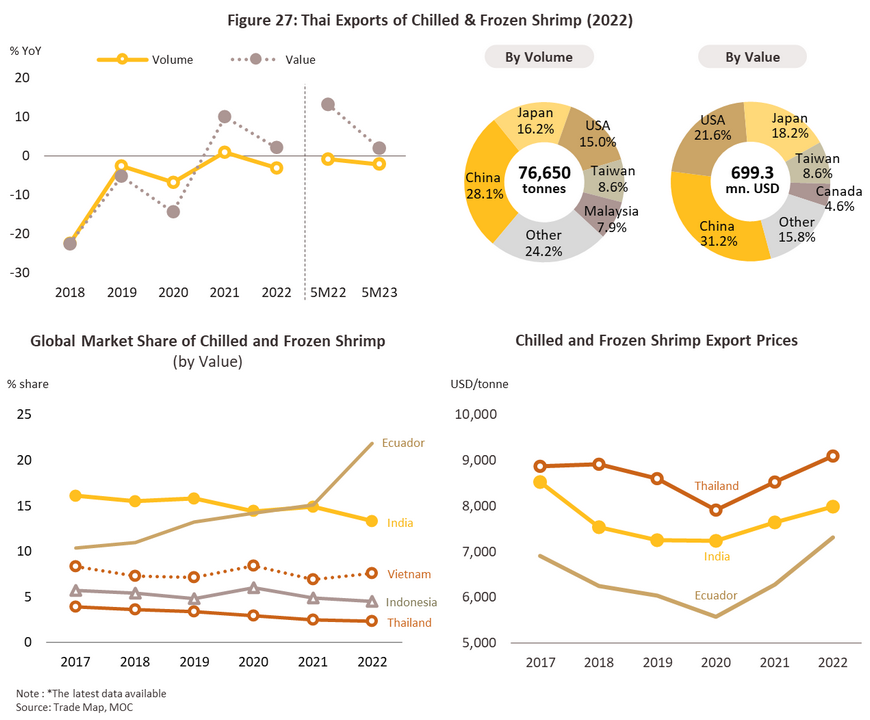
Chilled and frozen shrimp14/: In 2021, domestic shrimp yields totaled 109,400 tonnes combined. Because production involves related upstream industries within the country, including hatcheries, nurseries and farms (most of which raise Pacific white shrimp), shrimp processing has a longer, more involved supply chain than do other chilled and frozen seafood products15/. However, the outbreak of shrimp early mortality syndrome (EMS) in 201216/ resulted in a drop in output from 610,000 tonnes in 2011 to 309,000 tonnes a year later, and this pulled exports down from 190,000 tonnes in 2012 to 90,000 tonnes in 2021. Periodic outbreaks of EMS continue to be reported, as do those of white spot17/ and yellow head diseases18/, and because production has not returned to its pre-outbreak levels, suppliers have had to compensate for weak domestic yields by increasing imports. In 2021, Thailand thus imported 32,500 tonnes of chilled and frozen shrimp. The main source of this (44.6% of imports) was Ecuador, which was followed in importance by Argentina (26.3%), Myanmar (10.2%), and India (4.0%). In total, Thai players distributed 119,900 tonnes of chilled and frozen shrimp to the market, and this then accounted for 21.3% of all sales of chilled and frozen seafood. 40,300 tonnes of this (33.6% of the total) went to the domestic market, while the remaining 79,100 tonnes (66.0%) were consumed on export markets. These sales then generated USD 685.1 million in receipts, with the main markets for Thai shrimp being in the US (20.3% of all sales), China (18.9%), Japan (14.6%), Myanmar (13.5%) and Malaysia (8.7%).
-
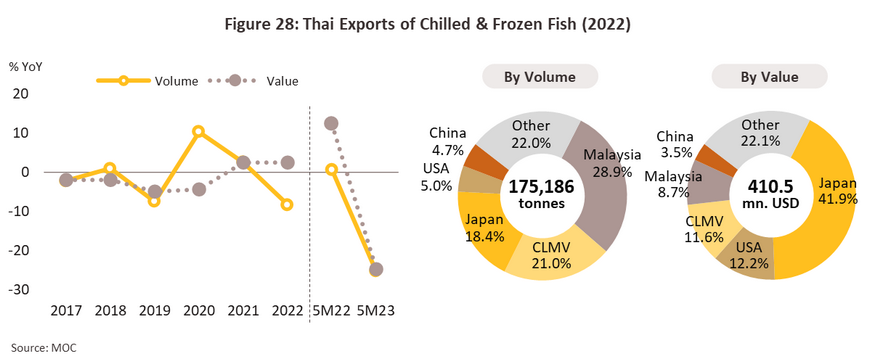
Chilled and frozen fish9/: At 113,400 tonnes, domestic yields were insufficient to meet demand for consumption and for use by the food processing industry, while market demands also tend to be for deepwater species that cannot be sourced from Thai territorial waters19/. Thai players compensate for this by importing fish for further processing and conversion into downstream products that are consumed on domestic and international markets. Imports, therefore, totaled 1.6 million tonnes, with the most important source being Myanmar (11.8% of imports), followed by Taiwan (9.1%) and Japan (8.0%). 398,100 tonnes of fish products were distributed in the year, which represented 70.7% of all chilled and frozen seafood products distributed by Thai players. Of this total, 206,600 tonnes (51.9% of the total) were bound for the domestic market, while the remaining 191,100 tonnes (48.1%) was consumed on export markets. This generated some USD 400.8 million in income, with the main overseas markets being in Malaysia (30.2% of exports of chilled and frozen fish), Japan (17.9%), the CLMV countries (15.2%), China (7.7%), and the UAE (5.4%).
-
Chilled and frozen squid and cuttlefish20/: Domestic yields came to 17,700 tonnes, which was insufficient to meet combined demand for consumption and processing, and so an additional 178,300 tonnes of products were imported. The most significant source for these was China, which provided 29.4% of imported squid, followed by Peru (23.1%) and Myanmar (15.1%). A total of 44,700 tonnes of chilled and frozen squid was distributed in the year, this thus comprising 8.0% of all Thai chilled and frozen seafood. This was split between 9,800 tonnes (21.9%) that went to the domestic market and 34,900 tonnes (78.1%) that was sold on overseas markets, the latter then bringing in earnings of USD 271.9 million. The main markets for this were in Italy (22.0% of exports of chilled and frozen squid), South Korea (21.1%), Japan (14.7%), China (10.5%) and the US (8.2%).

Global canned and prepared and preserved seafood industry
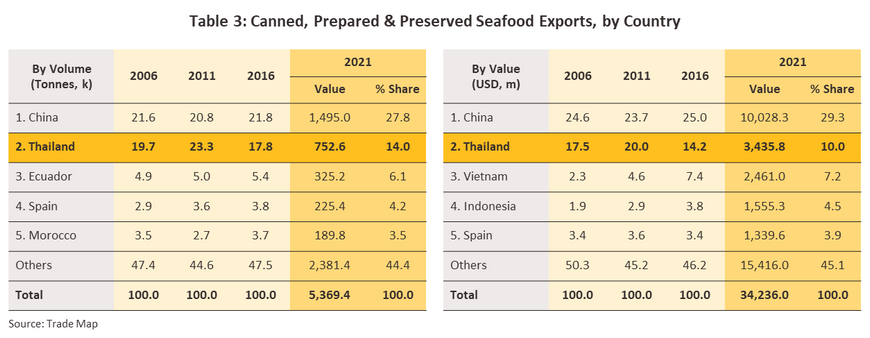
Global exports of canned and prepared and preserved seafood came to 5.4 million tonnes in 2021, and sales of this generated USD 34 billion in income. With a 27.8% share, China was the most important supplier to world markets, followed by Thailand (14.0%), Ecuador (6.1%), Spain (4.2%), and Morocco (3.5%) (Table 3). Details of the major product groups in this segment are given below.
-
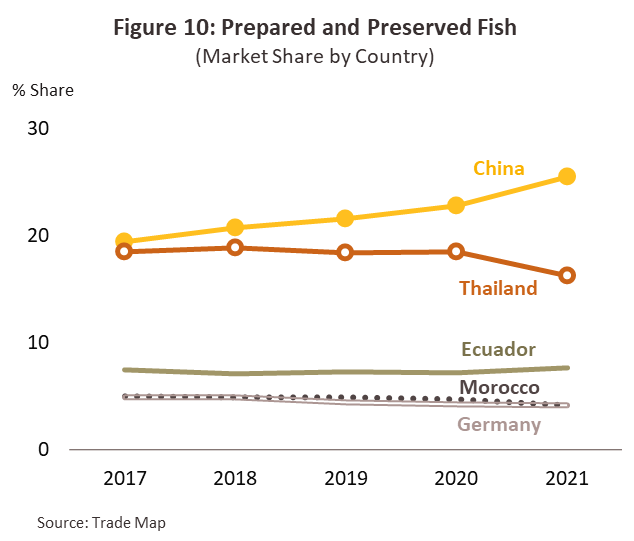
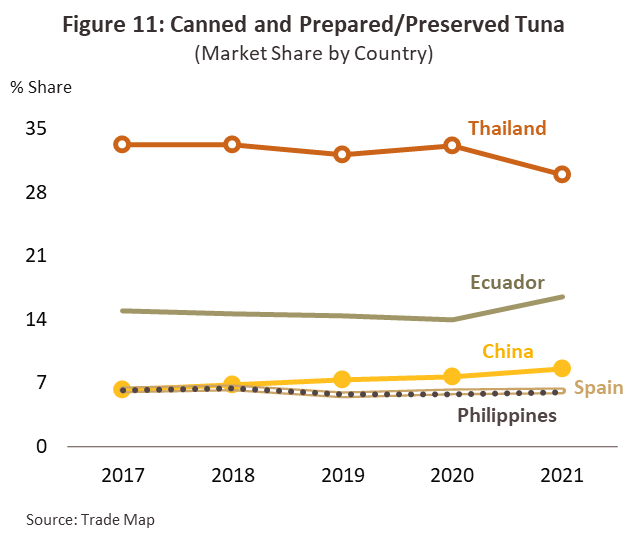
Canned and prepared and preserved fish21/: In the year, exports to world markets of 4.2 million tonnes of fish products generated USD 20 billion in income, and by volume and value, this represented respectively 77.2% and 58.8% of all exports of canned and prepared and preserved seafood. Export prices averaged USD 5,942/tonne in 2021. The world’s most important supplier of these goods was China, which had a 25.5% market share, followed by Thailand (a 16.3% share), Ecuador (7.7%), Morocco (4.2%), and Germany (4.2%) (Figure 10). Within this segment, the major export products are: (i) canned and prepared and preserved tuna, of which 1.6 million tonnes were sold on world markets (38.2% of all exports of canned and prepared and preserved seafood) and for which the main producing countries were Thailand (30.0%), Ecuador (16.5%), China (8.6%), Spain (6.1%) and the Philippines (6.0%) (Figure 11); (ii) processed fish products (e.g., fish balls, fish sausages, and minced fish), of which 0.6 million tonnes were exported (16.5% of the total); and (iii) canned sardines, of which 0.4 million tonnes were exported (10.7% of the total).
-
Canned and prepared and preserved non-fish seafood22/: With global exports of these products coming to 1.2 million tonnes and generating USD 14 billion in receipts, sales of canned and prepared and preserved non-fish seafood products accounted for respectively 22.8% and 41.2% of the total market by volume and value. The large discrepancy between these two percentages is explained by the fact that in the year, sale prices averaged USD 10,589/tonne. As with fish products, China was the world’s most important supplier, in this case with a 35.4% market share by volume, followed in importance by Chile (8.3%), Indonesia (7.9%), Thailand (6.4%), and India (5.0%). The main categories within the segment are: (i) shrimp products, of which 0.50 million tonnes were exported (38.5% of all sales in the segment), with the main exporters being China (19.4% market share), Indonesia (14.7%), Thailand (13.0%), India (11.7%) and the UAE (5.9%); (ii) squid products, of which 0.33 million tonnes were exported (26.8% of the total); and (iii) crab products, of which 0.30 million tonnes were exported (24.2% of the total).
Thai canned and prepared and preserved seafood industry
Thai players in the canned and prepared and preserved seafood segment are relatively competitive on world markets, and so Thailand has a 10% share of the market for products made from fish and shrimp. Although many inputs are sourced from Thai fisheries, these are insufficient to meet demand from the domestic seafood processing industry and so in 2021, 50.5% of seafood inputs were in fact imported. The majority of these were of fish (including tuna, of which 19.1% was imported from Taiwan) and squid (Indian squid, of which 29.7% was imported from China). However, domestic supplies of shrimp (in particular of whiteleg shrimp) are largely sourced from domestic supplies, as are inputs of crab (mostly of blue crab that are caught by Thai fishermen). The situation for the two main product groups in this segment is described below.
-
Canned and prepared and preserved fish23/: In 2021, export sales of 673,800 tonnes resulted in income of USD 2.6 billion going to Thai players. Canned fish accounted for the majority of sales, with 715,700 tonnes of inputs11/ being used to produce the 632,400 tonnes of products that were distributed to domestic and international markets. Sales of the latter then generated receipts worth USD 2.3 billion12/. The major canned fish goods are described below
-
Canned tuna: At 576,000 tonnes, canned tuna accounted for 80.5% of all Thai canned and prepared and preserved fish. However, most inputs came from overseas suppliers in Taiwan (19.1% of imports of tuna to Thailand), Micronesia (16.7%) and Nauru (10.4%). Thai players distributed 474,000 tonnes of canned tuna to the market, which accounted for 75.1% of all canned fish produced by Thai companies. 29,400 tonnes (or 6.2%) was sold domestically and 445,300 tonnes (93.8%) was exported, generating income worth USD 1.8 billion. The most important export markets were in the US (18.5% of exports of Thai canned tuna by volume), Egypt (16.0%), Australia (7.4%), Japan (6.8%), and Canada (5.3%).
-
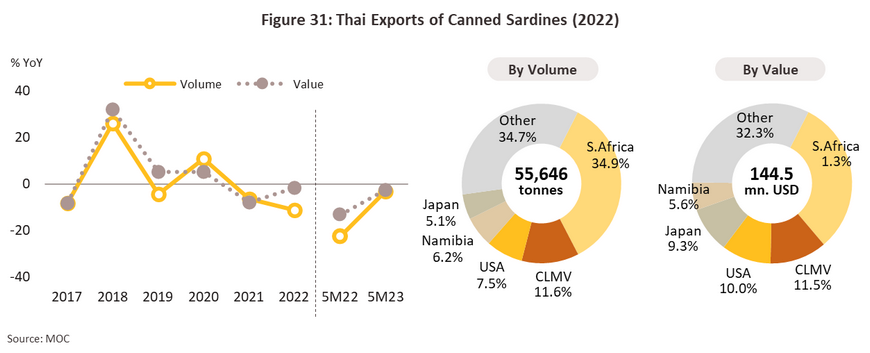
Canned sardines: 19.5% of Thailand’s production of canned and prepared and preserved, or 139,700 tonnes, was of canned sardines. Inputs were sourced from Russia (42.5% of sardine imports), Japan (37.8%), and Myanmar (6.6%). 157,700 tonnes of canned sardines were distributed to the market (24.9% of all canned fish distributed by Thai players), with this split between 95,600 tonnes (60.6%) that went to the domestic market and 62,100 tonnes (39.4%) that was exported and that brought in earnings of USD 145.8 million. The main export markets were in South Africa (buyers of 25.2% of exports of Thai canned sardines), the CLMV nations (23.1%), the US (5.1%), Namibia (5.1%), and the Dominican Republic (4.5%).
- Canned and prepared and preserved non-fish seafood24/: Exports of 80,000 tonnes brought in USD 840.0 million. The main export markets for these products were the US (39.2%), Japan (32.8%), South Korea (7.1%), Italy (4.8%), and Australia (3.1%). Within this segment, the most significant products were cooked, prepared and canned shrimp, which represented 82.1% of exports (65,700 tonnes), followed by squid products (9.3%), mussels/shellfish (4.0%), crabs (2.1%) and other products (2.5%) (data are for 2021, the latest available, and are supplied by the Department of Fisheries and Trademap (chart on page 12)).
Situation
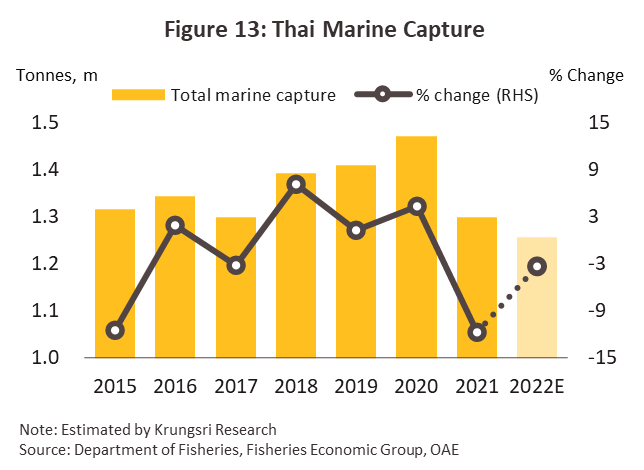
Over the 15 years from 2007 to 2021, the Thai catch has contracted by an average of -3.3% per year. These trends are continuing to affect the industry, and 2022’s catch is therefore estimated to have fallen by another -3.1% to 1.25 million tonnes (Figure 13). Various factors lie behind this, including: (i) government measures that aim to control the size of the Thai fishing fleet (in 2022, this contracted -1.8% to 60,713 vessels) to ensure that aquatic ecosystems are conserved and are used sustainably; (ii) the extension of the period during which waters are closed to trawlers to allow fish to spawn and reproduce (covering the central and upper Gulf of Thailand and the Andaman Sea) as well as a tightening of the regulations on the types of fishing equipment that may be used; (iii) the increasing cost of fuel, labor and the checks on trawlers needed to extend licenses; and (iv) cuts to the total allowable catch (TAC), which was reduced by -2.2% in 2022.
Thailand is home to 10,266 registered aquaculture operations, as per the most recent data, and of these, 8,813 are shrimp farms 25/, or 85% of the total. These produced 241,500 tonnes of marine shrimp 25/, 26/ though this figure was down -0.1% due to a combination of continuing outbreaks of disease and the rising cost of operations, especially for feed 27/, labor, and energy. At the same time, there are 1,453 registered marine fish farms in Thailand (15% of the country’s aquaculture operations) and these mainly produce sea bass. Aquaculture fish yields are estimated to come to 52,200 tonnes 25/, up 8.6% thanks to an expansion in supply.
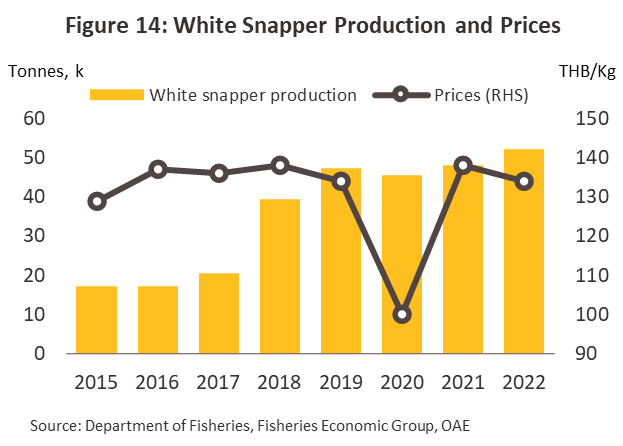
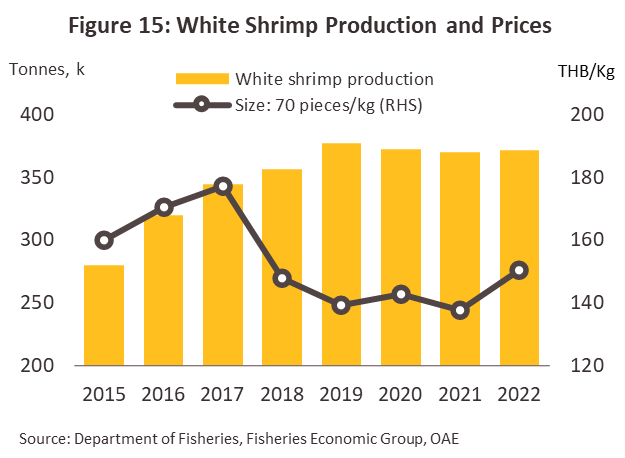
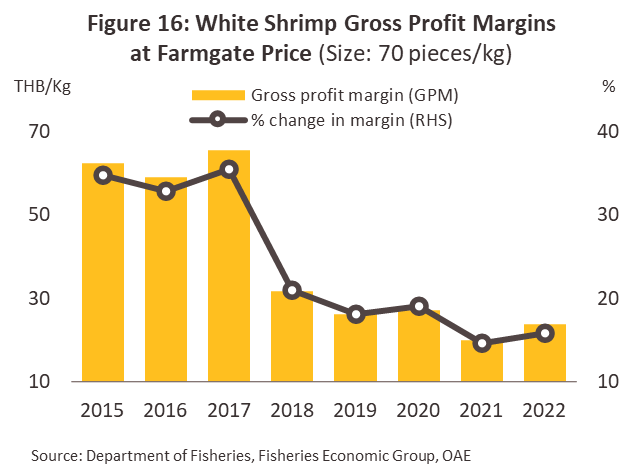
Domestic demand for seafood is strengthening following the relaxation of pandemic controls, the reopening of the country to foreign tourists, and the general rebound in the economy. This has then supported an increase in prices for some products so for example, prices for white shrimp (70 pieces/kilogram) have risen +9.3% to THB 150.3/kilogram (Figure 15) 28/ . However, prior high prices for seabass incentivized breeders to increase supply and this has then fed through into a -2.9% drop in prices, pulling these down to THB 134/kilogram (Figure 14). Aquaculture operators are also having to contend with rising production costs, especially for feed 27/, labor and energy, while competition is stiffening from imported products. As such, profit rates have trended downwards, with shrimp farms seeing net profits go from an average of 34.4% over 2015-2017 to an average of 16.5% in the years 2020-2022 (Figure 16).
2022 output by the Thai processed seafood industry 29/ totaled 957,700 tonnes, up just 0.2%. This increase was driven by growth in the production of chilled and frozen fish and of canned tuna. In 5M23, the production fell -8.3% YoY to 355,100 tonnes The situation for individual product groups is outlined below.
-
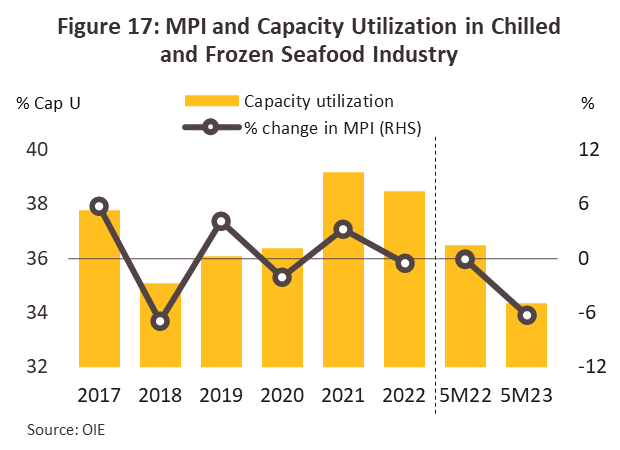
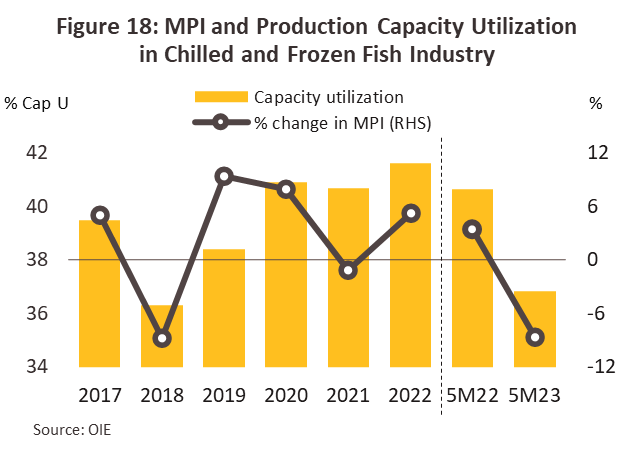
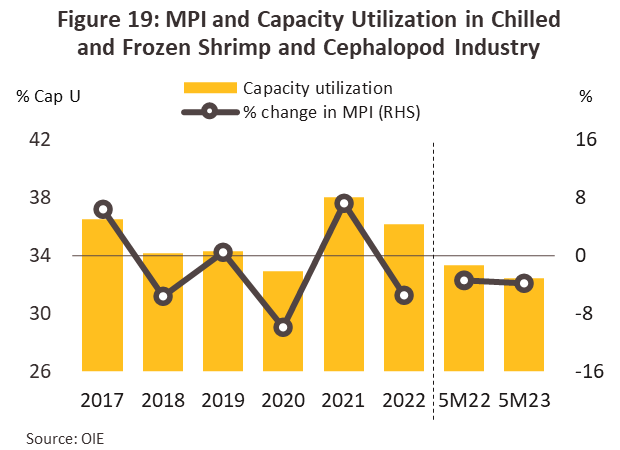
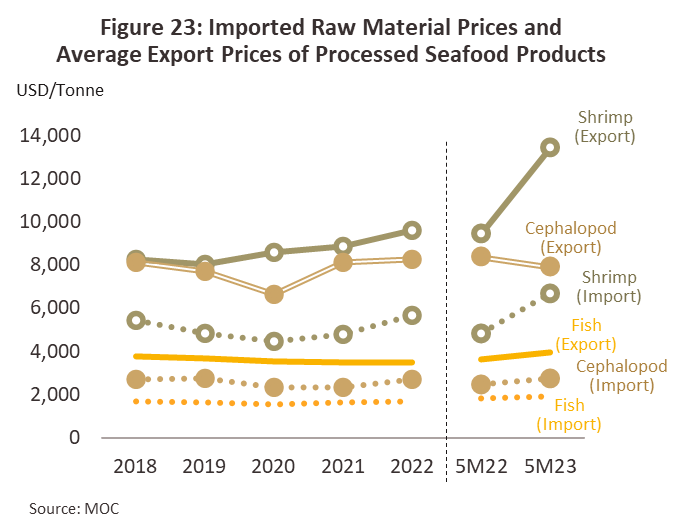
Chilled and frozen seafood products: Output fell -1.8% to 236,200 tonnes, and this was then reflected in the drop in capacity utilization from 39.2% in 2021 to 38.5% a year later (Figure 17). Production of chilled and frozen shrimp and squid contracted by -6.0% and -7.1% respectively to totals of 102,900 tonnes and 16,500 tonnes. These declines were driven by the higher cost of inputs, which rose on tighter supply. Thus, average prices for imported seafood climbed +10.7% 30/, while domestic prices also rose, and so those for white shrimp (70 pieces/kilogram) jumped 9.3%. Only output of chilled and frozen fish expanded in this period, increasing by 3.1% to 116,900 tonnes thanks to the clearing of portside congestion worldwide and the easing of problems accessing shipping containers, the latter then boosting imports to Thailand of fish that may be shipped in containers. In 5M23, the production fell -4.5% YoY to 90,900 tonnes of chilled and frozen seafood, this is in line with Manufacturing Production Index and Capacity Utilized of fish products which has downtrend direction (Figure 18, 19). According to the overall raw material import quantity, it continued to decrease due to the high cost of fuel in fishing, which affects the price. Including climate change, which affects the migration of sea creatures, resulting in a decrease in the amount of wild catch, split between 46,400 tonnes of fish (-5.1%), 37,100 tonnes of shrimp (-4.1% YoY), and 7,400 tonnes of squid and cuttlefish (-3.2% YoY)
-
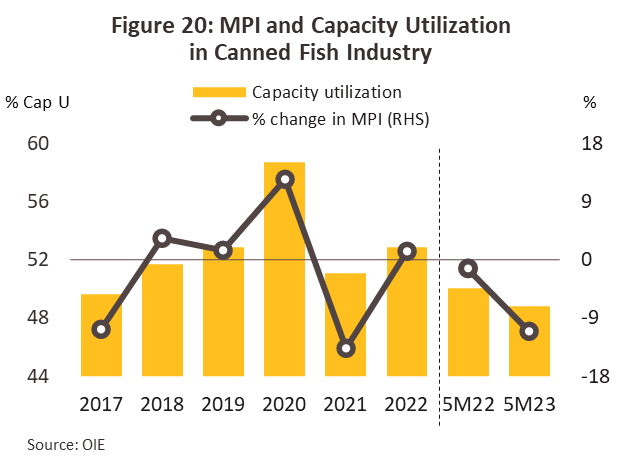
Canned fish products: Output edged up +0.8% to 721,500 tonnes, and this was then reflected in an increase in capacity utilization from 51.1% to 52.9% between 2021 and 2022 (Figure 20). Canned tuna contributed 587,500 tonnes to this total, with output of this rising +2.0% as congested shipping routes began to clear and players were able to import greater quantities of tuna for further processing. Nevertheless, production of canned sardines slipped -4.1% to 134,000 tonnes. In the period, players cut back on output and, as rising inflation ate into overall consumer spending power, they instead engaged in a process of destocking. In 5M23, production of canned fish fell back by -9.5% YoY to 264,200 tonnes due to a -12.4% YoY contraction in output of canned tuna (209,800 tonnes). Having stepped up imports in 2022, players cut back on these and this then pulled down average capacity utilization for the segment. Against this, producers of canned sardines responded to an improving domestic outlook (their most important market) by switching from destocking to restocking. Output rose +3.6% YoY to 54,400 tonnes.
Although Thailand is a major producer and exporter of seafood products, geographical factors mean that many types of fish that are in demand are not found in Thai territorial waters, or are found in insufficient quantities, and so much of the domestic seafood processing industry is reliant on imports. Unfortunately, this exposes players to risk arising from exchange rate fluctuations, as well as to changes in the cost of oil. Operators may also have to contend with what are potentially more onerous fishing regulations enforced in other countries and that may manifest in quotas or controls over when waters may be fished. These factors will then tend to add to import costs.
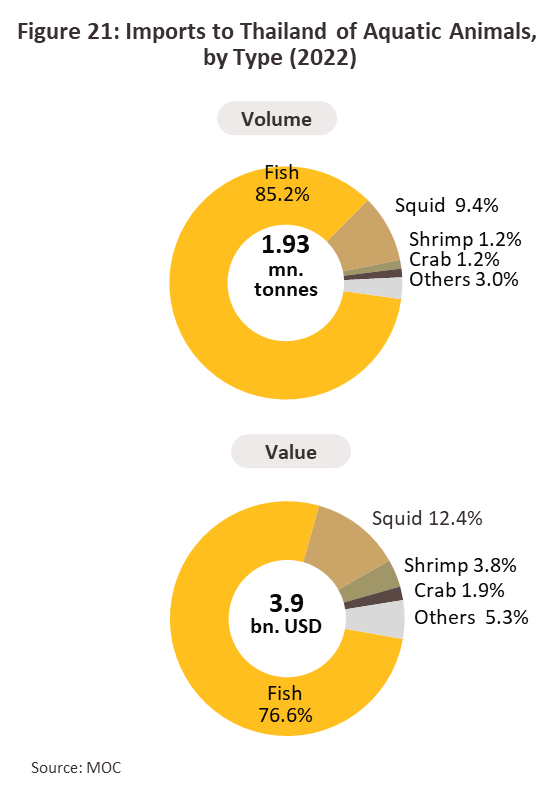
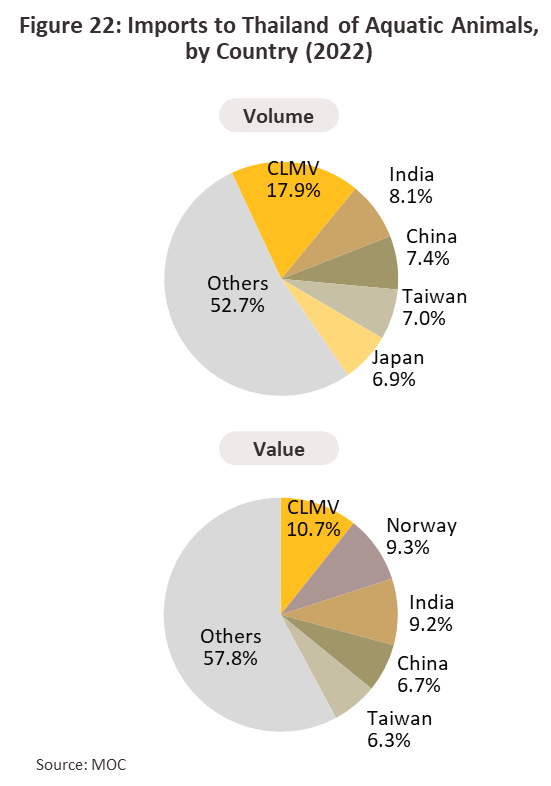
In 2022, Thailand imported 1.93 million tonnes of unprocessed seafood at a cost of USD 3.9 billion, these representing increases of respectively +3.3% and +14.5% from a year earlier. By far the largest share of this (1.64 million tonnes) was accounted for by imports of fish (+3.3%), to which was added a further 182,100 tonnes of squid (+2.1%), 23,300 tonnes of crab (+34.0%), 22,400 tonnes of shrimp (-31.0%), and 19,100 tonnes of other seafood (+20.2%). The most important source of these imports was the CLMV region, which supplied 348,000 tonnes (-1.5%), followed by India (157,000 tonnes, +62.9%), China (143,700 tonnes, +10.9%), Taiwan (135,700 tonnes, -6.5%), and Japan (133,500 tonnes, +3.4%). However, in 5M23, imports contracted -11.2% YoY and -3.6% YoY to totals of respectively 738,700 tonnes and USD 1,584.3 million. Within this total, imports of fish were down -15.0% YoY to 606,100 tonnes because average import prices increased (+4.5% YoY) , while those of shrimp and squid/cuttlefish rose to 15,400 tonnes (+47.5% YoY) and 81,200 tonnes (+3.0% YoY), respectively, because the amount of wild catch decreased and non-proper size for processing.
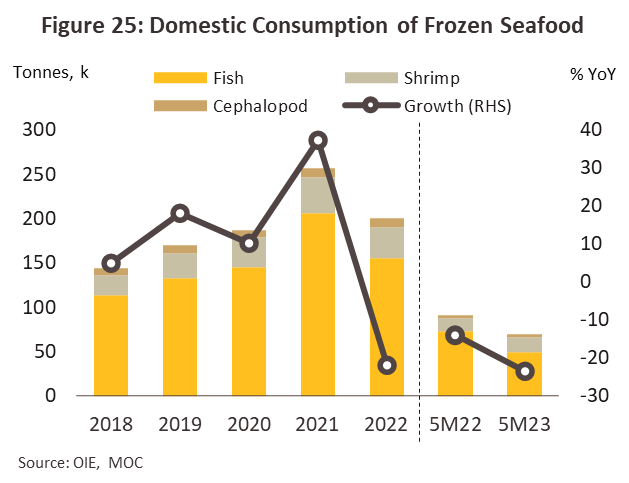
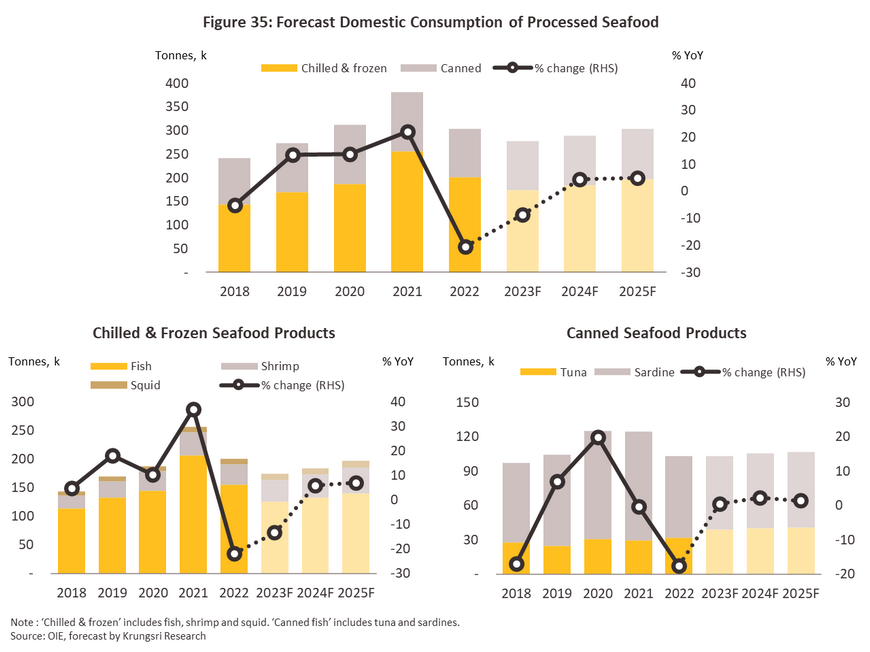
The domestic market for processed seafood contracted -7.9% in 2022. In 5M23 domestic growth dropped further to 115,400 tonnes (-12.8% YoY) due to declines in the amount of both canned and chilled and frozen products that followed the relaxation of Covid-19 controls causing less demand from households and businesses to stockpile food. The ending of the pandemic also allowed individuals to eat out in restaurants as normal, and this has then tended to add to demand for fresh seafood. The situation for the two main segments of the domestic market is outlined below.
-
Chilled and frozen seafood: The domestic market consumed 208,000 tonnes of chilled and frozen seafood in 2022, though this represented a drop of -21.8% from a year earlier. This total was split between 155,300 tonnes of chilled and frozen fish (-24.8%), 35,600 tonnes of chilled and frozen shrimp (-11.7%), and 9,800 tonnes of chilled and frozen squid (+0.7%). Overall sales continued to decline in 5M23, falling -23.5% YoY to 69,800 tonnes of chilled and frozen seafood, made up of 50,000 tonnes of fish products (-31.5% YoY), 16,000 tonnes of shrimp products (+11.7% YoY), and 3,800 tonnes of squid products (-3.8% YoY). This was due to the fact that consumers preferred to consume fresh seafood rather than processed ones as well.
-
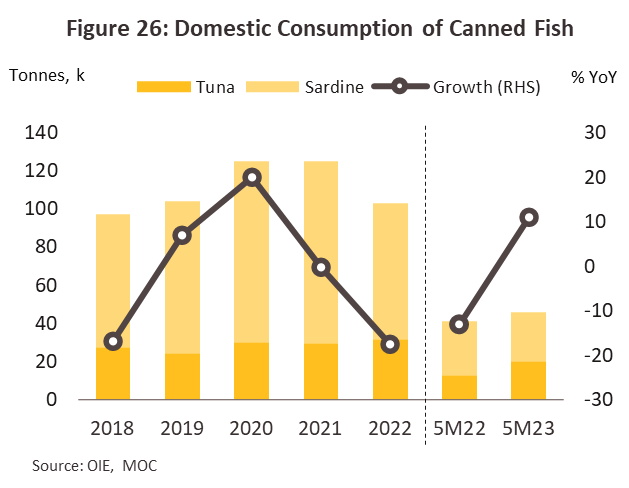
Canned fish: Domestic consumption slumped -17.6% to 102,900 tonnes in 2022. This was divided between 71,400 tonnes of canned sardines (-25.2%) and 31,500 tonnes of canned tuna (+7.3%). Growth rebounded in 5M23, rising +11.1% YoY to 45,600 tonnes because it is ready-to-eat food, and has a wide range of products, especially canned tuna. Including the products that come out, healthy products cause domestic sales to grow. They can be divided into the consumption of canned tuna at 20,300 tonnes (+59.1% YoY) and canned sardines at 25,400 thousand tons (-10.5% YoY).
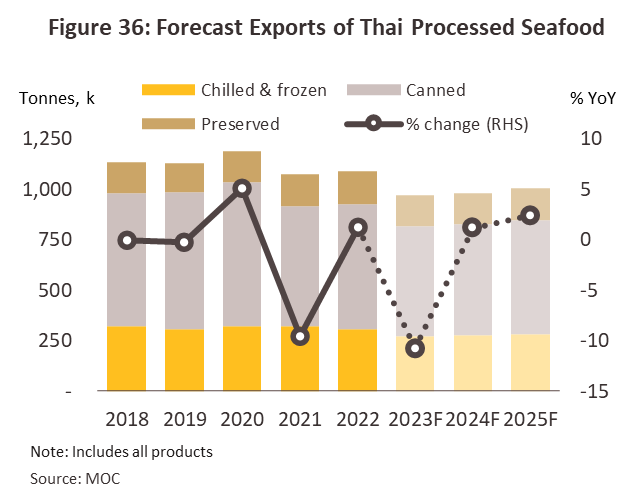
2022 exports of processed seafood came to 1.1 million tonnes (+1.2%), which then generated receipts of USD 5.3 billion (+8.2%). This increase was driven principally by stronger purchases of chilled and frozen squid (+8.8%), canned tuna (+8.8%), and prepared and preserved fish (+5.1%), for which sales were supported by the Russia-Ukraine war and the greater demand for processed food to stockpile that this has provoked. However, sales dipped again in 5M23, dropping -13.3% YoY to 393,200 tonnes by volume and -9.0% YoY by value to USD 1.9 billion. Declines were seen across all product categories as economies slowed and orders fell in all the major export markets, including the US (-25.1% YoY), Egypt (-78.9% YoY), Malaysia (-21.3% YoY), Japan (-3.7% YoY) and Australia (-17.1% YoY).
-
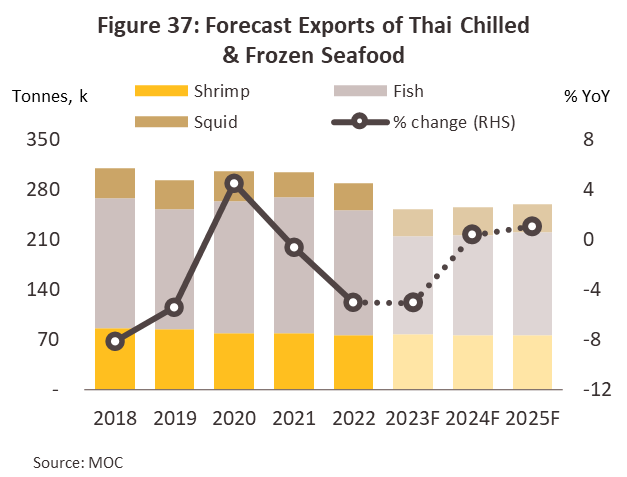
Chilled and frozen seafood: In 2022, exports of seafood contracted -4.5% by volume to 306,600 tonnes, though by value these increased +3.1% to USD 1.5 billion. Overseas sales continued to contract in 5M23, slumping -15.7% YoY to 109,200 tonnes, though again, at -8.7% YoY (or USD 531.0 million), the fall in income was less severe.
-
Chilled and frozen shrimp: Exports contracted -3.2% to 76,700 tonnes, though a +6.6% increase in average export prices to USD 9,089/tonne helped to ensure that by value, exports in fact increased +2.1%, thus bringing in earnings of USD 699.3 million (Figure 27). In the year, declines were seen in the main markets of the US (down -28.5%), where buyers switched to cheaper goods and in particular to Ecuadorean shrimp (average price: USD 7,800/tonne)31/, and Myanmar (down -48.9%), where the country’s deep political problems weighed heavily on demand. Demand continued to soften through the first 5 months of 2023, dropping -2.2% YoY by volume to 27,300 tonnes and +1.9% YoY by value to USD 248.8 million as slowing economies in the major markets of the US (-45.1% YoY) and Japan (-27.3% YoY) fed into declines in sales of respectively, including impact from US maintain Anti Dumping duties on Thai’s shrimp as well 32/
-
Chilled and frozen fish: 2022 exports slipped -8.3% to 175,200 tonnes, but as with shrimp, this was offset by rising prices. Thus, with average export prices inflating by +12.0% to USD 2,353/tonne, receipts from exports increased +2.4% to USD 410.5 million. The most important declines in overseas sales volume were in Malaysia, where sales slipped -12.4% to 50,600 tonnes, and Japan, where sales fell -6.1% to 32,200 tonnes. These falls were principally a result of: (i) the rising cost of inputs that lifted prices; and (ii) weakening currencies in export markets that then added further to import costs. Markets in Malaysia and Japan continued to weaken in 5M23, and with exports to these slumping by respectively -31.4% YoY and -26.3% YoY, total exports fell -25.3% YoY by volume to 58,400 tonnes and -24.7% YoY by value to USD 131.4 million.
-
Chilled and frozen squid and cuttlefish: Exports climbed +8.8% to a total of 38,000 tonnes in 2022, with receipts from these increasing at a slightly faster rate of +12.5% (to USD 305.9 million) (Figure 29) partly on a +3.3% increase in average sale prices to USD 8,038/tonne. Demand growth was driven by the easing of bottlenecks on sea routes and the relaxing of controls on imports, particularly in the main export markets. Thus, sales to Italy, where consumers generally enjoy high levels of purchasing power32/, rose +12.0% to 8,600 tonnes, while sales to China jumped +24.6% to 4,700 tonnes; China remains a major market, and demand for food to stockpile was sustained through the year by the continuing spread of Covid-19. By volume, 5M23 exports remained largely flat, inching up just +0.3% YoY to 16,700 tonnes, though the value of these exports declined -5.7% YoY to USD 128.5 million. Nevertheless, sales into the Chinese market surged +66.5% YoY following the reopening of China.

-
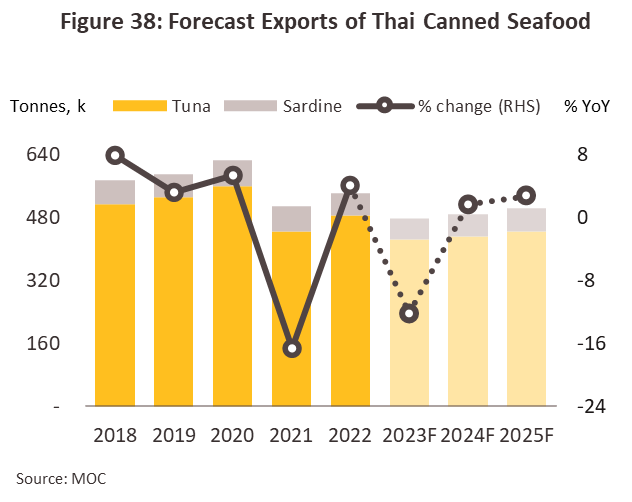
Canned Seafood: The market for canned seafood remained the most profitable of all segments within the Thai processed seafood industry in 2022. Exports strengthened +4.1% to 617,500 tonnes, which then generated USD 2.8 billion in income (+13.0%). Growth was boosted by the increased availability of shipping containers and the easing of congestion on major shipping lines, which then allowed players to step up exports to overseas markets. Nevertheless, profits came under threat from rising costs, in particular for freight, raw ingredients, and the metal (especially of steel) used to manufacture cans. Unfortunately, in 5M23, growth went into reverse, and exports contracted - 13.6% YoY to 221,600 tonnes, which then brought in USD 1,038.7 million (down -8.8% YoY). The situation for individual product groups is outlined below.
-
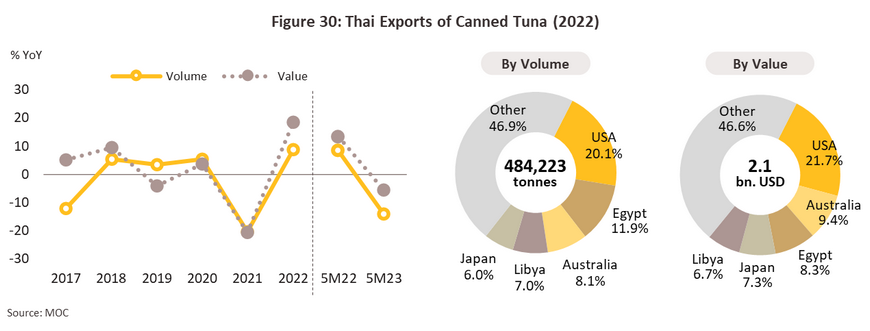
Canned Tuna: In 2022, 484,200 tonnes of canned tuna were exported (+8.8%) but because average export prices increased +8.9% to USD 4,371/tonne, income from these sales rose +18.6% to USD 2.12 billion (Figure 30). The canned tuna segment thus represented 78.4% by volume of all exports of canned seafood, and 38.7% by value of all Thailand’s exports of processed seafood. In the year, sales into overseas markets were boosted by changes in consumer behavior that increasingly favor purchases of healthier foods, and this then supported increases in sales of respectively +18.1% and +18.7% to the US (to 97,100 tonnes) and Australia (to 39,200 tonnes), though exports also benefited from an easing of tight shipping lines. In the first 5 months of 2023, overall exports slipped -14.0% YoY to 172,000, with income from these down -5.6% YoY to USD 788.8 million. Declines were caused by a contraction in main markets such as the USA (-15.1% YoY) Australia (-14.2% YoY) Libya (-22.6% YoY) and Egypt (-73.3% YoY).
-
Canned Sardine: Exports fell to 55,200 tonnes (down -11.2%), but with average export prices up +10.7% to USD 2,606/tonne, export income slipped by just -1.6% to USD 143.5 million (Figure 31). However, increasing prices also lay behind the fall in export volume, especially in important markets in the CLMV nations. Exports of canned sardine fell -3.1% YoY (or 22,100 tonnes) in 5M23 on weakening in the main market, including South Africa (-7.1% YoY). At the same time, earnings from exports of canned sardines dropped -2.7% YoY to USD 57.4 million.
-
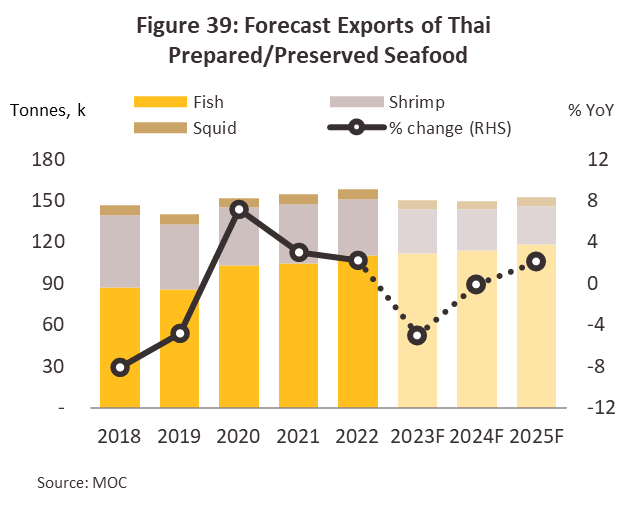
Prepared and preserved Seafood: 164,000 tonnes of prepared and preserved seafood were exported in 2022, an increase of +2.2%, while the value of these exports rose at a slightly faster rate of +2.7% to a total of USD 998.6 million. Exports declined -7.7% YoY in 5M23, falling to 62,500 tonnes, which then generated income worth USD 371.0 million (down -10.1% YoY). The situation for individual markets is given below.
-
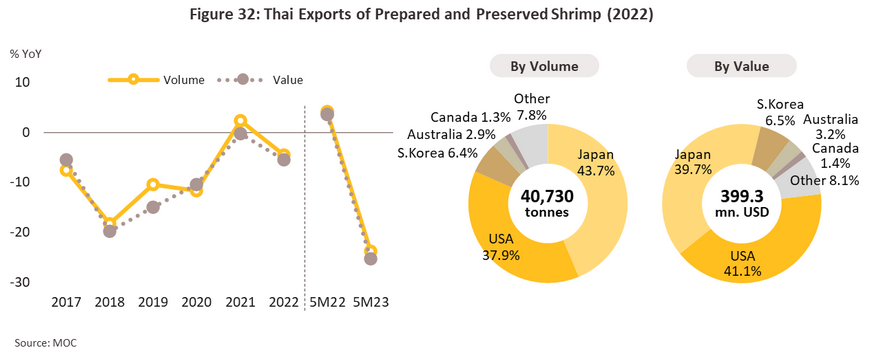
Prepared and preserved shrimp: 2022 exports contracted -4.5% to 40,700 tonnes, and with prices dropping -1.3% to an average of USD 9,806/tonne, income from exports slipped -5.5% to USD 399.3 million (Figure 32). Exports were undermined by weakness in the main export market of the US, where sales dropped -9.5% to 15,500 tonnes due to a +3.0% rise in prices caused by the effects of the Russia-Ukraine war on costs. In 5M23, sales slumped -23.7% by volume (to 13,300 tonnes) and -25.3% by value (to USD 129.9 million). Exports have come under pressure from weak consumer spending power in the main export markets of the US and Japan, which then led to a fall in sales of respectively -48.5% YoY and -4.8% YoY.
-
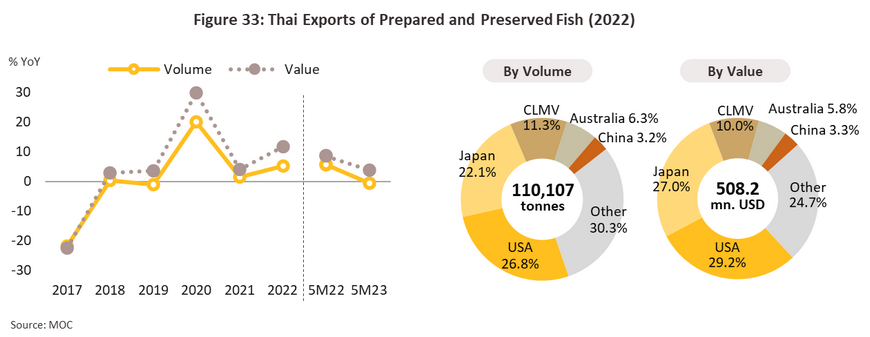
Prepared and preserved fish: By volume and value, 2022 exports rose to 110,100 tonnes (+5.1%) and USD 508.2 million (+11.8%) (Figure 33), with average export prices also up +6.1% YoY to USD 4,612/tonne. Overall export figures were boosted by rising demand for fish driven by increasing consumer concerns with health and wellness34/. This then supported stronger sales into the important US and Japanese markets. In addition, these markets also benefited from the easing of problems in the global shipping industry and a -3.5% fall in export prices to USD 5,600/tonne. Sales to these two countries thus increased by respectively +8.5% and +26.9%, bringing exports to totals of 29,500 tonnes and 24,300 tonnes. However, in 5M23 sales slipped -0.7% YoY to 44,300 tonnes, bringing in receipts of USD 208.4 million (+3.9% YoY). Exports to the US were hurt by signs of an economic slowdown and the effects of this on consumer confidence, which then cut sales into the American market by -26.8%.
Outlook
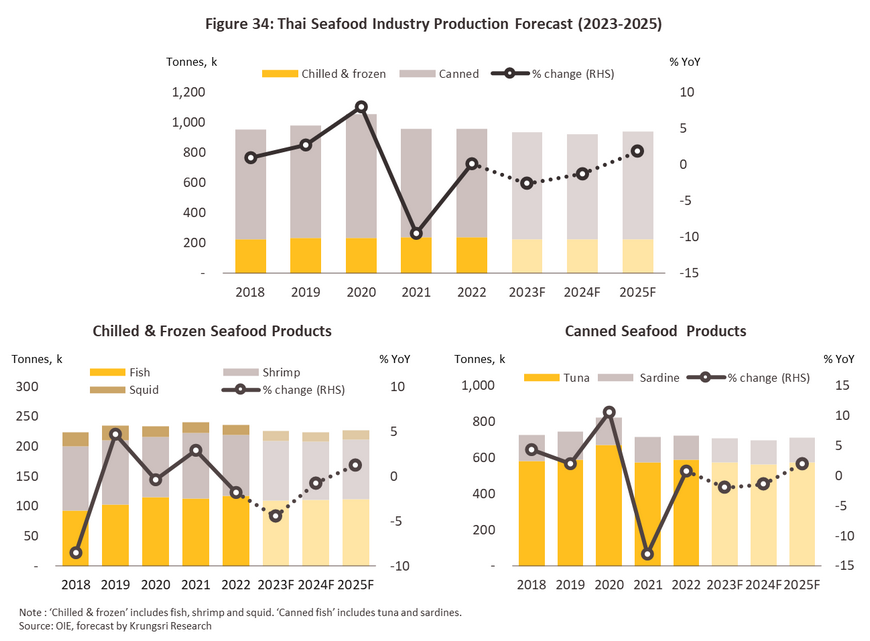
Over the three years from 2023 to 2025, output from the Thai seafood processing industry is expected to contract by between -0.5% and -1.5% annually as domestically sourced inputs become less available. This will be due to a number of factors. (i) Overfishing has reduced wild fish stocks, while climate change is affecting water temperatures and impacting the ability of animals to reproduce and grow. (ii) Officials are imposing stricter fishing quotas, reducing the size of the catch. (iii) The Thai fishing fleet is shrinking, and fewer farmers are involved in aquaculture, with individuals leaving the market as a result of the rising cost of labor and energy, and of extending operating licenses. These factors have eroded profits and, in some cases, losses have encouraged farmers and fishermen to exit the market. (iv) Pressure on manufacturing costs from energy-intensive processing techniques has risen and with energy prices expected to remain high, this will continue to trouble the industry.
-
Chilled and frozen seafood: Production is forecast to slip by between -1.0% and -2.0% annually. Output will be constrained by limited access to inputs, with the catch continuing to shrink and import prices tending to rise. The impacts of this will vary somewhat for individual product categories, with the expectation being that annual output will fall by: (i) -2.0% to -3.0% for fish products; (ii) -1.0% to -2.0% for shrimp products; and (iii) -2.0% to -3.0% for squid/cuttlefish products.
-
Canned seafood: Output will stay flat or decline by up to -1.0% per year due to the falling size of the marine catch, which will then translate into more expensive imports, especially of tuna. Alongside this, the cost of running fishing operations as well as of transport will remain elevated. Given this, output of canned tuna is likely to remain unchanged or to contract by up to -1.0% annually, while for canned sardines, the forecast is for annual output to increase by up to 1.0% as the consumer spending power slightly improves.
Domestic consumption of processed seafood is expected to stay flat or slightly increase up to +0.5% per year. Sales will be boosted by rising levels of urbanization, which tends to encourage consumers to favor food that is both healthy and easy to prepare, and this will then lift purchases of processed seafood since this is generally available in forms that are ready to cook or to eat. In addition, domestic economic growth will also add to demand from restaurants, hotels and related food processing industries.
-
Chilled and frozen seafood: The quantity of goods distributed to the domestic market is expected to decrease by (0.0)-(-1.0)% per year as consumers destock chilled and frozen seafood after their lives are normal and turn to consuming fresh seafood at restaurants or buyback seafood to cook by themselves. Domestic sales of chilled and frozen fish are expected to decrease by -3.0% to -4.0% per year. In contrast, shrimp and squid/cuttlefish products, which are a small percentage of domestic consumption, are expected to increase 8.0-9.0% per year and 4.5-5.5% per year, respectively.
-
Canned fish: The forecast is for domestic consumption to rise by 1.0-2.0% per year. Demand will grow on recovery in purchasing power of canned tuna, which is expected to rise 8.5-9.5% per year because products are wide range and easy to eat, especially for urban consumers who live in the fast lane. In contrast, canned sardines is expected to decrease (-2.0)-(-3.0)% per year.
Over the next three years, exports of processed seafoods are expected to decline at an annual rate of between -2.0% and -3.0%. These declines will affect different product groups as described below.
-
Chilled and frozen seafood: A global economic slowdown and high levels of inflation will cut consumer spending power in export markets. This is forecast to translate into an annual contraction of between -2.0% and -3.0% in overseas sales, as buyers switch to cheaper alternatives, particularly from China and Ecuador, since these are not just major producers but have also negotiated advantageous trade agreements with many other countries. At the same time, Thai players will face increasing non-tariff barriers to trade, especially when selling into markets in Europe and the US. Exports of chilled and frozen seafood are thus forecast to contract annually by between -5.5% and -6.5% for fish products, 0.0% and -1.0% for shrimp products, but +0.5% and +1.5% for squid and cuttlefish products.
-
Canned seafood: Exports expected to decrease (-2.5)-(-3.5)% per year on weak consumer spending power in the main trading partners, e.g., the US, where consumer’s purchasing power has yet to recover, and Egypt which is experiencing economic crisis leading to the plunge in the value of its currency35/ . Annual output of canned tuna is thus forecast to shrink by between -2.5% and -3.5%. Conversely, output of canned sardines should rise at an average annual rate of 3.5-4.5%, as cross-border trade recovers and exports to Myanmar, Lao PDR, and Cambodia improve, now that pandemic controls have been loosened.
-
Prepared and preserved seafood: Exports expected to decrease (-1.5)-(-2.5)% per year. Sales will be hurt by the increasing difficulty faced by Thai players when competing on price, which is especially affected by the inflationary effects of the labor shortage on wages. As such, exports of prepared and preserved shrimp products will shrink by between -1.5% and -2.5% per year over the next three years, though at the same time, annual exports of prepared and preserved fish products should expand by 2.0-3.0% on: (i) growing consumer preference for fish as a healthy and nutritious food; and (ii) the development of new product lines that are easy and convenient to prepare and cook.
Industry Challenges
-
Uncertainty in the global economy: The Thai seafood industry is heavily reliant on exports, unfortunately, this exposes players to risk arising from changes to consumer spending power in overseas markets. Since these contribute a major share of sales, this is especially so for the US and Japan, where markets are affected by a weak outlook and the rising cost of living. Meanwhile, China starts to experience an economic slowdown while still being at risk of the outbreak of a new disease now that the country has fully reopened. Beyond this, global markets continue to be impacted by geopolitical tensions and super-power conflicts, most obviously intense US-China tensions and the lengthened Russia-Ukraine war.
-
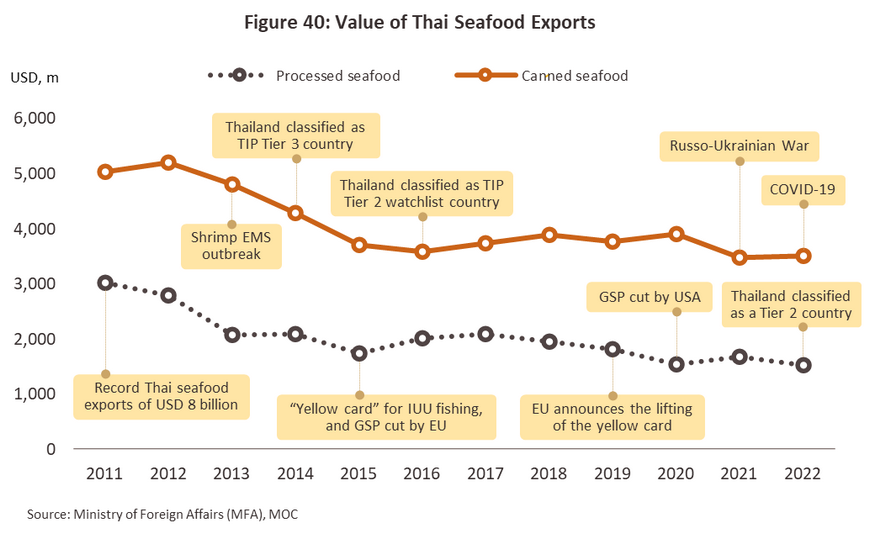
Barriers to trade and the imposition of international standards: Although the EU has lifted the ‘yellow card’ issued against Thailand for violations of rules on IUU fishing, the EU is continuing to monitor the Thai fishing fleet. Likewise, in 2022, the US Trafficking in Persons (TIP) Report36/ upgraded Thailand’s status from a Tier 3 country to a Tier 2 country.
-
The customs advantages enjoyed by Thailand’s competitors: Vietnam and Ecuador have agreed free trade agreements (FTAs) with the EU37/ and this gives them advantages in terms of import duties. By contrast, not only does Thailand not have an FTA with the EU, but it also lost its GSP38/ privileges in 2015, and this puts Thai goods at a relative disadvantage in the EU market when it comes to price. In addition, Ecuador and China are negotiating an FTA, and as of February 2023, they had reached an agreement on some issues. These two countries are among the world’s biggest importers and exporters of shrimp, and the signing of an FTA would then give Ecuador a significant price advantage relative to Thailand when selling into the Chinese market. Such an FTA would also provide Ecuador with improved access to Chinese technology, which would then help Ecuadorean producers to further reduce the cost of manufacturing canned and processed fish products, potentially adding to their competitive advantages (at present Ecuador is in second place after Thailand in the rankings for exporters of canned and processed fish).
-
Shrinking fish stocks and dangers from natural disasters: Overfishing and fishing during the spawning season is leading to an ongoing reduction in the size of the maritime catch, while global warming is raising sea temperatures, and this is further impacting seafood supply chains.
-
Alternative seafood products: The development of new and alternative types of seafood has coincided with growing concerns among consumers with their health and well-being, and with animal welfare. This is now encouraging greater consumption of new and alternative types of seafood. In 2022, the US Food and Drug Administration (FDA) certified the safety of meat products from Thailand that are made from cultured tissue derived from chicken and seafood, and so these can now be sold in the US39/. Thailand is the second country after Singapore to receive this authorization.
1/ Source: FAO 2022 The State of World Fisheries and Aquaculture
2/ A total of 58.5 million individuals are employed in the fisheries and aquaculture industry worldwide (source: FAO 2022 The State of World Fisheries and Aquaculture).
3/ Source: FAO and Trade Map
4/ Source: wageindicator, U.S. Bureau of Labor Statistics
5/ The Norwegian minimum wage is set on a per industry basis. USD 19.5/hour is thus the minimum wage for the fisheries industry (source: The Norwegian Labor Inspection Authority).
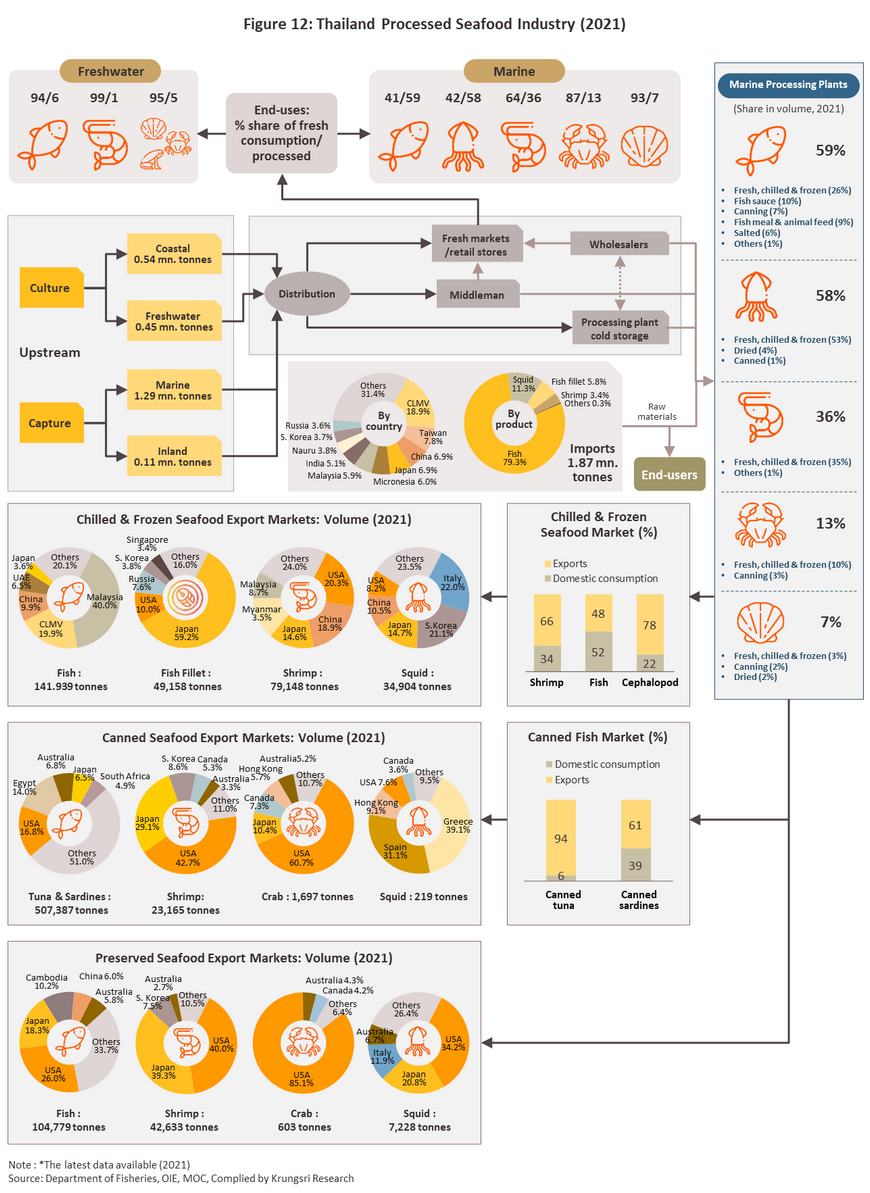
6/ Details on the structure of the seafood processing industry are based on data from 2021 (the most recent available). See Figure 12.
7/ Data from 2021 Trade Map (the most recent data available).
8/ HS Codes: 0302, 0303, 0304, 0306, 0307, and 0308 (Trade Map, 2021)
9/ HS Codes: 0302, 0303, and 0304
10/ HS Code: 0306
11/ HS Code: 0307
12/ Office of Industrial Economics (OIE)
13/ Estimated by Krungsri Research based on data from the Office of Industrial Economics and the Ministry of Commerce.
14/ HS Codes: 030611, 03061290, 030615, 030616, 030617, 03063130, 03063230, 030634, 03063530, 03063631, 03063632, 03063633, and 03063639
15/ As of 2021, Thailand was home to 11,582 registered shrimp farms. These covered an area of 270,000 rai, or 43,200 hectares (from data supplied by the Department of Fisheries and the Ministry of Agriculture and Cooperatives).
16/ Shrimp early mortality syndrome (EMS) is a bacterial infection that affects farmed shrimp. The disease destroys cells in the liver and pancreas of shrimps and typically affects these in the first 20-30 days of release into farms. Mortality rates for farms typically run to 90-100% of their stock and it takes just 2-3 days for the disease to kill following its first appearance.
17/ Caused by viral infection which affects in any stage of growth including shrimp larvae, juvenile shrimp, and parent shrimp. Infected shrimp body is redness with white spot occur in their shell.
18/ Caused by viral infection which destroys hematopoietic organs of shrimp. Infected shrimp will be yellow-headed which mostly occurs in shrimp aged 25-70 days and run out of stock within 2-3 days.
19/ These include skipjack tuna, yellowfin tuna, albacore or longfin tuna, bigeye tuna and bluefin tuna. These are deepwater fish and so they cannot be found in Thai waters, but instead are caught in the Atlantic, Indian and Pacific oceans.
20/ HS Codes: 030742, 030743, 030751, and 030752
21/ HS Code: 1604
22/ HS Code: 1605
23/ HS Code: 1604
24/ HS Codes: 03069121, 03069129, 03069221, 03069229, 03069321, 03069329, 03069421, 03069429, 03069521, 03069921, 03069929, 03081920, 03081930, 03082920, 03082930, 03089040, 03089050, 16051010, 16051090, 160521, 16052920, 16052930, 16052990, 16053000, 16054000, 16055100, 16055200, 16055300, 16055410, 16055490, 160555, 160556, 16055710, 16055790, 160558, 160559, 160561, 160562, 160563, and 160569
25/ Source: Fisheries Economic Group
26/ Yields from goods bought or sold for which movement documents (MDs) and aquacultural product purchasing documents (APPDs) were available.
27/ Prices for shrimp-grade fishmeal (at least 60% protein) rose 13.2% from THB 33.85/kilogram to THB 38.35/kilogram. Prices for soy also increased 17.6% from THB 17.44/kilogram to THB 20.51/kilogram (source: Office of Agricultural Economics and Department of Internal Trade).
28/ Source: Fisheries Economic Group, collated by Krungsri Research
29/ Composed of chilled and frozen fish, shrimp and squid, and canned tuna and sardines.
30/ Composed of chilled and frozen fish, shrimp and squid, and canned tuna and sardines. Average 2022 prices for imported seafood rose 10.7% to USD 2,023/tonne from USD 1,834/tonne in 2021 (HS Codes: 0302, 0303, 0304, 0305, 0306, 0307, and 0308). Source: Ministry of Commerce.
31/ Source : Trademap
32/ The Ad Hoc Shrimp Trade Action Committee (AHSTAC) and the American Shrimp Processors Association (ASPA) summited documents to protect the US shrimp industry from unfair trade. The US Department of Commerce has decided to impose duties on anti-dumping measures from Thai shrimp at 0.57-5.34%
33/ Source : foodinsight.org
34/ Source: Marine Stewardship Council
35/ The Egyptian central bank floated the national currency, but this crashed in value, and this will have negative consequences for imports of goods from Thailand (source: International Monetary Fund (IMF)).
36/ The Trafficking in Persons Report, or the TIP Report, is an annual publication issued by the US State Department that reports on the situation with human trafficking in countries around the world. Countries are classified into one of four levels. (i) Tier 1 countries are those that meet accepted standards; (ii) Tier 2 countries are those that are attempting to meet accepted standards; (iii) countries move to the tier 2 watch list when they are attempting to meet accepted standards but there are also many victims of human trafficking in that country, the number of victims is increasing rapidly, or the government is unable to present evidence that it is trying to solve problems with human trafficking; and (iv) Tier 3 countries are those that do not meet accepted standards and that make no significant effort to solve problems with human trafficking within their borders.
37/ Source: European Commission
38/ Thailand is now categorized as an upper-middle income country by the World Bank. Countries are categorized into one of four groups according to their per capita income (PCI): Low income countries have a PCI less than USD 1,085 USD, low-middle income countries have a PCI of USD 1,086-4,255, upper-middle income countries have a PCI of USD 4,256-13,205, and upper income countries have a PCI greater than USD 13,205.
39/ Source: US Food and Drug Administration


.webp.aspx)