Executive Summary
Over 2026-2028, strengthening domestic and international demand for chicken consumption will lift output. This should therefore climb by 1.7-2.7% annually to reach 2.05-2.15 billion broilers, though meat production will increase at the higher rate of 2.6-3.6% to hit 3.58-3.83 million tons per year. Domestic consumption of chicken products is forecast to grow by between 1.7% and 2.7% annually. Demand will be boosted by: 1) growth in tourism, restaurant businesses, and the economy overall through 2027 and 2028; 2) chicken meat’s position in the market as a low-fat, low-cost source of protein and its resulting popularity with health- and budget-conscious shoppers; 3) more consumer preference for chicken over pork or beef, especially among religiously observant groups and those concern about sustainability, given chicken production process release lower greenhouse gas emission; and 4) modern consumer lifestyles that favor more easily prepared and cooked meats, such as chicken. The outlook for exports is better, and over the same period these are expected to expand by 3.7-4.7% per year thanks to: 1) deeper penetration of markets in the Middle East and in the ASEAN zone, for example in Lao PDR, Malaysia and the Philippines, helped in the former case by buyers’ acceptance of Thai producers’ commitment to maintaining halal standards, and in the latter by the quality of their chilled and frozen chicken products; 2) strong demand for cheap sources of protein; and 3) concerns over the spread of bird flu in some exporting nations, which has highlighted Thailand’s high safety standards. The direct impact from the U.S. tariff hikes and the border conflict between Thailand and Cambodia is expected to remain limited, as exports from Thailand to these two countries account for a relatively small share of total exports.
Krungsri Research view
-
Producers of frozen and processed chicken: Domestic market demand is expected to remain subdued in 2026 due to economic uncertainties that continue to weigh on consumer confidence, before gradually recovering during 2027–2028 in line with improving economic activity and tourism. Alongside this, overseas sales should perform well, and although demand from major export markets will soften somewhat in 2026, growth momentum will be maintained in both these and new markets in the Middle East, where Thai manufacturers’ commitment to halal standards is broadly accepted by Muslim shoppers. More worryingly, worsening barriers to trade and the increase in US tariffs may impact exports, although the effects of these headwinds will be limited.
-
Chicken farms: Demand will continue to strengthen, and players will benefit further from a combination of favorable farmgate prices (these should remain stable or possibly edge up slightly) and softening animal feed costs. The latter is particularly likely if an agreement to buy corn from the US is implemented and import costs fall. Thanks to their economies of scale, access to major markets, and advanced disease-control systems, major players will be well placed to benefit from these developments and to generate additional profits, but smaller, independent operations will face more challenging conditions and with competition stiff, their ability to maintain profitability will come under pressure.
Overview
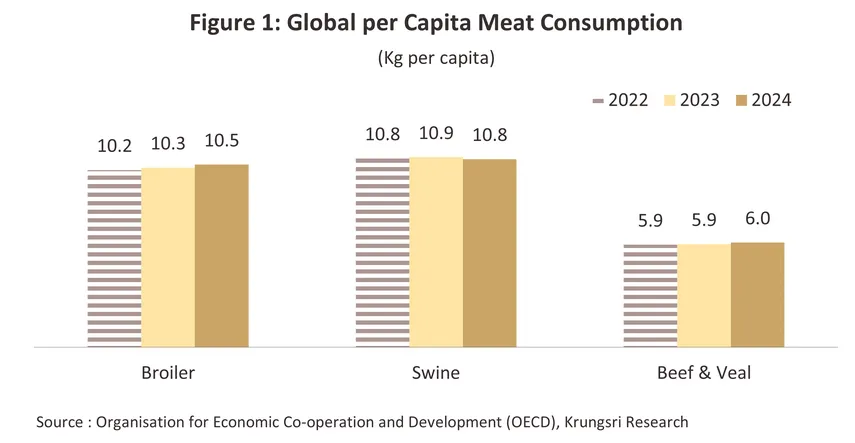
Chicken meat has the advantage of being simultaneously the most protein-rich non-fish meat product1/ and of having a low-fat content, while because modern breeds grow to maturity very rapidly, chicken flocks return profits over a relatively short time span compared to other meats. As a commercial undertaking, raising chickens also benefits from the animal’s high conversion rate2/ and resistance to disease, and the result of this is that chicken is farmed and consumed in enormous quantities; as of 20243/, per capita global consumption averaged 10.5 kilograms/person/year, compared to 10.8 kilograms for pork and 6.0 kilograms for beef (Figure 1). The majority of the consumable output of the chicken industry is distributed in the form of: 1) chilled chicken, 2) frozen chicken, and 3) chicken that is processed, cooked or flavored and then frozen. Each of these product groups thus involves a different type of processing.
-
Chilled chicken: Chilled chicken products include whole chickens, fillets, offal, and other parts of the bird. These are preserved at a temperature of 0-5 degrees Celsius.
-
Frozen chicken: Frozen chicken products include whole chickens, fillets, offal, and diced and minced chicken meat. These products are stored at temperatures below -18 degrees Celsius.
-
Processed chicken: These are downstream products that generate added value for manufacturers. Processed chicken goods can be split into two main classes: 1) uncooked products that consumers will then prepare themselves, and 2) semi- or fully cooked products that need to be frozen at temperatures below -18 degrees Celsius. These include grilled legs, smoked wings, satay, burgers, nuggets, steaks, karaage, meatballs, and battered, fried and marinated products.
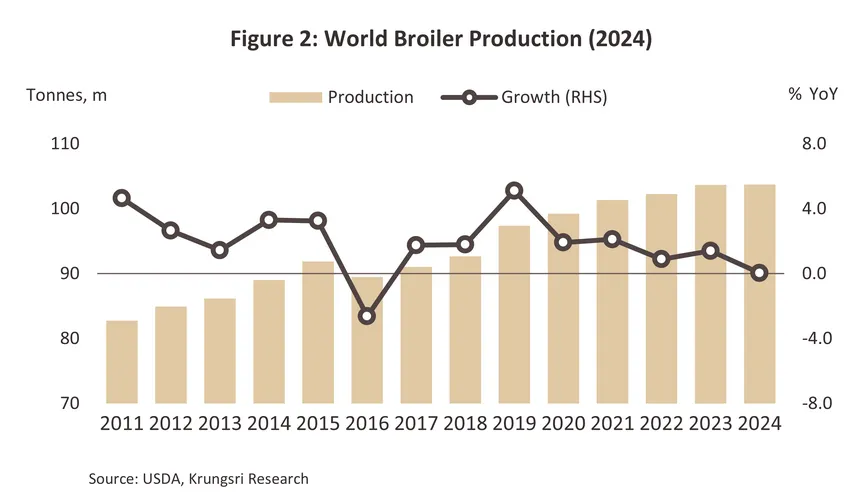
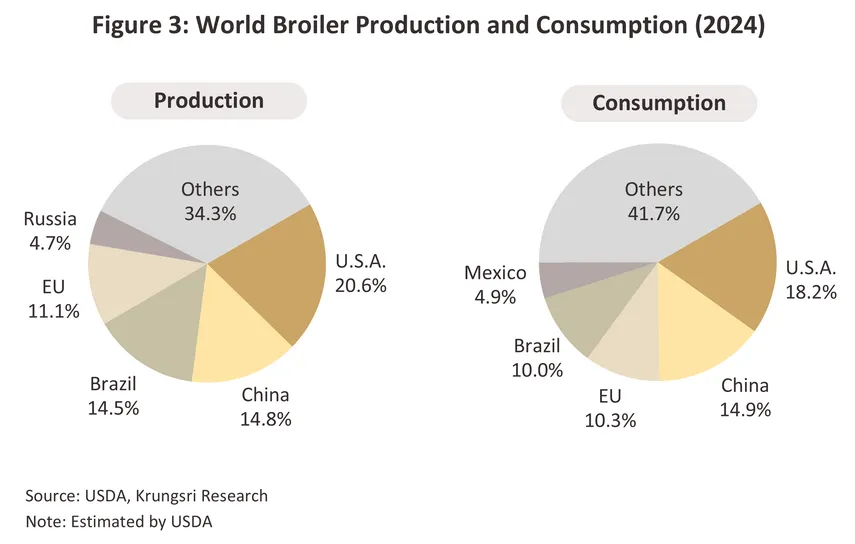
Global output of chicken meat totaled 103.6 million tons in 2024, unchanged from a year earlier (Figure 2). The Americas are the world’s primary chicken producer, accounting for 47.3% of global production, followed by Asia (25.9% of output), Europe (19.3%), the Middle East (4.0%), and Africa (1.7%). In terms of individual countries, the USA sits in first place in the supply league table, producing 21.3 million tons of chicken per year (20.6% of all global output), followed by China with 15.4 million tons (14.8%), Brazil with 15.0 million tons (14.5%), and the European Union with 11.5 million tons (11.1%) (Figure 3). Thailand’s annual production of chicken meat comes to 3.4 million tons, which gives the country a 3.3% share of world output and places the country in 7th position globally (source: USDA and OAE). Total global consumption came to 101.2 million tons in the year, unchanged from 2023, but the overwhelming majority of this is absorbed by domestic markets (these consume 97.7% of global output). Thus, the biggest buyers of chicken are US consumers, which with a market sized at 18.4 million tons, account for 18.2% of global demand, followed by China (15.1 million tons, or 14.9% of the global market), the EU (10.4 million tons, or 10.3%), and Brazil (10.1 million tons, or 10.0%). Thailand consumes 2.2 million tons of chicken annually (2.2% of global supply), sufficient to put the country in 9th place in the global ranking of market sizes.
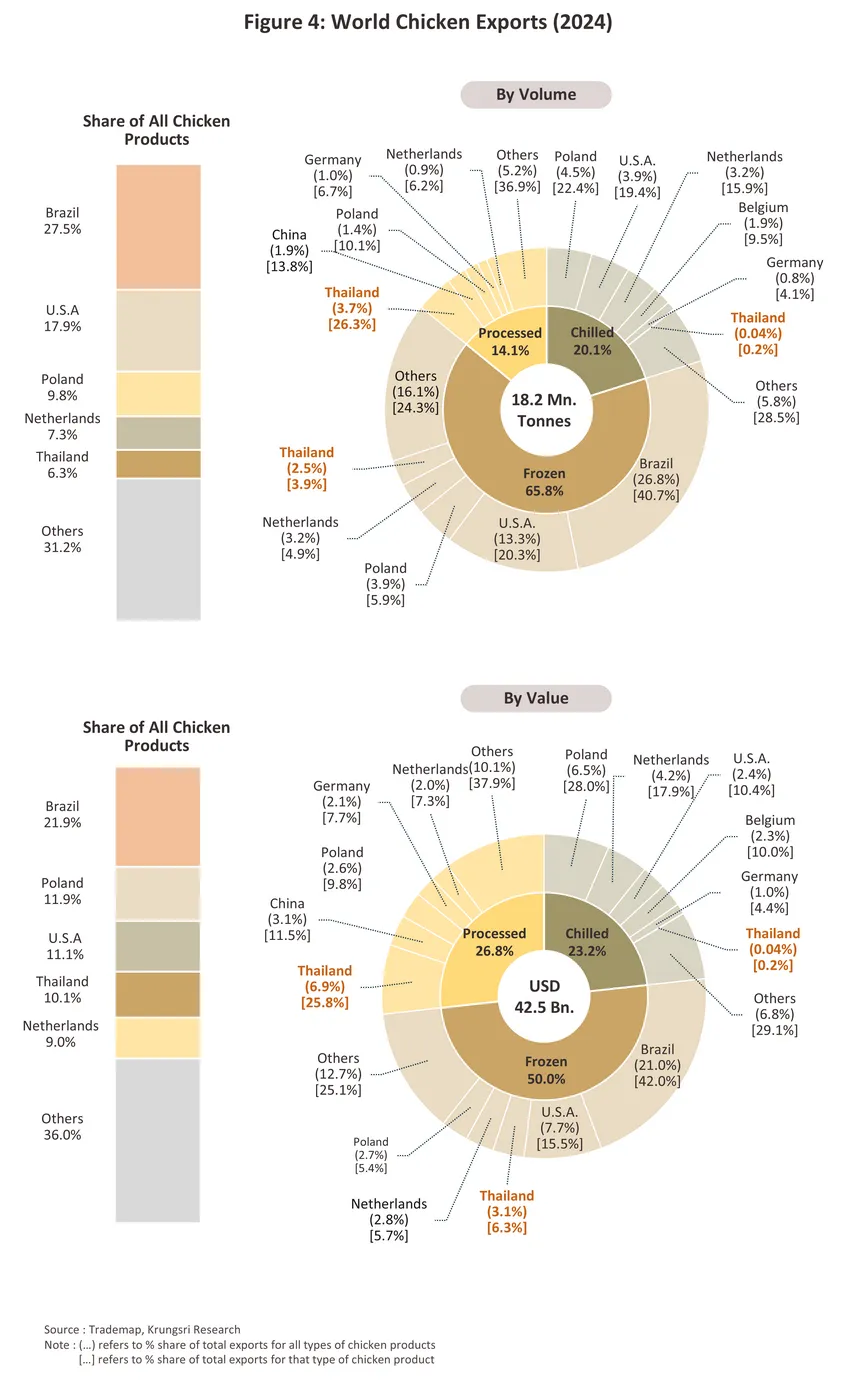
Worldwide, chicken exports totaled 18.2 million tons in 2024, sales of which generated receipts of USD 42.5 billion. With a 27.5% share of this market, Brazil is the world’s most important exporter of chicken products, followed by the US (17.9% of the market), Poland (9.8%), the Netherlands (7.3%), and Thailand (6.3%) (Figure 4). Details of exports of the different product groups are given below:
-
Frozen chicken: By volume and value, this accounted respectively for 65.8% and 50.0% of global chicken exports. Within this category, 84.4% of all export value came from sales of filleted products, with the remainder coming from exports of whole chickens. The world’s three biggest exporters are Brazil, the US, and Poland, which together had a 66.9% market share. By comparison, Thailand has just a 3.9% slice of the market, putting the country in 5th place in the global rankings.
-
Processed chicken: Although by volume, only 14.1% of global exports were of processed chicken, the share jumps to 26.8% when considered by value. Within this segment, Thailand is the world’s biggest exporter, enjoying a 26.3% market share by volume, followed by China (13.8%), Poland (10.1%), and Germany (6.7%).
-
Chilled chicken: Considered by volume and value, respectively 20.1% and 23.2% of global chicken exports were of chilled goods. 88.4% (by volume) were filleted products, the remainder being whole birds. With a 22.4% market share (by volume), Poland was the world’s biggest exporter, followed by the US (19.4%), and the Netherlands (15.9%). Thailand’s presence in this market is very slight, and the country’s 0.2% market share puts it in 31st place in the world rankings.
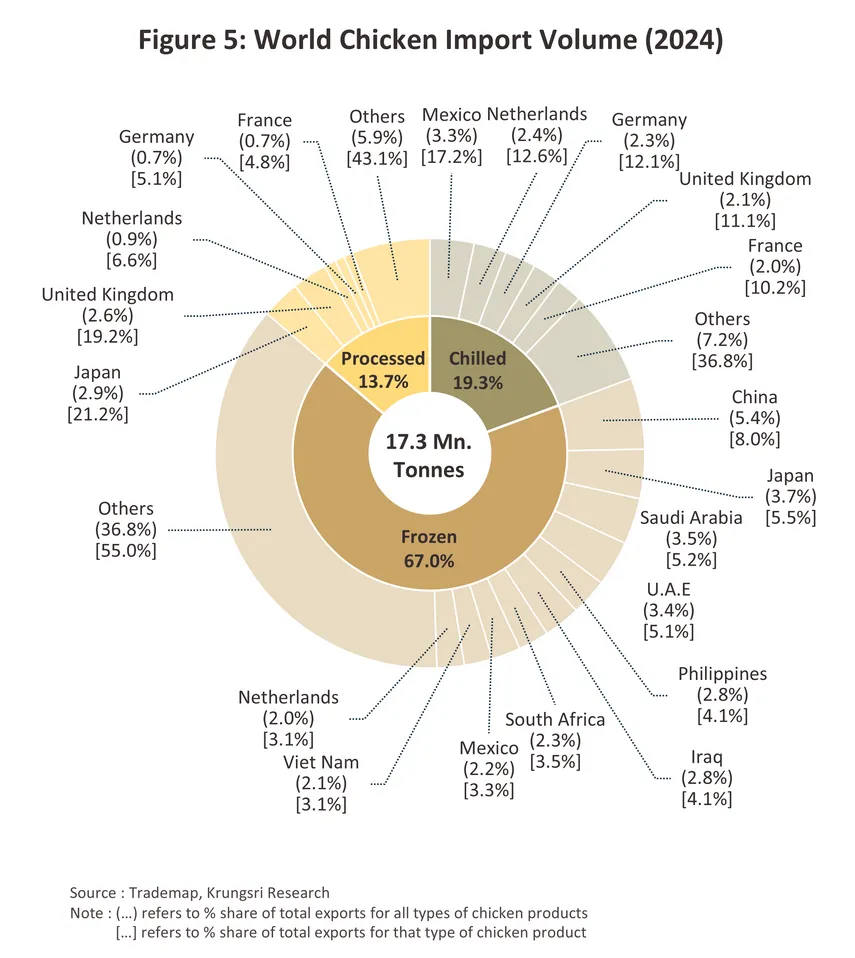
The global market for imports of chicken is summarized below (Figure 5).
-
Frozen chicken: This accounts for 67.0% of global imports of chicken by volume. The most important markets for this are China (8.0% of all imports of frozen chicken worldwide), Japan (5.5%), Saudi Arabia (5.2%), and the UAE (5.1%).
-
Chilled chicken: This segment represents 19.3% of chicken imports worldwide, though much of this trade occurs within Europe. The biggest importers are thus the Netherlands (12.6% of global imports of chilled chicken), Germany (12.1%), the United Kingdom (11.1%), and France (10.2%). In North America, where products originate mostly from the US, Mexico absorbs 17.2% of global exports and Canada another 3.8%.
-
Processed chicken: This segment takes up the remaining 13.7% of the market for imported chicken goods. The world’s biggest importers are Japan (21.2% of all imports of processed chicken by volume), the United Kingdom (19.2%), the Netherlands (6.6%), Germany (5.1%), and France (4.8%).
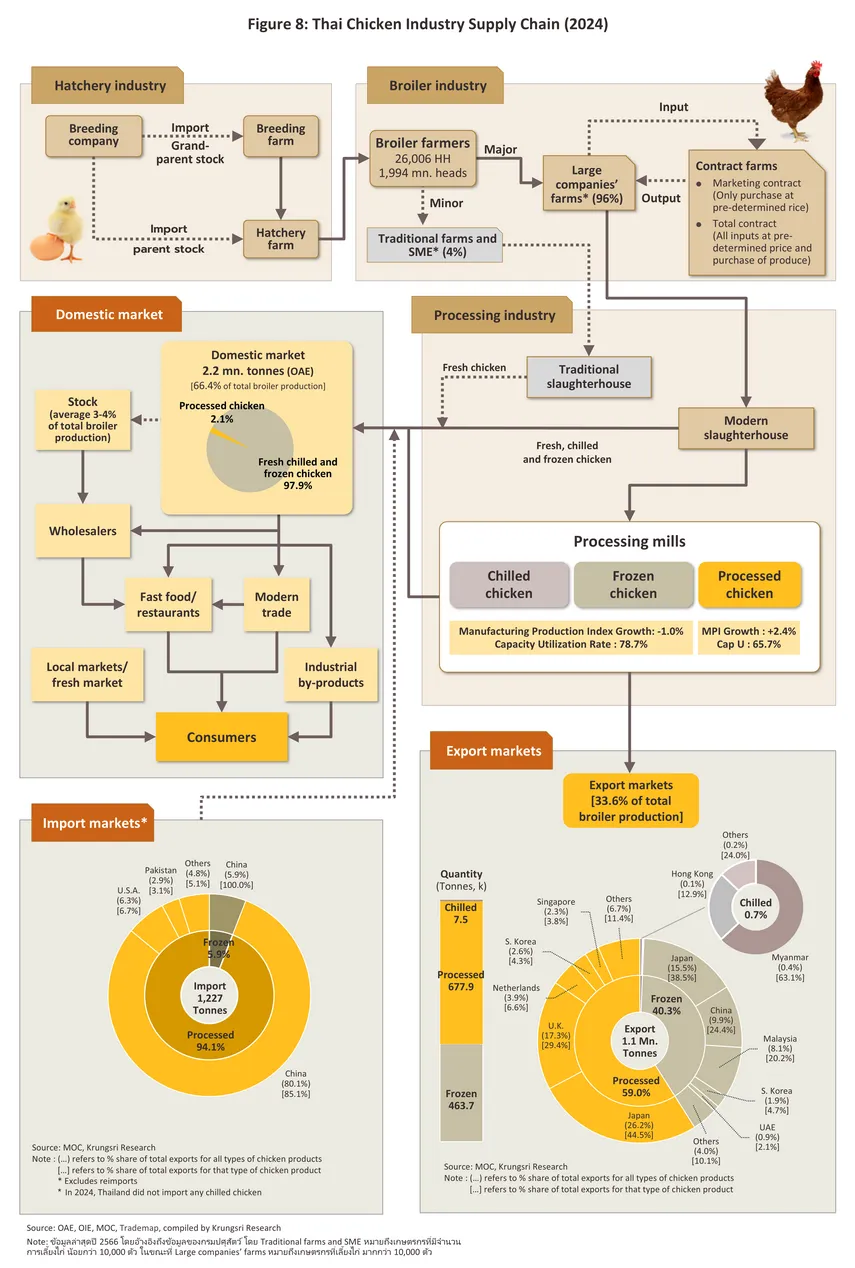
3.4 million tons of chicken goods were produced by Thai players in 2024, of which 66.1%, or 2.2 million tons, was distributed to the domestic market (Figure 6), largely as fresh fillets and cuts. The remainder of national output was then converted into processed and frozen chicken, mostly for export. Indeed, by value, Thailand is the world’s biggest exporter of processed chicken and the 5th biggest exporter of frozen chicken (source: Trademap, 2024).

The export market has undergone significant changes since 2004, when Thailand was affected by a major outbreak of bird flu4/. As a result of concerns over possible infection and thus of the safety of raw chicken originating from Thailand, Japan, Germany, South Korea, and China (a combined 79.5% of export volume) halted their imports. In response to this, Thai players overhauled their operations and placed a much greater emphasis on the production and output of processed chicken, which continued to be accepted in Thailand’s export markets5/. This then led to the establishment of processed chicken as the sector’s primary product (Figure 7), and so this now accounts for 59.0% of all Thai exports. As of 2024, Thailand had a 26.3% share by volume of the global market for processed chicken goods.
By volume, Thai chicken exports are split 59% processed goods, 40% frozen products, and 1% chilled items (data correct as of 2024) (Figure 7). The country’s main export markets are in Japan, which buys mostly processed and frozen chicken, and the EU, which imports processed products. Thailand’s main competitor is Brazil, the world’s biggest supplier of frozen chicken. Details of individual product categories are given below.
-
Processed chicken: This segment accounts for 59.0% of all exports of chicken products from Thailand. The main markets for these goods are Japan (44.5% of all exports of processed chicken), the United Kingdom (29.4%), the Netherlands (6.6%), and South Korea (4.3%).
-
Frozen chicken: 40.3% of chicken exports are of frozen goods, and these go principally to Japan (38.5% of all exports from the segment), China (24.4%), Malaysia (20.2%), and South Korea (4.7%).
-
Chilled chicken: Only 0.7% of Thai chicken exports are of chilled products, for which all the main markets are bordering or near to Thailand. Thus, Myanmar takes 63.1% of exports of these, followed by Hong Kong (12.9%), Lao PDR (12.0%), and Singapore (6.2%).

In 2024, industry output totaled 1.99 billion broilers6/. Around 96%7/ of production was by large corporations, which typically invest in operations across the length of the supply chain, from upstream production of animal feed, through chicken raising (both via their own, directly managed operations and via independent farmers that operate under contract farming arrangements) to slaughterhouses and downstream food processing plants that operate according to recognized standards. This then gives large players advantages in cost control and economies of scale. Small operations account for the remaining 4% of production7/, and these players are almost entirely dependent on the domestic market (Figure 8).
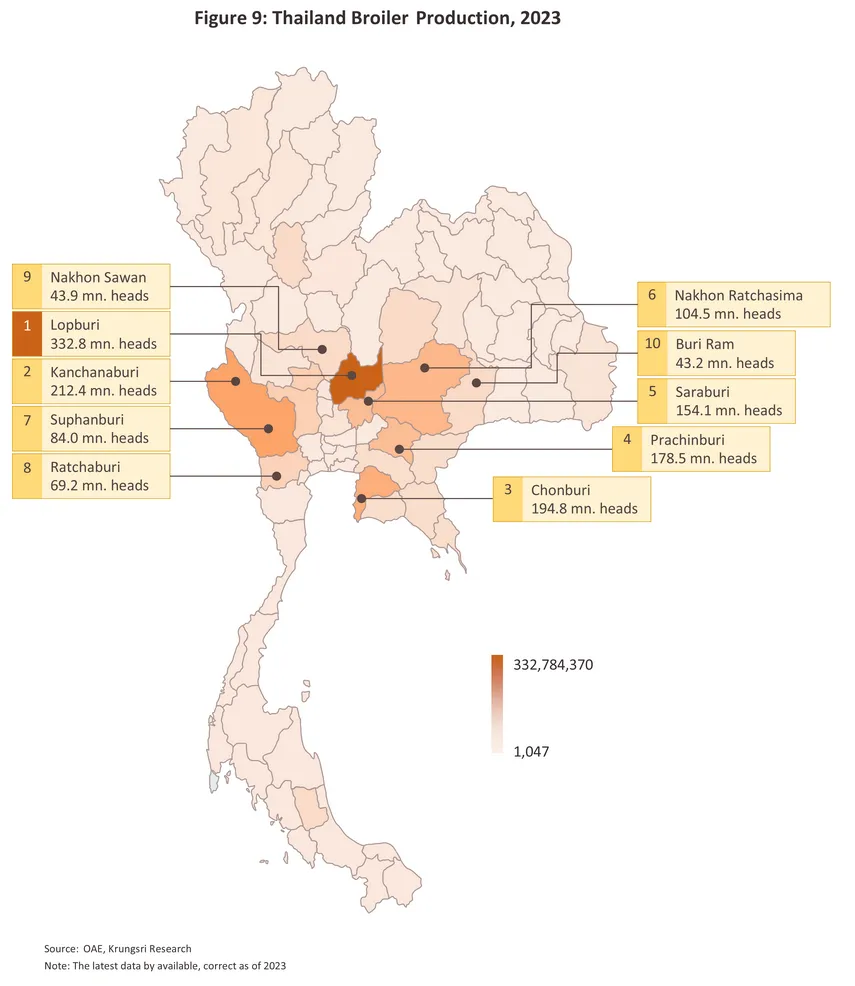
Commercial flocks are overwhelmingly found in the central region (the source of 73.7% of all chicken produced in Thailand)7/, followed by the northeast (11.9%), the north (8.0%) and the south (6.4%), while by individual province, Lopburi is the most important source of production (16.9% of all national chicken output), followed by Kanchanaburi (10.8%), Chonburi (9.9%), Prachinburi (9.0%) and Saraburi (7.8%) (Figure 9). Thai operations benefit from the skill of the local workforce, their access to manufacturing technology, their use of modern production techniques, their ability to develop products that effectively meet market demand, the high standards of their farms, and their success in controlling and preventing outbreaks of disease. Beyond this, the fact that Thailand has agreed FTAs8/ with many of its trade partners has also helped to strengthen the competitiveness of Thai operations and to widen markets for Thai products.
Situation
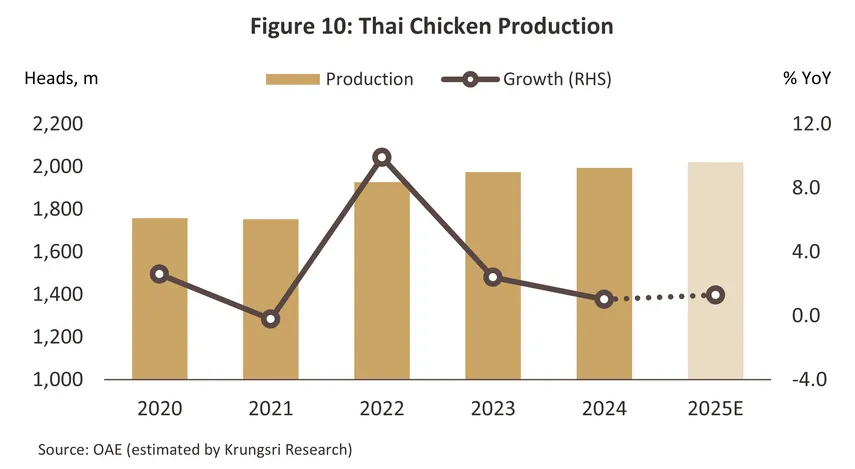
Output inched up from 2023’s total of 1.97 billion broilers to 1.99 billion in 2024 (Figure 10), and this 1.0% increase was then reflected in a similar rise in yields of chicken meat, which thus went from 3.36 million tons to 3.40 million tons. Production was lifted by the strength of export demand that then offset a decline in sales into the domestic market. Supply continued to grow through the first 8 months of 2025, and with the domestic market returning to growth and tailwinds continuing to come from export markets, another 1.0% was added to the broiler MPI. For the year as a whole, rising prices will incentivize players to expand their flocks and so domestic output of broilers and chicken meat should expand by 0.8-1.8% and 2.3-3.3%9/, respectively. However, the rise in US tariffs will drag on spending power and economic growth at home and overseas, thereby indirectly impacting sales into domestic and export markets.
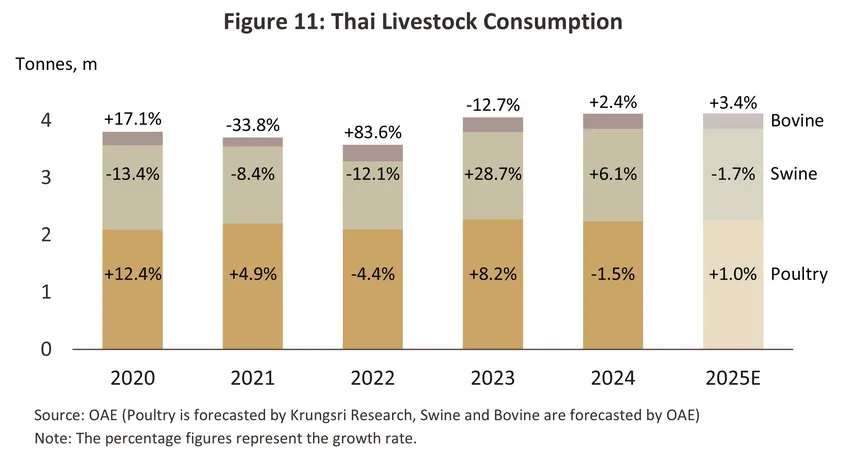
Domestic consumption of chicken contracted by -1.5% in 2024, bringing this down from a total of 2.28 to 2.24 million tons. Sales were affected by falling prices for alternative meats, though in particular for pork, for which prices declined faster than for chicken (Figure 11 and Figure 12). In addition, as African swine fever (ASF) outbreaks cleared, consumer worries over the consumption of pork also began to lift, and this then showed up in the 2025 6.1% increase in purchases. Overall domestic consumption of broilers is thus forecast to expand by 0.5-1.5%, thanks especially to: 1) rising prices for feed for pork and a warming climate that is then adding to costs and slowing the time to market (pigs are notably sensitive to changes in the weather), and as a result some consumers are switching back to chicken (in 8M25, chicken price +3.0% YoY and swine price +15.1% YoY); and 2) the run-up in the cost of living, which is making cheaper sources of protein more attractive, and rising concerns with personal health that are shifting the market in favor of low-fat, high-protein products such as chicken.
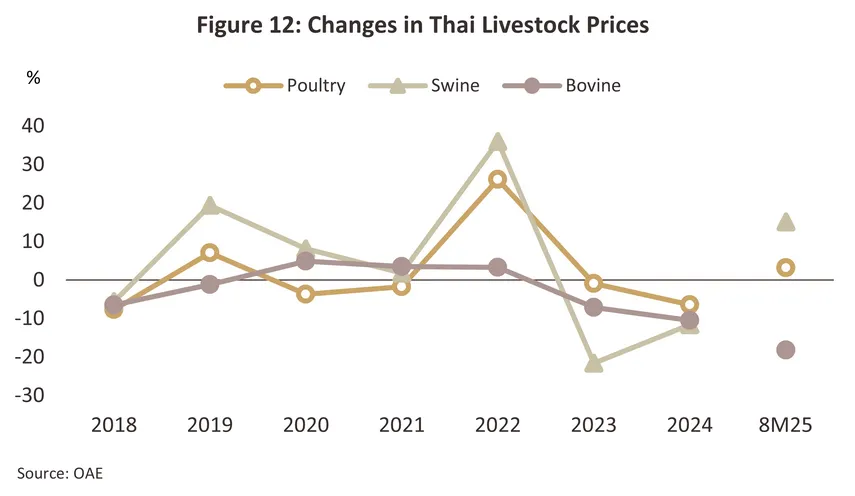
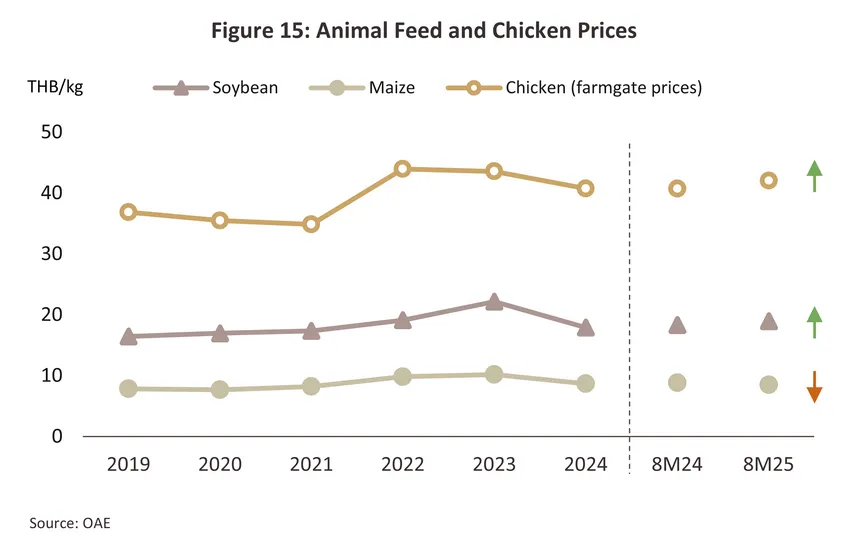
Average farmgate broiler prices slipped -6.5% to THB 40.7/kg in 2024 on an expansion in supply. Likewise, the easing of ASF infections helped to add to the supply of pork, and this helped to pull down 2024 farmgate prices for pork and beef by respectively -11.6% and -10.5%, but although this exerted additional downward pressure on chicken prices, declines in the latter were less precipitous (Figure 12). Over the first 8 months of 2025, broiler prices rallied to rise 3.2% YoY to THB 42.0/kg and expected average prices for the year to be around THB 42.2/kg. This outlook is supported by: 1) favorable consumer attitudes towards Thai products in overseas markets that will then continue to support growth, although this will slow as the economic outlook darkens; and 2) ongoing high production costs.
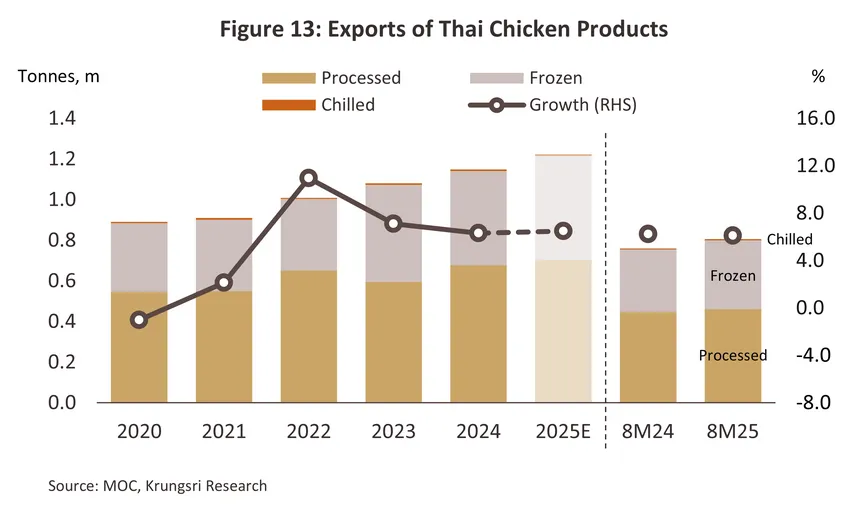
In 2024, exports expanded by 6.3% to reach 1.15 million tons. Growth was supported by: 1) the high cost of living, which has made low-cost high-protein foods such as chicken more attractive; and 2) a deeper move into markets in the Middle East (especially the UAE), where spending power remains solid, and consumers typically have faith in Thai producers’ commitment to safe, halal-compliant production standards. However, a decline in farmgate broiler prices pulled down those for exports, and so these fell by -0.6% to USD 3,751.4/ton. Given this, export value grew at the slightly slower rate of 5.7%, or to USD 4.31 billion. Nevertheless, with growth in export volume hitting 6.1%, thereby pushing this to 0.81 million tons, and prices up 1.9% to USD 3,781.4/ton, export value climbed 8.1% YoY to USD 3.05 billion over the first 8 months of 2025 (Figure 13). Growth momentum is expected to be maintained in the main export markets of Japan and Europe through the remainder of 2025, but the economic outlook will tend to worsen under the impact of US tariff hikes and so overall growth rates will slow in the second half of the year. Nevertheless, sales into new markets in the Middle East will remain strong and because the US is such a minor market (for processed chicken, the country accounted for just 0.003% of export earnings in 2024), the direct consequences of higher tariffs will be only slight. Thus, for all of 2025, export volume and value are forecast to rise by 6.0-7.0% and 7.5-8.5%, respectively. The situation with individual segments is described below.
-
Chilled chicken: Total export volume fell to 7,500 tons in 2024 (down -1.1%), but with average prices falling -6.7% to USD 2,159.8/ton, export value declined -7.7% to USD 16.2 million. The sharpest falls were seen in Myanmar, where the higher cost of living and ongoing economic woes contributed to a -9.4% slide in imports, and Hong Kong, where sales dropped -4.0% following a switch to sourcing goods from China. Overseas export volume returned to growth over the first 8 months of 2025, jumping 17.4% YoY to 6,000 tons. This was thanks in part to the spread of H5N1 within Cambodia and the need to find alternative sources of chicken in Thailand. Prices remained virtually unchanged, inching down -0.4% YoY to USD 2,128.5/ton, and so export value increased 17.0% YoY to USD 12.7 million. For all of 2025, export volume is expected to climb by 11.0-12.0%.
-
Frozen chicken: Overseas sales volume fell -2.9% to 0.46 million tons in 2024, but thanks to a 2.5% increase in average export prices (to USD 2,896.7), export value edged up 1.7% to USD 1.34 billion. Thailand’s worst performing markets included Hong Kong, where sales plummeted -72.8%, and Korea, where they were down -30.8%. In the former, buyers switched to sourcing goods from China and Brazil, which benefit from the size of their domestic chicken industries and their resulting low marginal costs, while sales to the latter suffered from the country’s weak economic performance and a decline in consumer spending power that then showed up in a fall in imports of frozen chicken across all suppliers. However, other important markets including Japan (+55.0%) performed well. The situation improved over 8M25, with export volume, prices and export value all climbing. These thus rose by respectively 10.0% YoY (to 0.34 million tons), 1.1% YoY (to USD 2,876.5/ton), and 11.3% YoY (to USD 0.97 billion). Among major markets, the strongest growth was seen in Malaysia (+13.2% YoY) and South Korea (+51.0% YoY), as well as in the Middle East, especially in the UAE (+206.4%). Sales volume is now expected to strengthen by 10.3-11.3% for all of 2025.
-
Processed chicken: Export volume rose 13.8% to 0.68 million tons in 2024, with growth especially strong in the Japanese and UK markets (up by respectively 5.3% and 24.1%). However, with competition intense and purchasing power under pressure from the high cost of living, export prices fell back -5.4% to an average of USD 4,354.0/ton and so receipts from these sales came to just USD 2.95 billion (+7.7%). As with the frozen chicken segment, the outlook brightened over 8M25, with export volume, prices and export value up by respectively 3.1% YoY to 0.46 million tons, 3.1% YoY to USD 4,464.3/ton, and 6.6% YoY to USD 2.06 billion. Consumption strengthened in the major markets, by volume climbing 2.8% in the UK, 6.8% YoY in the Netherlands, 2.1% in Japan, and 6.5% in Ireland. Given this, export volume is forecast to rise by 3.0-4.0% across 2025.
Outlook
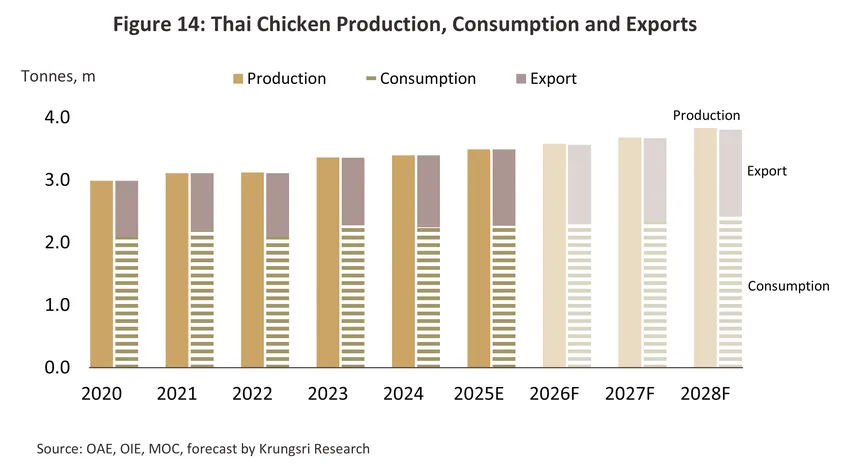
Over 2026-2028, strengthening domestic and international demand will lift output. This should therefore climb by 1.7-2.7% annually to reach 2.05-2.15 billion broilers, though meat production will increase at the higher rate of 2.6-3.6% to hit 3.58-3.83 million tons per year (Figure 14).
-
Domestic consumption is forecast to rise by 1.7-2.7% per year over the next 3 years (Figure 14). An uncertain outlook for the economy will weigh on sentiment and suppress demand for chicken through 2026 but following this, a broad range of tailwinds will support gradual growth in consumption. 1) An improving outlook for restaurants, the tourism sector and the economy overall will lift consumer confidence and boost spending. 2) Consumers continue to seek affordable products amid persistently high living costs, keeping chicken meat a staple protein choice for households. In addition, if Thailand successfully concludes an agreement with the US to import corn and soybean meal, this should cut the cost of animal feed and lower chicken prices. 3) Consumers are increasingly concerned about their personal health, adding further to demand for low-fat, high-protein foods. 4) Religious prohibitions on the consumption of pork and beef make chicken a preferred alternative, while these red meats are also associated with higher greenhouse gas emissions than poultry, again making chicken relatively more attractive10/. 5) The range of ready-to-eat or partially prepared chicken products is steadily expanding, and these are a good fit for modern, fast-paced lifestyles.
-
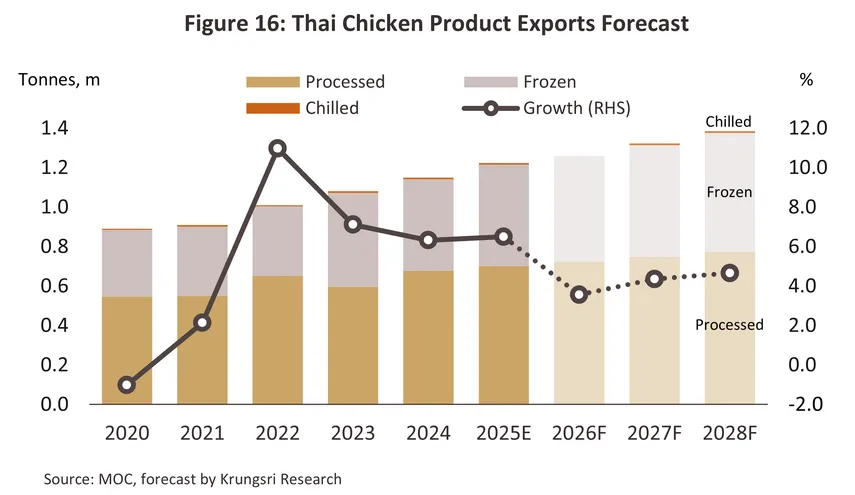
Export volume is predicted to rise by 3.7-4.7% per year through the period 2026 to 2028 (Figure 16), lifted by growth in global demand that the OECD-FAO sees increasing by 1.4% annually over 2024-2033, or from 141 to 160 million tons (Figure 17). Proof of the ability of the domestic industry to grow faster than global demand is found in the recent past, when over 2020-2024, the annual rate of increase in worldwide consumption of chicken generally and for Thai chicken in particular came to 2.2% and 5.1%, respectively. This sharp divergence in growth rates reflects the domestic industry’s continuing comparative advantage, though additional tailwinds will come from a number of other sources. 1) Cooperation with trade partners will help to boost sales of chilled and frozen products in markets in the Middle East (for halal foods) and in those nearer to home, such as Lao PDR, Malaysia and the Philippines. As such, Thai producers should be able to diversify their overseas distribution channels. 2) Ongoing problems with the high cost of living mean that overseas consumers continue to prefer low-cost sources of protein. 3) Deepening concerns with personal health among global consumers are tipping demand towards low-fat products such as chicken and away from high-fat red meats. 4) Although recent outbreaks are abating, Thailand retains a strong reputation for its adherence to international safety standards. A recent example of this can be seen in the recognition of Thai chicken products under NASA’s space-grade food standards and the resulting ‘Thai chicken in space’ project, which brought together partners from AXIOM Space, VOYAGER Space, My Space Corp. and GISTDA (September 2025). Less positively, the recent sharp increase in tariffs on imports to the US will likely have indirect impacts on consumer sentiment and the overall performance of the economies in Thailand’s main export markets, and this will then drag on growth, especially in 2026. However, two potential threats to export markets, namely the US tariffs and border tensions between Cambodia and Thailand, will have only limited direct consequences on sales since, these are not major buyers of Thai chicken products.

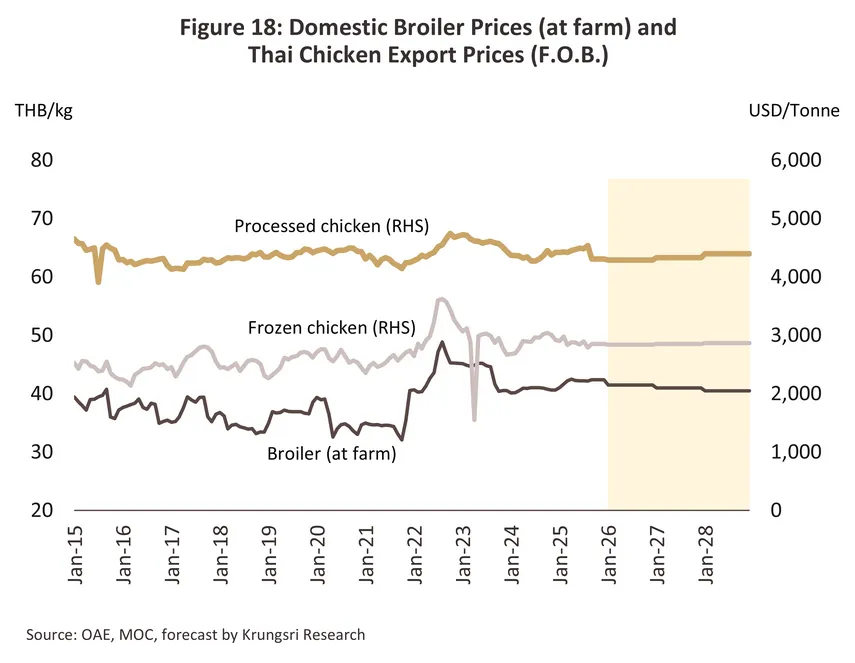
Having averaged USD 2,896.7 and USD 4,354.2 per ton in 2024, respectively, prices for frozen and processed chicken are forecast to remain flat at USD 2,800-2,900 and USD 4,300-4,400 over the next three years (Figure 18). Prices will be affected by economic uncertainty in 2026, but over the subsequent two years, conditions should gradually improve. Alongside this, prices for corn and soy used as animal feed will likely soften, especially if a trade agreement is signed with the US since in that case, the cost of corn bought from US suppliers will fall beneath that of feed sourced regionally.
Nevertheless, the industry will continue to face several challenges, and these may restrain growth.
-
US tariffs: Although sales into the US accounted for only 0.003% of all earnings from Thai chicken exports in 2024, US tariffs still have the potential to create economic uncertainty and to reduce spending power in countries that are major buyers of Thai products. In addition, the US is a significant supplier of chicken to world markets and any new trading arrangements that the US agrees with third parties may result in US exports displacing those from Thailand.
-
Climate change impacts: Drought, flooding and an overall increase in the unpredictability of the weather are adding to the cost of animal feed. Rising temperatures are also reducing growth rates and increasing mortality within flocks.
-
Changes to trade policy in importing nations: This includes stiffening non-tariff barriers to trade, such as those connected to health, environmental, animal welfare, and labor protection measures, and this is then adding to the costs faced by Thai exporters. In some countries, protectionist policies are also being enacted, while trade agreements between Thailand’s trade partners may reduce demand for Thai chicken and over the long term, erode the country’s market share.
-
The Thailand-Cambodia border conflict: Although, the direct impacts of this will be limited by the fact that sales into Cambodia account for just 0.3% of all earnings from chicken exports, nontheless the passage of exports passing through Cambodia en route to the rest of the region may be disrupted. Thai players may therefore need to develop alternative trade routes, even if this implies higher costs.
Sustainability
-
Environment: Players will move to cut their greenhouse gas emissions through: 1) switching to renewables (e.g., solar, biomass and biogas) and making efficiency gains in the machinery used in production processes; 2) cutting waste through greater reuse of materials and an increased focus on environmentally friendly packaging; and 3) offsetting emissions by, for example, participating in community reforestation schemes.
-
Social: Companies will increase their participation in community and social development programs. This will include: 1) providing assistance to communities, for example by using organic waste to improve soil fertility in the local area and to cut the production costs borne by local farmers, and improving incomes in local communities, for example by employing people with disabilities or helping these individuals to live independently; 2) providing additional benefits to staff by extending the coverage of these to their families, arranging ongoing personal development for employees, and guaranteeing that human rights are maintained and that all individuals are treated fairly and equally; 3) ensuring that the highest production standards are always maintained and that products are free of adulterants; and 4) adhering to the five core principles of animal welfare11/.
-
Governance: Players in the chicken industry will focus on good governance to ensure that the interests of all stakeholders are maintained. This will involve: 1) ensuring that conflicts of interest do not arise, and that corruption is opposed across the board; 2) effective management of risk related to the climate, water, natural disasters and other threats; and 3) maintaining the highest ethical standards and always acting with full responsibility towards all stakeholders.
-
Developing new sources of animal feed: For chicken farmers, animal feed is the most important cost center and because this accounts for around 70% of all production costs, advances in feed production can make significant contributions towards improved sustainability. At present, research on alternative sources of protein is therefore focused on the use of black soldier fly larvae12/ in place of soy13/ since production of the latter is linked to deforestation and in addition, supply may be disrupted by climate change. Fly larvae can also help to accelerate the breakdown of waste organic material and its conversion into compost14/.

1/This is based on the animal’s protein and energy conversion efficiencies, i.e., how efficiently the animal converts food obtained from vegetable or animal sources into body mass. Chicken ranks highest on this score, followed by pork and then beef (source: Alexander et al. and information available online from Our World Data).
2/The feed conversion rate (FCR) refers to the ratio of the animal weight to the weight of its feed. Chicken farming typically produces 1 kilogram of product per 1.9 kilograms of feed, whereas producing 1 kilogram of pork and beef requires respectively 3.8 and 8 kilograms of animal feed (source: Statista).
3/ Source: OECD-FAO Agricultural Outlook 2024.
4/Bird flu is caused by an avian virus, but the severity of the illness depends on the particular strain. The H5N1 and H7N9 strains are potentially serious variants that can jump to humans if these are in close contact with infected flocks.
5/Research shows that the bird flu virus cannot survive temperatures above 70 degrees Celsius so cooking chicken through frying, boiling, steaming, baking or grilling will kill the virus and render the meat safe for human consumption (source: Department of Disease Control, Ministry of Public Health).
6/This is based on the number of chickens being slaughtered annually (source: Office of Agricultural Economics).
7/Information corrects as of 2023, from centralized data supplied by the Department of Livestock Development.
8/Thailand has signed 16 free trade agreements with 23 countries, and 10 of these allow for the duty-free import of all livestock products from Thailand, namely Australia, Brunei, China, Indonesia, Japan, Malaysia, Myanmar, New Zealand, Singapore, and Vietnam.
9/During 2019–2024, chicken meat output expanded at an average annual growth rate of 6.94%, higher than broiler production, which grew at 4.95% per year, driven by improvements in processing technology.
10/Source: BBC Future, “What Is the Lowest-Carbon Protein?”
11/These are: 1) freedom from hunger and thirst; 2) freedom from discomfort; 3) freedom from pain, injury, and disease;
4) freedom to express normal behavior; and 5) freedom from fear and distress.
12/Source: Worldbank
13/Fly larvae are around 42% protein, slightly less than the 44% found in soy (source: MDPI Scientific Journals, ResearchGate).
14/Source: FAO


.webp.aspx)