EXECUTIVE SUMMARY
Over 2026–2028, total beverage production volume in Thailand is forecast to grow at an average rate of 1.8–2.8% per year. Key growth drivers include: (1) a gradual recovery in domestic demand and inbound tourist arrivals; (2) capacity expansion investments by major producers, along with the adoption of technologies to enhance the quality and efficiency of production and logistics processes; and (3) new product development in the functional drinks segment. Headwinds include higher production and packaging costs — particularly in 2026, owing to the impact of the Middle East conflict. Domestic beverage sales volume is projected to grow by 1.8–2.8% per year. Growth may be subdued in 2026 due to weak purchasing power and declining foreign tourist arrivals, before gradually improving in 2027–2028, supported by: (1) rising temperatures; (2) a gradual recovery in domestic demand and foreign tourist arrivals; (3) the expansion of convenience stores and modern retail outlets; and (4) new product launches that cater to consumer needs, particularly functional beverages.
Krungsri Research view
The financial performance of Thai beverage producers is expected to recover gradually over 2026–2028, in line with the broader economic environment and the still-recovering services and tourism sectors. Key downside risks include rising energy costs and packaging material costs — particularly for plastic and glass in 2026 — due to the Middle East conflict. Export growth is likely to remain constrained, especially in the Cambodian market, given the prolonged border trade closures.
-
Bottled water and mineral water producers: Revenue is expected to rise steadily, driven by growing health consciousness among consumers and an increasing preference for clean, safe drinking water, which supports the growth of manufacturers with strong and trusted production standards.
-
Carbonated drinks producers: Steadily rising temperatures will encourage consumers to seek refreshing beverages, while a number of producers are responding to health-conscious market trends by reformulating products with sugar substitutes. This is expected to support revenue growth.
-
Beer producers: Revenue is gradually recovering, driven by new product development that better meets consumer demand, including low-alcohol and low-calorie options targeting health-conscious consumers. However, intensifying competition and rising input costs may weigh on profitability.
-
Spirits producers: Consumption growth is likely to be limited by health concerns. That said, handcrafted products with a distinctive backstory and unique flavors represent a high-value, growth-potential segment within the category.
Overview
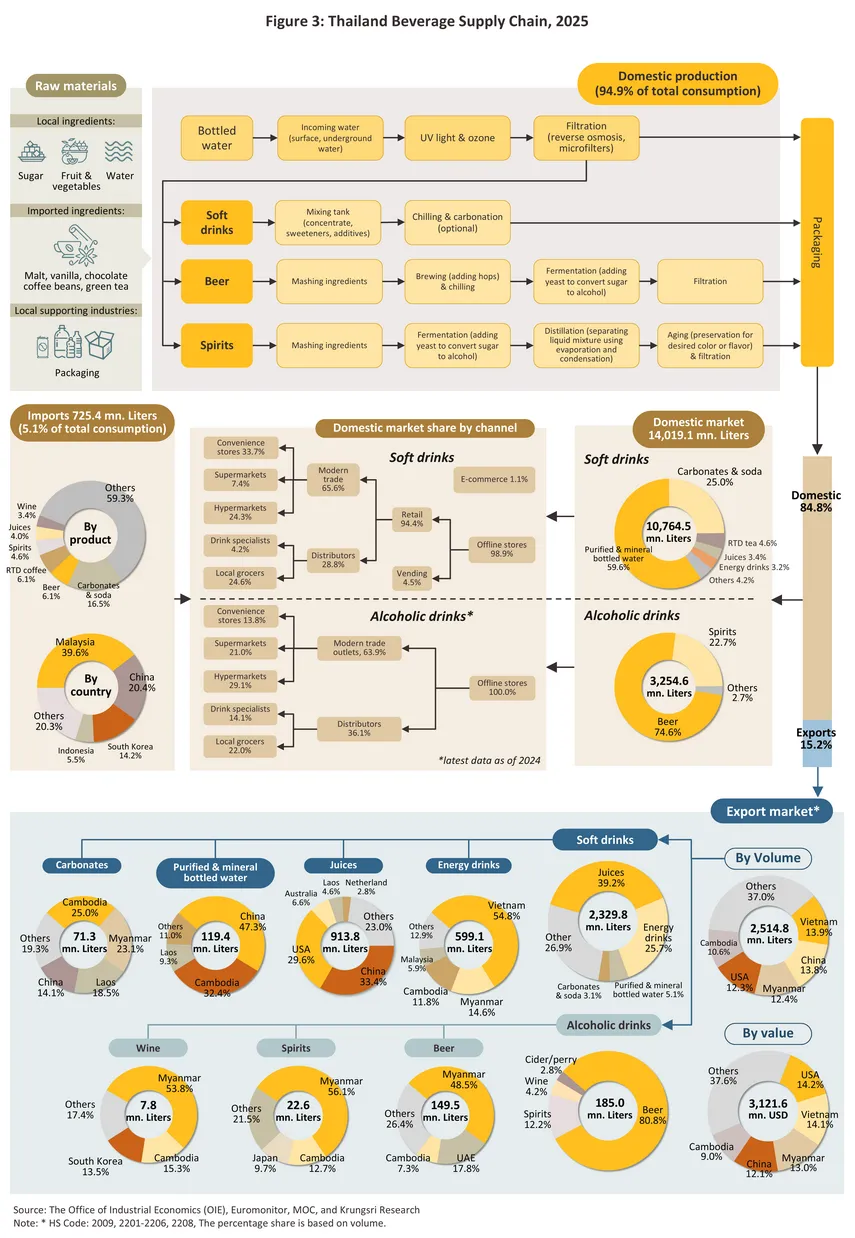
Thailand's beverage industry is overwhelmingly domestically oriented, with local production accounting for 94.9% of total beverage supply. The remaining 5.1% is sourced from imports, with alcoholic beverages comprising 15% of import volume and 70% of import value. The domestic market is the primary outlet, absorbing 84.8%1/ of total sales volume. As of 2025, a total of 407 beverage manufacturing facilities were registered with the Department of Industrial Works, comprising of 375 non-alcoholic drink factories (92% of the total) and 32 alcoholic drink factories (8% of the total).
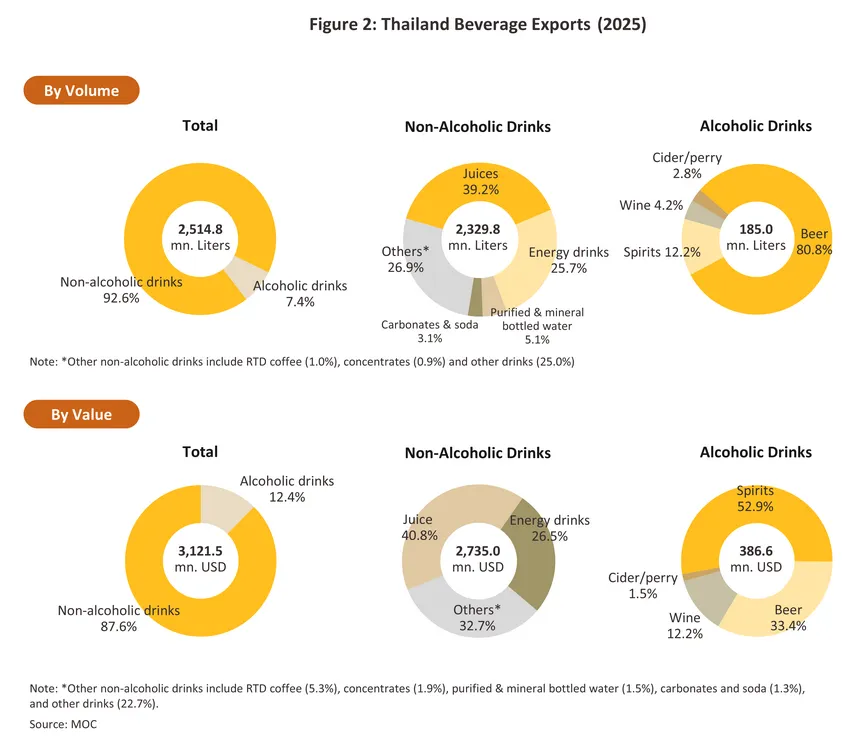
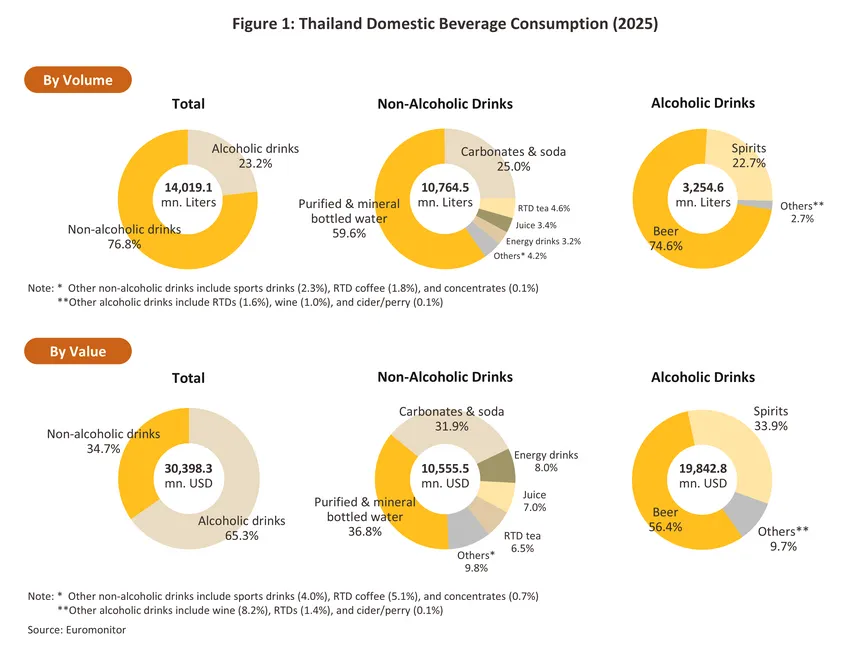
In 2025, Thailand's domestic beverage sales volume totaled 14,019.1 million liters, valued at USD 30,398.3 million2/. By volume, the split between non-alcoholic and alcoholic drinks stood at 77:23; by value, this ratio shifted to 35:65 (Figure 1). Details are as follows.
-
Non-alcoholic drinks recorded domestic sales of 10,764.5 million liters, valued at USD 10,555.5 million. The leading product category was purified and mineral bottled water, with combined sales of 6,417.7 million liters, accounting for 59.6% of total non-alcoholic beverage volume. This was followed by carbonated and soda (25.0%), ready-to-drink tea (4.6%), fruit juice (3.4%), energy drinks (3.2%), and other beverages (4.2%), respectively.
-
Alcoholic drinks recorded domestic sales of 3,254.6 million liters, valued at USD 19,842.8 million. Beer was the dominant product, with sales of 2,426.7 million liters, representing 74.6% of total alcoholic drink volume. This was followed by spirits (22.7%), ready-to-drink alcoholic beverages (1.6%), wine (1.0%), and cider/perry (0.1%), respectively.
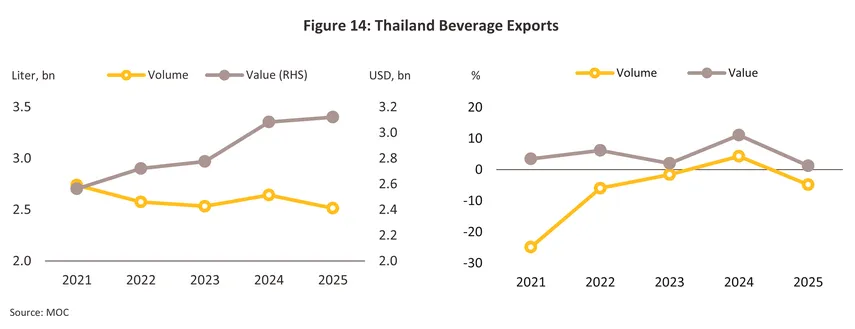
Thailand's total beverage export volume in 2025 was 2,514.8 million liters, with a combined value of USD 3,121.5 million (Figure 2). Vietnam was the top export destination, accounting for 13.9% of volume, followed by China (13.8%), Myanmar (12.4%), USA (12.3%), and Cambodia (10.6%). Exports can be broken down as follows. 1) Non-alcoholic drinks accounted for 92.6% of total export volume and 87.6% of export value. Vietnam was the leading market, with a 15.0% share of total non-alcoholic beverage export volume, followed by China (14.8%), USA (13.1%), Cambodia (10.8%), and Lao PDR (10.0%). And 2) Alcoholic drinks represented 7.4% of total export volume and 12.4% of export value. Myanmar was the leading market, with a 48.4% share of total alcoholic beverage export volume, followed by the UAE (14.4%), Cambodia (8.1%), Japan (5.4%), and Israel (4.5%).
Situation
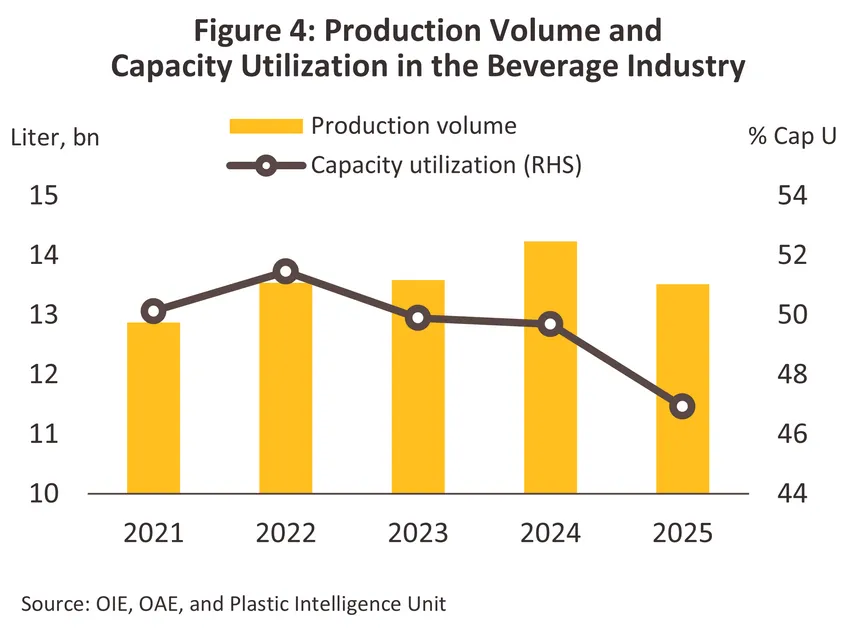
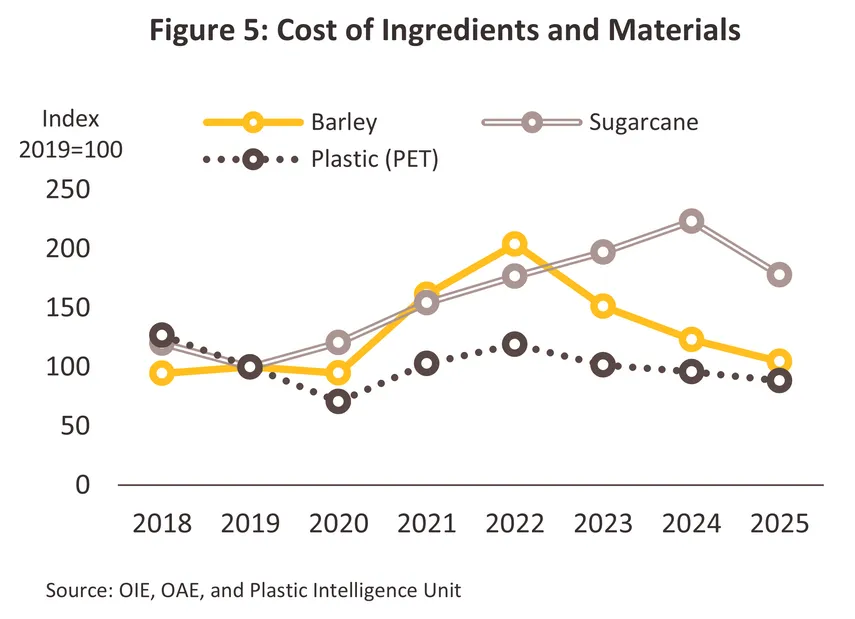
In 2025, Thailand's total beverage production contracted -5.0% to 13.5 billion liters, down from 14.2 billion liters in 2024 (Figure 4). Both non-alcoholic and alcoholic drink output declined, pulling the industry-wide capacity utilization rate down to 46.9% in 2025, from 49.9% in 2024. This reflects a deliberate destocking strategy among a number of operators following the significant restocking activity of 2024 (Figure 4), while raw material costs also trended downward in line with the contraction in production volume (Figure 5). In Q1 2026, output continued to contract at -1.9% YoY, owing to softening demand and sharply higher production costs — particularly for plastic packaging — driven by unrest in the Middle East, prompting operators to continue prioritizing the drawdown of elevated inventory levels. A breakdown by product category is as follows.
-
Non-alcoholic drinks: Production volume declined -6.1% in 2025 to 10.6 billion liters, down from 11.3 billion liters in 2024. In Q1 2026, output continued to contract at -1.5% YoY, driven primarily by declines in ready-to-drink tea and energy drink production. The key product categories are as follows.
-
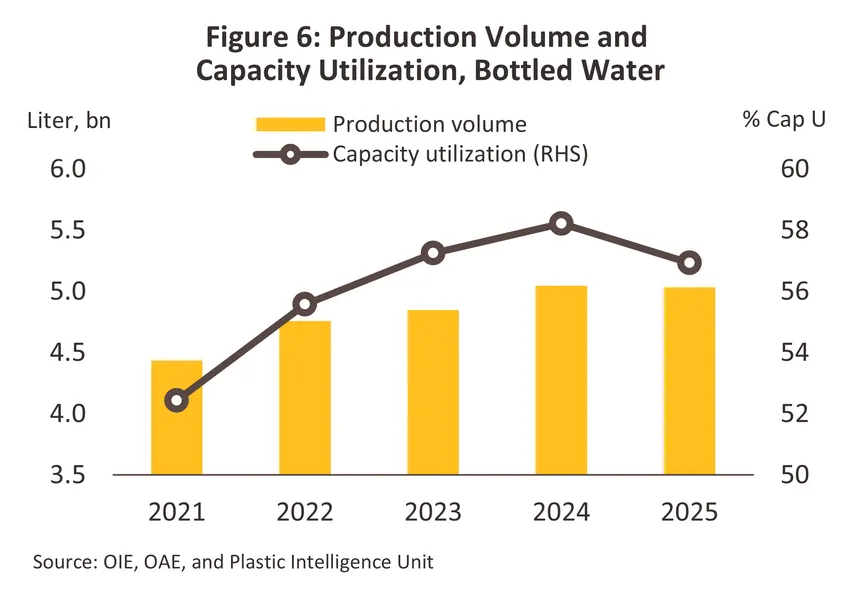
Purified and mineral bottled water: Production volume in 2025 was broadly stable, edging down just -0.3% to 5.0 billion liters (Figure 6). Purified water output contracted modestly at -1.5%, partly reflecting a focus on destocking over production expansion during a period of weak purchasing power among middle-to-lower income consumers, though its status as an essential good limited the extent of the decline. This contrasted with mineral water production, which grew strongly at +10.7%, supported by rising health consciousness among upper-market consumers and an increasing number of premium new product launches in line with the premiumization trend. In Q1 2026, combined production of purified and mineral bottled water continued to slip slightly at -0.7% YoY, weighed down by economic conditions and elevated living costs stemming from the impact of the Middle East conflict.
-
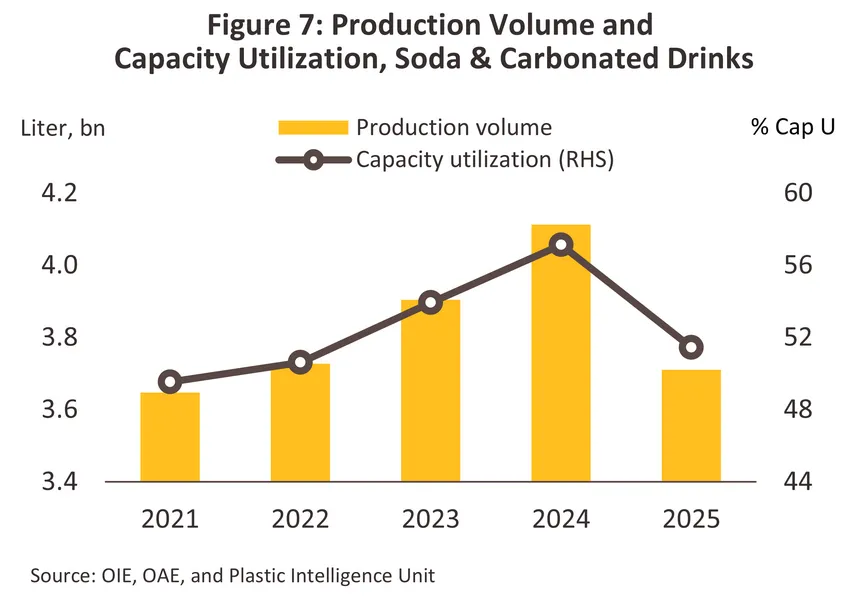
Carbonated and soda: Production volume in 2025 declined -9.8% to 3.7 billion liters (Figure 7). Carbonated drink output fell by more than -10.4%, driven by temporary production line shutdowns for maintenance at a number of facilities, as well as the adverse impact of the closure of the Thailand–Cambodia border crossings — a key export market. Soda production similarly contracted -6.0%. However, in Q1 2026, combined output of carbonated drinks and soda returned to modest growth of +1.6% YoY driven by some manufacturers resuming production and developing new reduced-sugar products with novel flavors that appeal to modern, health-conscious consumers.
-
Alcoholic drinks: Production volume contracted -1.1% in 2025 to 2.94 billion liters, down from 2.97 billion liters in 2024. In Q1 2026, output contracted a further -3.6% YoY, reflecting continued softness in demand. The breakdown by key product is as follows.
-
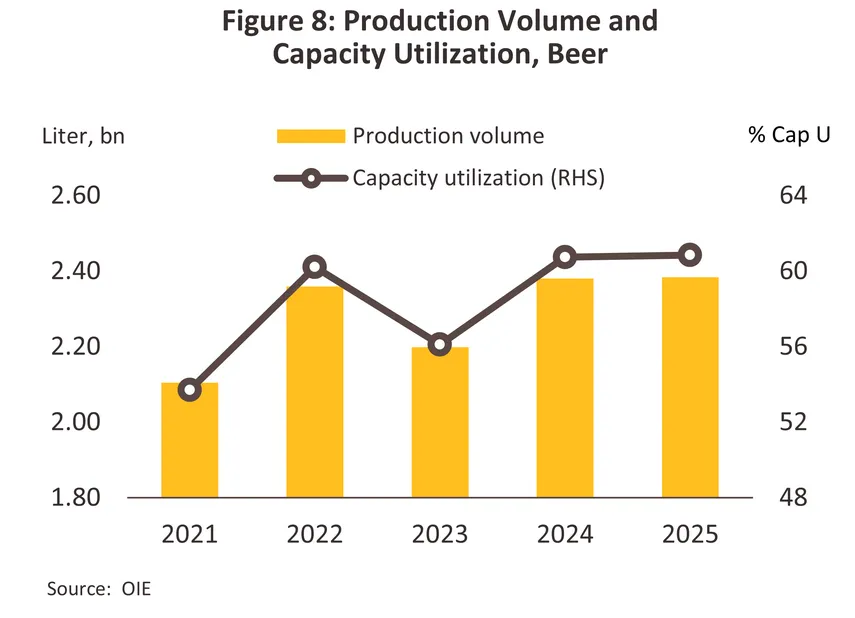
Beer: Production volume was flat at +0.2% in 2025, totaling 2.4 billion liters (Figure 8), supported by (1) resilient domestic demand, and (2) production for export to Myanmar in response to rising demand. These gains were partially offset by a decline in production destined for the Cambodian export market. In Q1 2026, output contracted modestly at -1.4% YoY reflecting softer purchasing power and more cautious consumer spending amid rising living costs associated with the Middle East conflict.
-
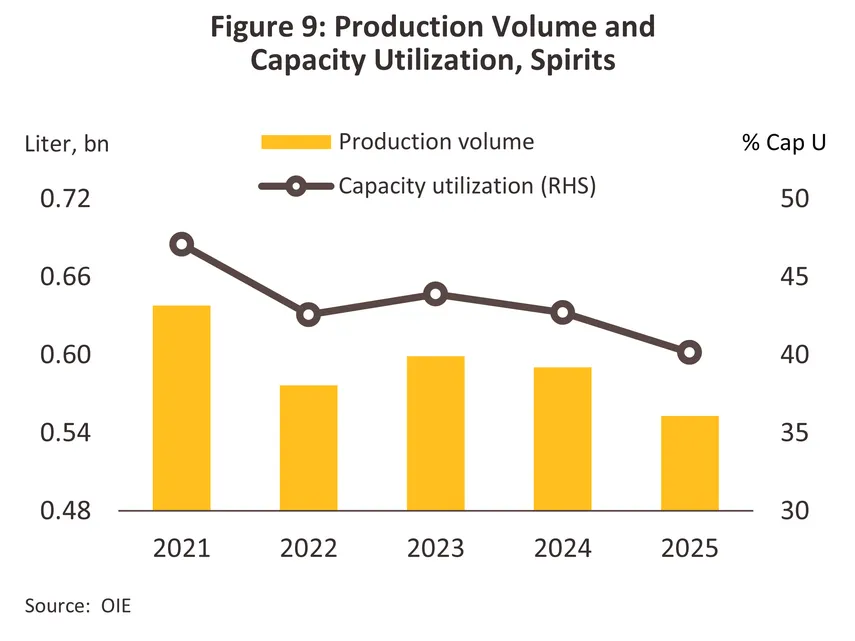
Spirits: Production volume contracted -6.3% in 2025 to 0.55 billion liters (Figure 9), as producers cut output to draw down elevated inventory levels. This was reflected in a -15.8% decline in spirits inventory in 2025, from 0.52 billion liters in 2024 to just 0.44 billion liters in 2025 — the lowest level recorded since 2018 — amid growing health awareness campaigns and weakening purchasing power that prompted consumers to exercise greater caution in spending on discretionary goods. In Q1 2026, production continued to contract at -12.7% YoY, weighed down by economic uncertainty and mounting cost-of-living pressures.
In 2025, domestic beverage sales volume grew 2.0% to 14.0 billion liters. In Q1 2026, the volume of domestic beverage sales edged up 0.5% YoY3/, driven primarily by demand for non-alcoholic drinks, while the volume of alcoholic drink sales continued to contract amid elevated living costs that weighed on consumer spending. A breakdown by category is as follows.
-
Non-alcoholic drinks: Sales volume grew 1.6% in 2025 to 10.8 billion liters. In Q1 2026, the volume of non-alcoholic drink sales expanded 1.2% YoY, supported by restocking activity in the carbonated and soda segment, as well as the resumption of ready-to-drink coffee production lines by certain manufacturers, resulting in greater product availability on the market. The key product categories within this segment are as follows.
-
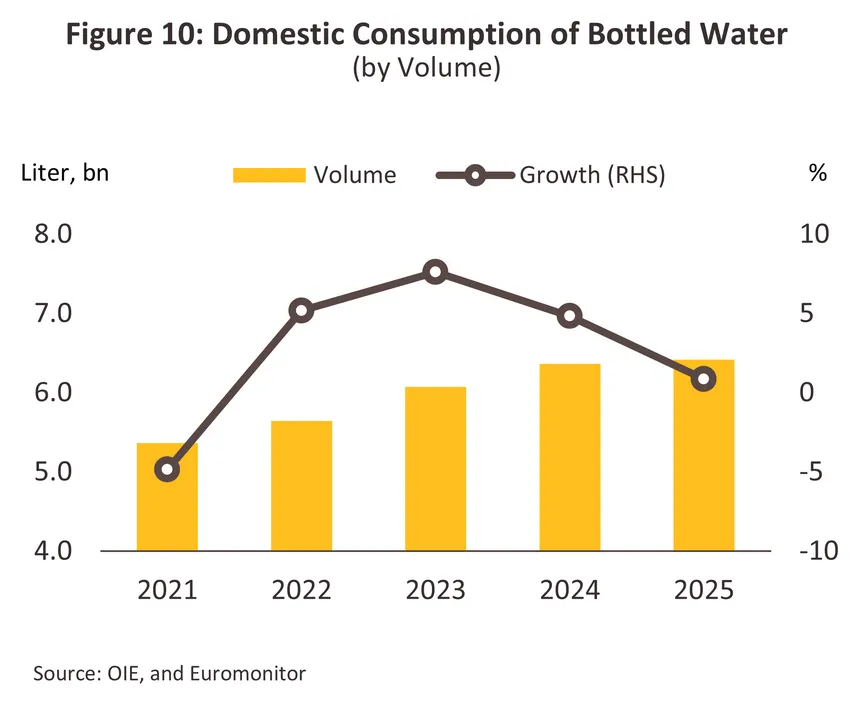
Purified and mineral bottled water: Sales volume grew modestly by 0.9% in 2025 to 6.4 billion liters (Figure 10), supported by hotter weather conditions and a continued rise in health-conscious demand for clean drinking water. In Q1 2026, however, the sales volume of purified and mineral bottled water contracted -2.4% YoY, reflecting broadly weaker purchasing power, as well as a slowdown in the tourism market stemming from the Middle East crisis and a decline in international flight volumes.
-
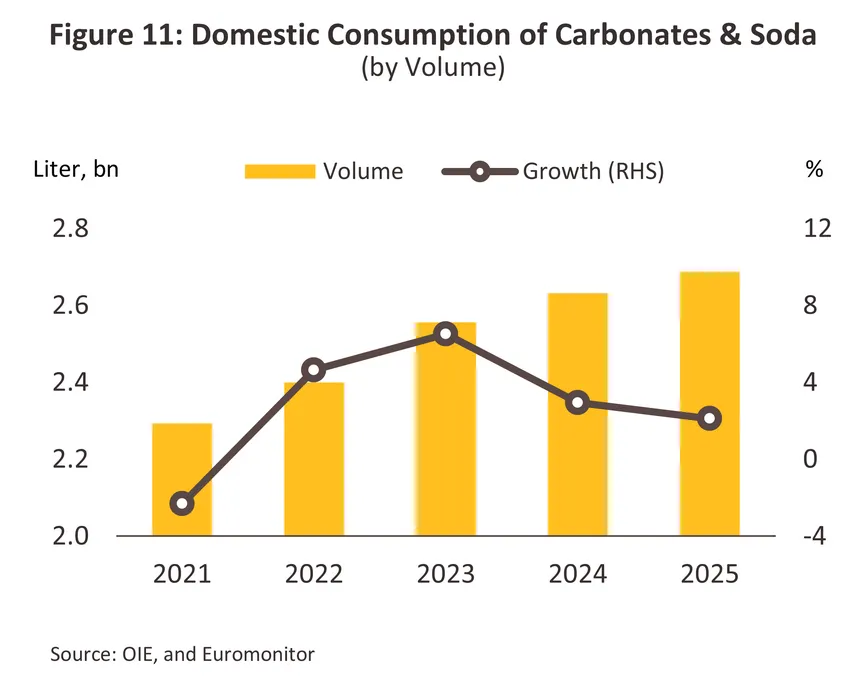
Carbonated and soda: Sales volume rose 2.1% in 2025 to 2.7 billion liters (Figure 11), driven by new product launches from manufacturers capitalizing on the health trend, notably by expanding the flavor range and variety of zero-sugar carbonated and sodas to better capture the younger consumer segment. In Q1 2026, the sales volume of carbonated and soda expanded 5.3% YoY driven by new product launches featuring diverse flavors and healthier formulations, which continued to drive demand among younger consumers.
-
Alcoholic drinks: Domestic sales volume grew 3.6% in 2025 to 3.3 billion liters. In Q1 2026, however, the volume of domestic alcoholic drink sales contracted -2.0% YoY, reflecting increasingly cautious consumer spending and a slow recovery in inbound tourist arrivals. The key product categories within this segment are as follows.
-
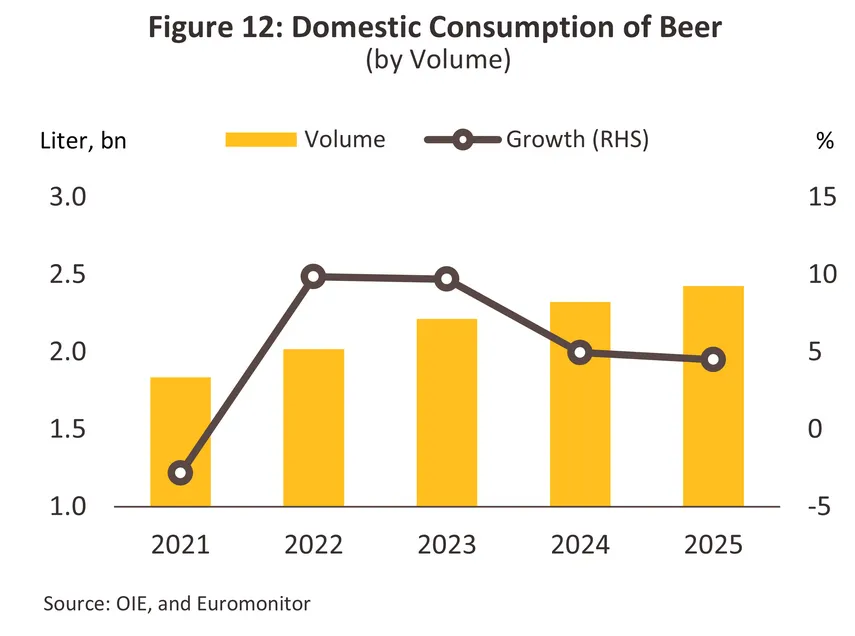
Beer: Sales volume rose 4.5% in 2025 to 2.4 billion liters (Figure 12), driven by competitive product development across a wider range of craft beer formats, including low-calorie options, broadening the choices available to consumers across multiple segments. This was further supported by the entry of new market players and the expansion of partnerships among existing ones in pursuit of greater market penetration, enabling the industry to absorb a higher level of demand. In Q1 2026, however, beer sales volume contracted -1.2% YoY, in line with more cautious consumer spending amid rising living costs.
-
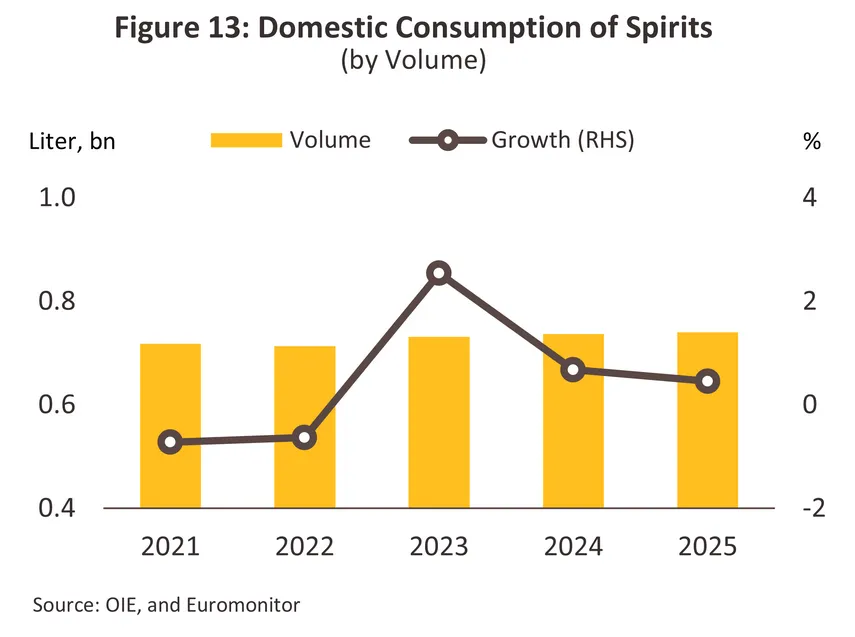
Spirits: Sales volume edged up 0.5% in 2025 to 0.74 billion liters (Figure 13). Growth was limited as some consumers shifted toward ready-to-drink (RTD) alcoholic beverages, attracted by their wider variety of flavors, ease of consumption, and the convenience of being able to enjoy a single serving at home without needing to visit a pub or bar or purchase a full bottle. In Q1 2026, spirits sales volume contracted more than -5.4% YoY, reflecting the same demand pressures that weighed on the domestic beer market.
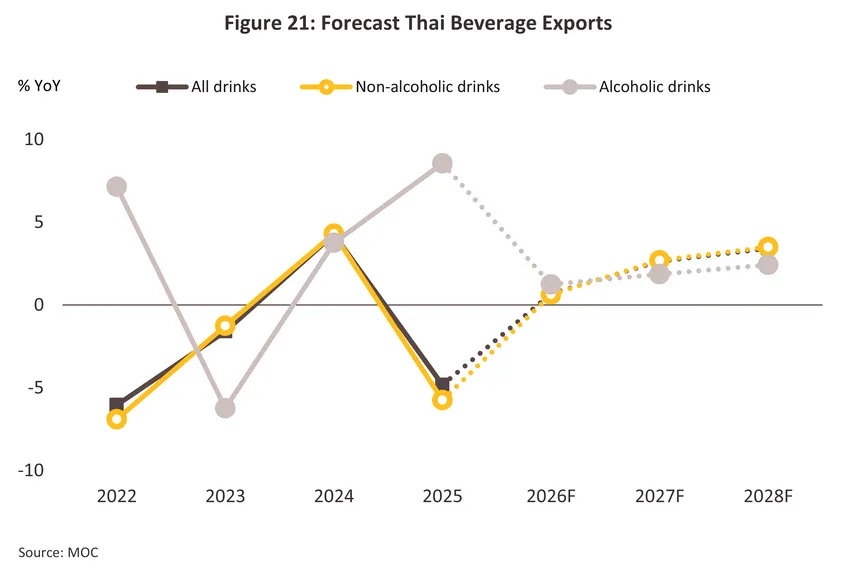
In 2025, total export volume stood at 2.51 billion liters (-4.8%), while export value reached USD 3.12 billion (+1.3%) (Figure 14). The contraction in export volume was largely concentrated in purified and mineral bottled water (-36.8%) and energy drinks (-12.5%), particularly across border markets where tensions have persisted. Export value nonetheless managed to grow, supported by higher product prices in line with rising transportation costs. In Q1 2026, export volume contracted -12.3% YoY and export value declined -7.2% YoY, with the primary drag coming from a fall in shipments to Cambodia amid ongoing border trade closures and persistent tensions along the border. A breakdown by key export products is as follows.
-
Non-alcoholic drinks: Export volume contracted -5.7% in 2025, while export value grew +1.9%. The primary drag came from a sharp decline in shipments to Cambodia — a key export market — across multiple product categories, driven by the prolonged Thailand–Cambodia border conflict that has resulted in repeated trade crossing closures. As a result, non-alcoholic drink export volume continued to contract -12.1% YoY in Q1 2026. A breakdown by product is as follows.
-
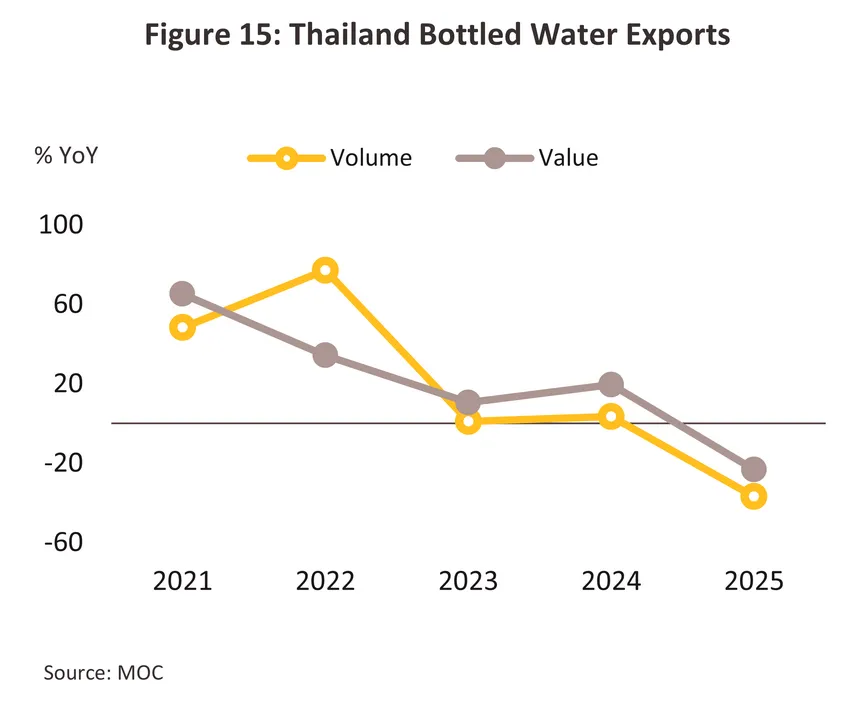
Purified and mineral bottled water: Export volume declined by more than -36.8% and export value fell -23.3% in 2025 (Figure 15), driven by a -49.9% contraction in shipments to Cambodia — Thailand's second-largest export destination for bottled water, with a 32.4% share of total export volume. This was further compounded by weakening demand from Myanmar and Lao PDR, which dropped -44.0% and -52.7% respectively, reflecting softer economic conditions and diminished purchasing power in both markets. In Q1 2026, purified and mineral bottled water export volume continued to contract sharply at more than -68.0% YoY.
-
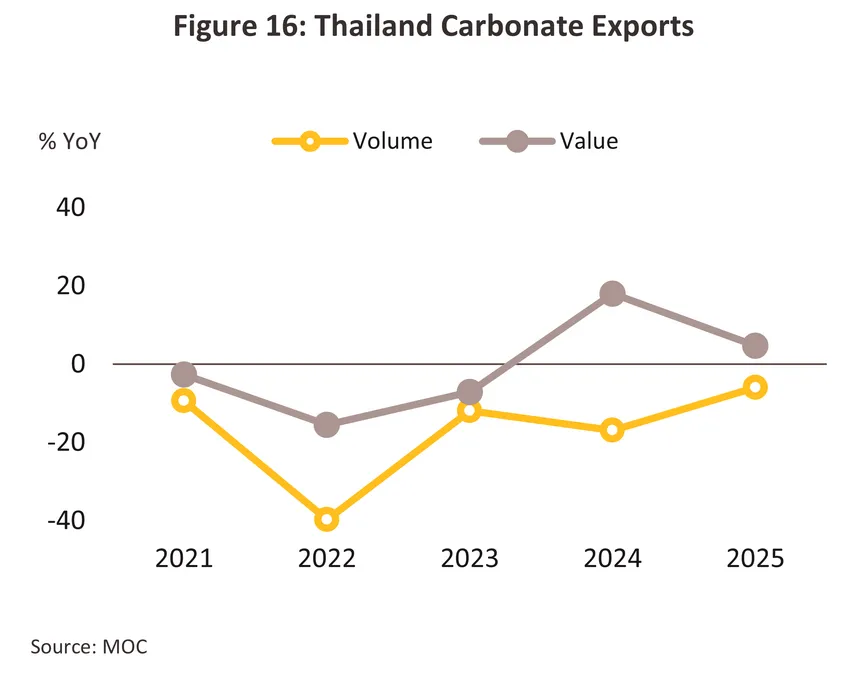
Carbonated and soda: Export volume contracted -5.9% in 2025, while export value grew 4.7% (Figure 16), with the volume decline driven by a more than -60.6% drop in shipments to Cambodia — which accounted for over one quarter of Thailand's total carbonated drink export volume in 2025. Export value nonetheless expanded, reflecting price increases associated with the ongoing premiumization of product offerings. In Q1 2026, carbonated and soda export volume contracted -23.4% YoY.
-
Alcoholic drinks: Export volume grew 8.6% in 2025, while export value contracted -2.8% — the latter reflecting declines in export value within the spirits and wine categories. The Myanmar market continued to expand, while the primary drag came from a contraction in the Cambodian market. In Q1 2026, however, alcoholic drink export volume contracted more than -14.5% YoY, driven by continued weakness in shipments to Cambodia. A breakdown by key product is as follows.
-
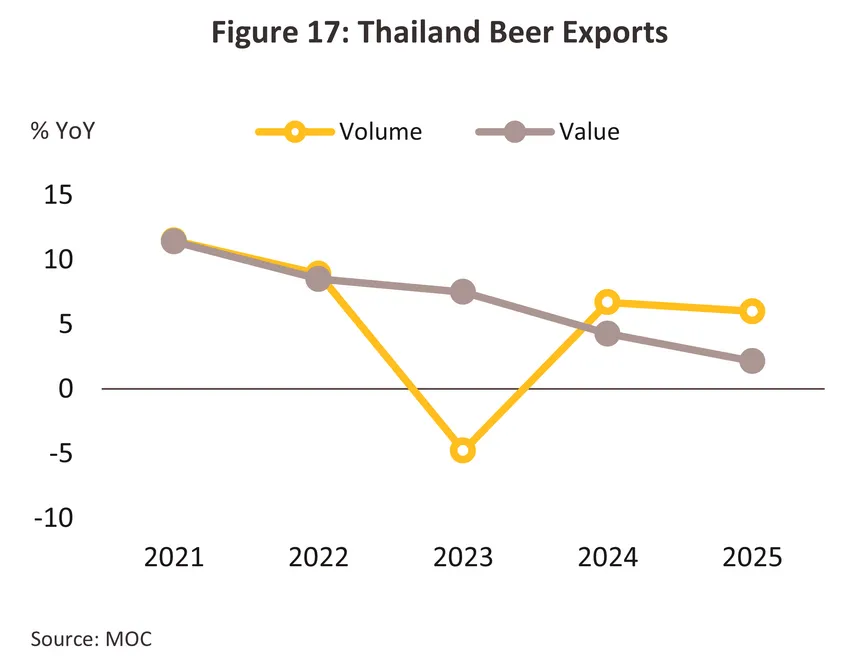
Beer: Export volume rose 6.0% and export value grew 2.2% in 2025 (Figure 17), driven by a more than 9.3% increase in shipments to Myanmar — Thailand's primary beer export market, commanding a 48.5% share of total beer export volume. Growth was also supported by strong gains in newer markets, with exports to Malaysia and Israel rising 64.0% and 34.8% respectively, reflecting exporters' accelerated efforts to expand into new markets through roadshows and market development activities. In Q1 2026, however, beer export volume contracted -11.8% YoY, as shipments to Cambodia continued to decline.
-
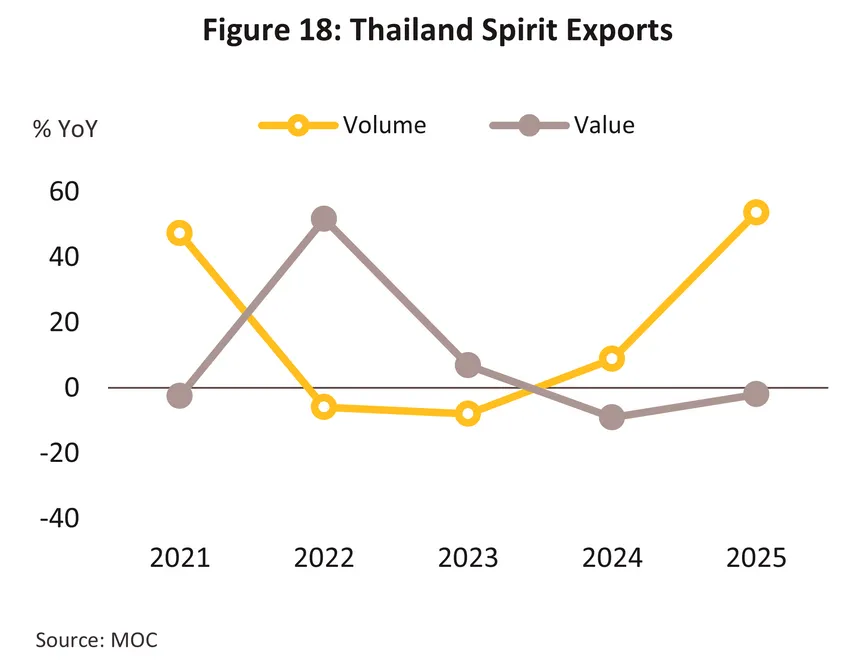
Spirits: Export volume surged 53.6% in 2025, while export value contracted -2.0% (Figure 18). The primary growth driver was a +135.1% increase in shipments to Myanmar, underpinned by robust demand, new product launches, and an expanding distribution network — particularly through modern retail outlets. The decline in export value, however, reflects a trend toward downsizing product formats at lower price points in response to increasingly cost-conscious consumer spending. In Q1 2026, spirits export volume contracted -30.3% YoY, driven by declines in shipments to both Russia and Cambodia.
Outlook
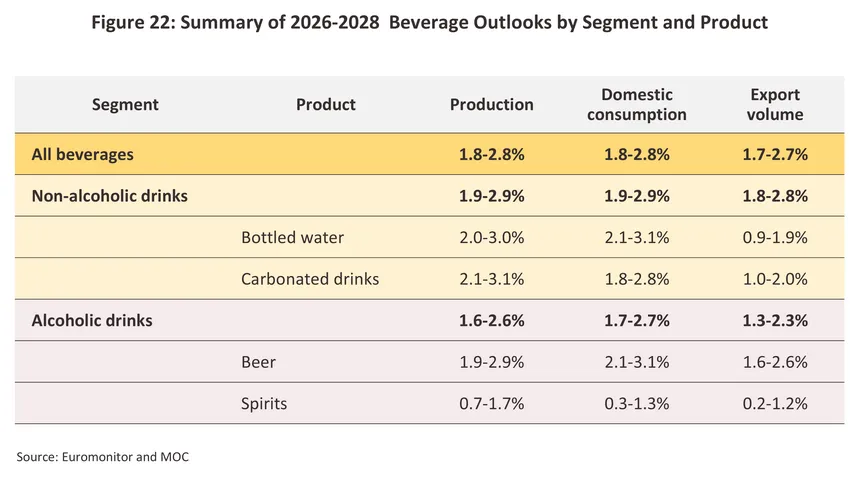
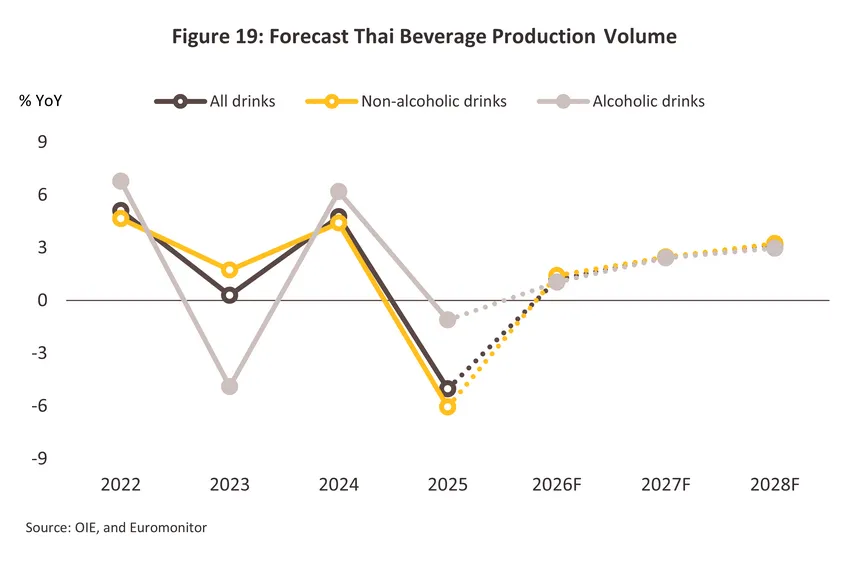
Over 2026–2028, Thailand's total beverage production volume is forecast to grow at an average of 1.8–2.8% per year (Figure 19). Key growth drivers include: (1) a gradual recovery in domestic demand, along with foreign tourist arrivals that retain growth potential in 2027–2028, despite remaining in contraction in 2026 due to the impact of the Middle East crisis; (2) capacity expansion investments by major producers, along with the adoption of technologies to improve production and logistics quality; and (3) new product development in the functional drink segment. The outlook by key product category is as follows.
-
Non-alcoholic drinks: Domestic production volume is forecast to grow 1.9–2.9% per year, comprising: (1) purified and mineral bottled water growth of 2.0–3.0% annually, supported by its status as an essential consumer good with sustained underlying demand, as well as the development of premium mineral water and drinking water products — particularly vitamin water — that are stimulating the health-focused market segment; and (2) carbonated and soda growth of 2.1–3.1% per year, partly driven by the reopening of certain previously closed or upgraded production facilities, along with the development of a wider variety of zero-sugar formulations in line with the preferences of health-conscious consumers and the backdrop of rising temperatures.
-
Alcoholic drinks: Total domestic production volume is forecast to grow 1.6–2.6% per year, comprising: (1) beer growth of 1.9–2.9% annually; and (2) spirits growth of 0.7–1.7% per year. Growth will be supported by the anticipated progressive relaxation of alcohol sales regulations, notably the extension of permitted sales hours to include the 14:00–17:00 window, which is currently undergoing a 180-day pilot and has shown encouraging preliminary results4/ — raising the prospect of this measure becoming permanent and providing a lasting boost to demand. This is expected to benefit beer in particular, where ongoing product development is catering to an increasingly diverse range of niche markets, including non-alcoholic beer, low-calorie beer, and craft beer, among others.
Nevertheless, Thailand's beverage production sector continues to face a number of key challenges, namely: (1) supply and cost volatility for critical agricultural inputs such as sugarcane, barley, and malt, driven by increasingly erratic climate conditions; (2) rising packaging and logistics costs, in line with energy price trends amid ongoing geopolitical conflicts; (3) regulatory and policy uncertainty, particularly with respect to the sale and importation of alcoholic beverages, as well as measures governing cross-border trade with Cambodia — one of Thailand's most important beverage export markets; and (4) environmental regulations, which may raise costs related to packaging and the adaptation of production processes.
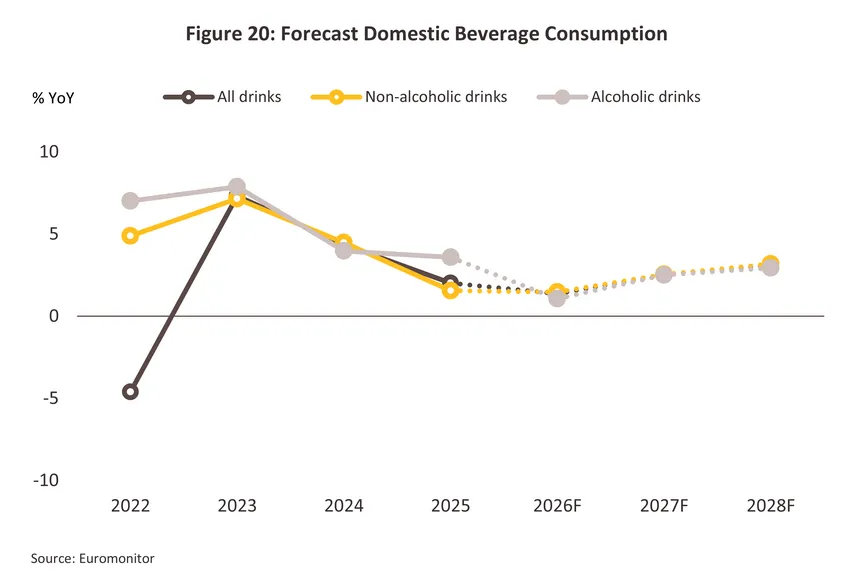
Domestic beverage sales volume is forecast to grow 1.8–2.8% per year (Figure 20). Growth is expected to be subdued in 2026, weighed down by a slowing economy and rising living costs in line with oil price trends amid the Middle East crisis, compounded by higher production and packaging costs that are pushing up beverage prices. Growth should then gradually pick up in 2027–2028, supported by: (1) rising temperatures each year, sustaining demand for refreshing beverages; (2) a gradual recovery in domestic demand and foreign tourist arrivals, which will support growth in restaurants, hotels, pubs, bars, and related businesses; (3) the continued expansion of convenience stores and modern retail outlets, improving consumer access to products; and (4) new product development that better meets consumer needs, particularly in the functional drink segment. However, growing health awareness leading some consumers to cut back on carbonated drink and alcohol consumption may act as a constraint, limiting the overall pace of growth. The outlook by key product category is as follows.
-
Non-alcoholic drinks: Domestic sales volume is forecast to grow 1.9–2.9% per year over 2026–2028, comprising: (1) purified and mineral bottled water growth of 2.1–3.1% annually, driven by a growing consumer trend toward health consciousness and a preference for pure drinking water — with premium water products such as mineral water, alkaline water, and vitamin-infused water positioned as strong growth segments; and (2) carbonated and soda growth of 1.8–2.8% per year, supported by the development of new products enriched with vitamins or minerals while reducing sugar content or substituting non-sugar sweeteners, better aligning with the preferences of modern consumers, as well as the expansion of distribution channels into food court venues.
-
Alcoholic drinks: Domestic sales volume is forecast to grow 1.7–2.7% per year over 2026–2028, comprising beer growth of 2.1–3.1% annually and spirits growth of 0.3–1.3% per year. Growth will be underpinned by the continuing gradual recovery of the tourism sector, along with anticipated progressive relaxation of alcohol regulations — covering sales hours, importation, and advertising restrictions. In addition, intensifying competition is prompting operators to accelerate the development of new product formats with reduced alcohol content and lower calorie counts, as well as a wider range of RTD spirits and craft beers with diverse flavor profiles, helping to attract consumers seeking differentiated alternatives.
Export volume is forecast to grow 1.7–2.7% per year (Figure 21). A breakdown by product category is as follows.
-
Non-alcoholic drinks: Export volume is forecast to grow 1.8–2.8% per year, with the outlook by key product as follows. (1) Purified and mineral bottled water: 0.9–1.9% per year, with China and the CLMV countries remaining the primary markets given their sustained demand for safe, standard-quality drinking water, despite a moderating purchasing power outlook. (2) Carbonated and soda: 1.0–2.0% per year, driven by Thai producers' market expansion efforts — particularly into ASEAN markets including Indonesia, the Philippines, and Vietnam, as well as South Korea — alongside product diversification toward premium and functional drink formats. (3) Energy drinks: 1.2–2.2% per year, with growth driven primarily by Vietnam, which has a large and growing young and working-age population seeking convenient, fast-acting energy sources suited to a fast-paced lifestyle. (4) Fruit juices: 2.3–3.3% per year, with key markets China and the US expected to maintain growth momentum, underpinned by rising consumer preference for natural, health-oriented beverages — an area where Thai fruit juice products enjoy strong recognition for their distinctive flavors and high-quality agricultural inputs.
-
Alcoholic drinks: Export volume is forecast to grow 1.3–2.3% per year, with beer projected at 1.6–2.6% annually and spirits at 0.2–1.2% per year. Thailand's primary alcoholic drink export market — Myanmar — continues to show a growth outlook, underpinned by strong confidence in Thai product quality, the market expansion efforts of major Thai producers, and the continued growth of urban populations and the middle class.
Nevertheless, beverage exports continue to face a number of headwinds, namely: (1) the protracted Thailand–Cambodia border conflict, which may result in prolonged trade crossing closures and a rise in anti-Thai sentiment in Cambodia — potentially prompting Cambodia, one of Thailand's most important export markets across nearly all beverage categories, to reduce its imports of Thai beverages; (2) US trade protectionism in the form of higher import tariffs, which may dampen demand for Thai beverages, particularly fruit juices; and (3) ongoing geopolitical instability across multiple regions, which may continue to exert upward pressure on energy costs for both production and transportation.
Sustainability in the beverage industry
Sustainability has become a central pillar of the beverage business in Thailand. ESG (Environmental, Social, and Governance) considerations have emerged as a key driving force pushing the beverage industry toward greater sustainability, as both consumers and investors place increasing importance on products that are environmentally friendly and socially responsible, prompting companies to adapt in order to meet these evolving expectations.
-
The environment
-
Promoting the use of sustainable packaging: This involves selecting environmentally friendly packaging materials, such as biodegradable bioplastics, or designing packaging that can be reused or recycled, as well as collaborating with packaging manufacturers to develop new innovations that reduce the use of plastic and non-biodegradable materials.
-
Promoting sustainable agriculture: The sourcing and use of sustainably produced raw materials is a key priority. This includes favoring organically grown inputs, reducing reliance on chemical inputs, and supporting crop rotation practices, as well as sourcing from farms that cultivate a diverse range of crops — thereby enhancing biodiversity and carbon sequestration, with positive implications for supply chain sustainability.
-
Sustainable water management: This encompasses managing water resources to reduce consumption during the production process, ensuring proper treatment of production wastewater, and implementing efficient water recycling systems.
-
Reducing carbon emissions: This involves transitioning to renewable energy sources such as solar and wind power or investing in energy-saving technologies such as energy-efficient machinery or the recovery and reuse of heat generated during production processes within the facility.
-
Waste management: Managing production waste through source reduction and material reuse, as well as applying circular economy principles to the production process, helps minimize the consumption of new resources and allows previously used materials — such as packaging and manufacturing byproducts — to be repurposed and reused.
-
Social issues
-
Promoting healthier drink choices: This involves the use of detailed and accurate labeling to provide consumers with clear nutritional information, as well as encouraging responsible alcohol consumption through the development of low-alcohol and non-alcoholic products, and supporting the creation of safer drinking environments, particularly for women.
-
Corporate Social Responsibility (CSR): This includes policies aimed at minimizing impacts on local communities throughout the project lifecycle, from the pre-construction phase through ongoing operations, as well as supporting socially beneficial initiatives such as healthcare facilities and scholarships for underprivileged children in local communities.
-
Creating a positive work environment: This involves prioritizing employee safety and welfare, including through training programs and skills development initiatives.
-
Forestation and ecological restoration: This includes participating in reforestation and natural habitat restoration projects to offset greenhouse gas emissions and strengthen local biodiversity, as well as supporting farmers in adopting sustainable food production practices.
-
Governance
-
Transparency and accountability: This requires clear and transparent corporate governance practices, such as the disclosure of ESG-related operational data, as well as effective communication of ESG matters to employees — enabling staff to understand the importance of ESG issues and their own role in achieving related objectives.
-
Promoting diversity within the organization: This involves setting targets to increase the diversity of the board of directors, while creating opportunities for underrepresented groups or those who have had limited chances to demonstrate their potential. Such measures help advance social equity and enhance the effectiveness of talent acquisition and retention within the organization.
-
Risk management: This encompasses the assessment and management of risks that may arise from business operations, such as those associated with climate change.
1/ Source: Euromonitor and Ministry of Commerce (MOC)
2/ Based on the Bank of Thailand's average exchange rate for 2025 of THB 32.88 per USD 1.
3/ For the domestic market analysis, annual domestic sales volume data is sourced from Euromonitor. For Q1 2026, monthly domestic sales value data is sourced from the Office of Industrial Economics (OIE).
4/ Souถฝ ce: Watch the 6-Month Trial of Lifting Alcohol Sales Ban from 2-5 PM: Economic Boost or Increased Risk?
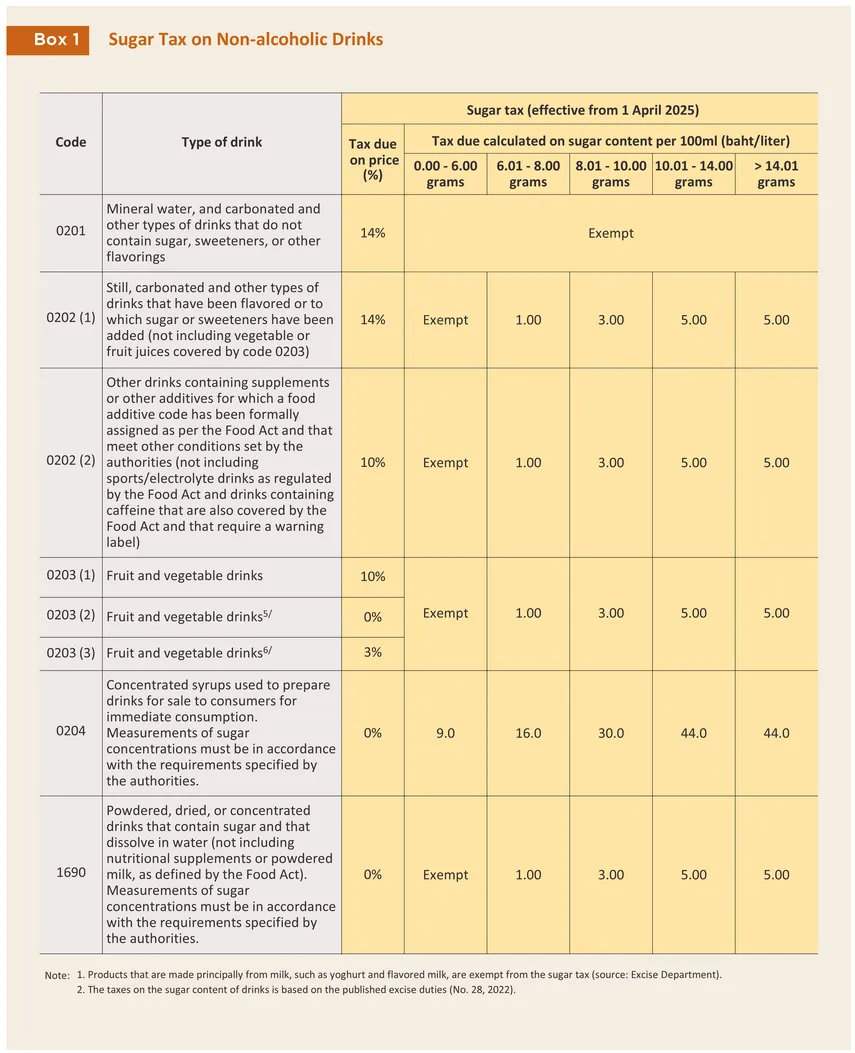
5/ Source: Announcement by the Excise Department on the criteria for charging tax on the value of fruit and vegetable drinks
6/ Source: Announcement by the Excise Department on the criteria for charging tax on fruit and vegetable drinks that have been sweetened or that contain other additives.


.webp.aspx)