EXECUTIVE SUMMARY
Through 2026, market conditions for the chemical fertilizer industry are expected to remain largely unchanged from the previous year. Although softening global markets will bring down average domestic fertilizer prices, weak purchasing power and a potential mid-year drought will suppress demand. The situation should improve in 2027 and 2028 as the continuing strength of the tourism sector and related sectors (e.g., restaurants) gradually boosts spending power. In addition, the worsening impacts of climate change will push up global demand for food, while rising concerns with sustainability and the environment will add to demand for crops for use in the production of biofuels.
Over the next few years, the most prominent challenges facing the industry will include: (i) periodic interruptions to supply, which are then likely to precipitate price spikes; and (ii) greater use of bio- and organic fertilizer and an increased interest in organic farming, which is being driven in part by rising concerns about personal health and wellness.
Krungsri Research view
Krungsri Research sees the outlook varying for players active in different segments of the market.
-
Manufacturers: Income will continue to strengthen as farmers look to extend the total area under cultivation and so increase yields of fruit and vegetables. Overseas markets will also be buoyed by a greater focus on agricultural development. However, overall revenue growth will be limited by: (i) periodic jumps in the cost of imports, which farmers may respond to by switching to bio and organic fertilizers; and (ii) the restricted headroom available for hikes in retail prices, with large players tending to invest in the development and manufacture of innovative new products, a greater focus on sustainability, and the expansion of their distribution networks.
-
Distributors: Income growth will be limited, especially among SMEs, which are disadvantaged by both heightened competition and the larger players’ cost advantages and diversified product portfolios. To better align the supply and demand sides of the market, SMEs will thus have to manage their inventory more proactively, matching this more closely to changes in seasonal planting and forecast shifts in consumption. Importers will also need to protect against foreign exchange volatility and supply shocks by hedging and diversification, though this will add to costs and limit profitability.
Overview
Chemical fertilizers are manufactured by synthesizing different chemicals from naturally occurring plant nutrients, of which by far the most important are nitrogen (N), phosphorus (P, often in the form of P2O5) and potassium (K, often as potash or K2O). There are three major categories of chemical fertilizer:
-
Straight fertilizer contains only a single plant nutrient, although this will be synthesized into a compound that will also contain other elements. For example, of the three elements needed in large quantities by plants, urea (46-0-0) and ammonium sulphate (21-0-0) contain only nitrogen, triple superphosphate (0-46-0) is composed of only phosphate, and potassium chloride (0-0-60) contains only potassium. (The numbers refer to the percentage of nitrogen, phosphorus and potassium in the fertilizer.)
-
Compound fertilizer contains at least two of the three major plant nutrient elements. These will have been combined in a chemical process into a single compound, and so these products contain nutrients in a more regular or stable form than do mixed fertilizers. Common examples of this class of fertilizer include potassium nitrate (KNO3), diammonium phosphate (NH4)2HPO4 and potassium metaphosphate (KPO3).
-
Mixed fertilizer contains, as its name suggests, a mix of two or more straight fertilizers. For example, a commonly used fertilizer is 15-15-15, which contains equal amounts of nitrogen, phosphorus, and potassium straight fertilizers to provide equal portions of each of the three main plant nutrients.
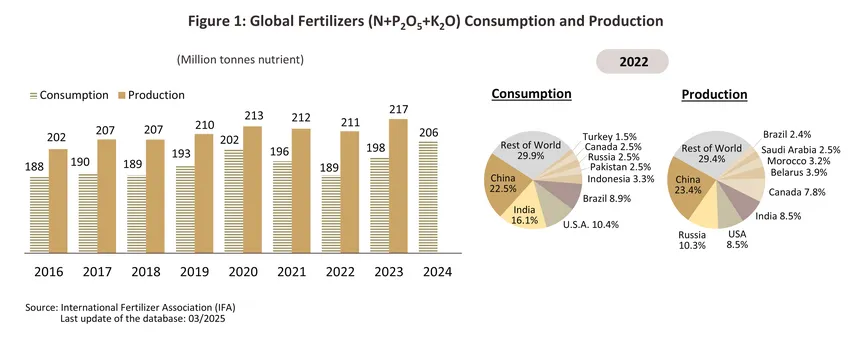
Demand for fertilizer is being lifted worldwide by the rise in the global population and the spread of urban and industrial areas, which is putting pressure on farmland and encouraging growers to lift yields further. In addition, one effect of the Covid-19 pandemic has been to encourage countries to focus more clearly on maintaining national food security, in particular by expanding the total area under cultivation and maintaining more extensive domestic fertilizer stocks. As a result, global consumption of fertilizers (N, P205 and K2O) has risen to a record high of 202 million tonnes (Figure 1), while production has climbed to 213 million tonnes.
The Russian invasion of Ukraine in 2022 had significant impacts on the supply of fertilizer. Following the outbreak of the war, global energy prices spiked, thus adding substantially to manufacturing costs, while because both combatants are major providers of fertilizer to global markets, supply also tightened sharply. In response to more challenging global conditions, some countries looked to shore up food security by tightening or entirely blocking exports of fertilizer by domestic manufacturers, the most obvious example of which was China’s ban on exports of nitrogen and phosphate fertilizers. This fed through into a 100-200% surge in prices, with per-tonne prices for urea (46-0-0) and ammonium sulfate (21-0-0) jumping from respectively USD 360 and USD 180 to USD 1,000 and USD 400. Predictably, rising prices translated into a fall in global demand, which dropped to 188 million tonnes, down -6.9% relative to the 2020 baseline. However, energy prices eased in 2023 and 2024, and because natural gas and crude are inputs into the manufacture of nitrogen fertilizer, this encouraged major suppliers (e.g., China, Russia and Canada) to expand their manufacturing capacity and to step up exports. At the same time, bottlenecks in global shipping and logistics started to clear and with global trade reviving, farmers began to increase fertilizer applications. Consumption thus rose to 198 and 206 million tonnes in each of 2023 and 2024.
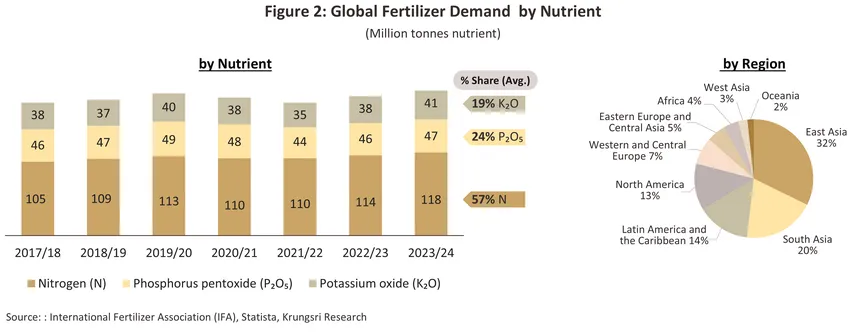
By region, East Asia is the largest consumer of fertilizer, absorbing an annual total of 63.8 million tonnes (or 32% of global demand), followed by South Asia (20% of consumption) and Latin America and the Caribbean (14%) (Figure 2). With a total output of 74.3 million tonnes (or 34% of global production), East Asia is also the world’s biggest supplier of fertilizer, and as might be expected, at respectively 23.4% and 22.5% of the total, China is the single most important manufacturer and consumer of this (Figure 1). By type, nitrogen fertilizer dominates the market (56.0% of all fertilizer demand) (Figure 2). Overall, Statista sees world demand edging up to 205 million tonnes by 2027 as an expanding global population adds to demand for food crops.
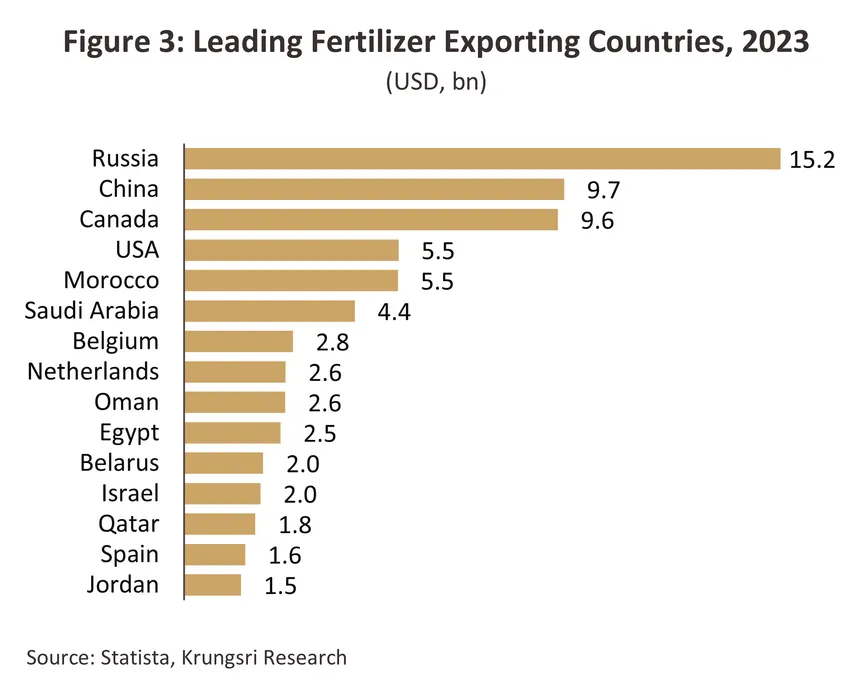
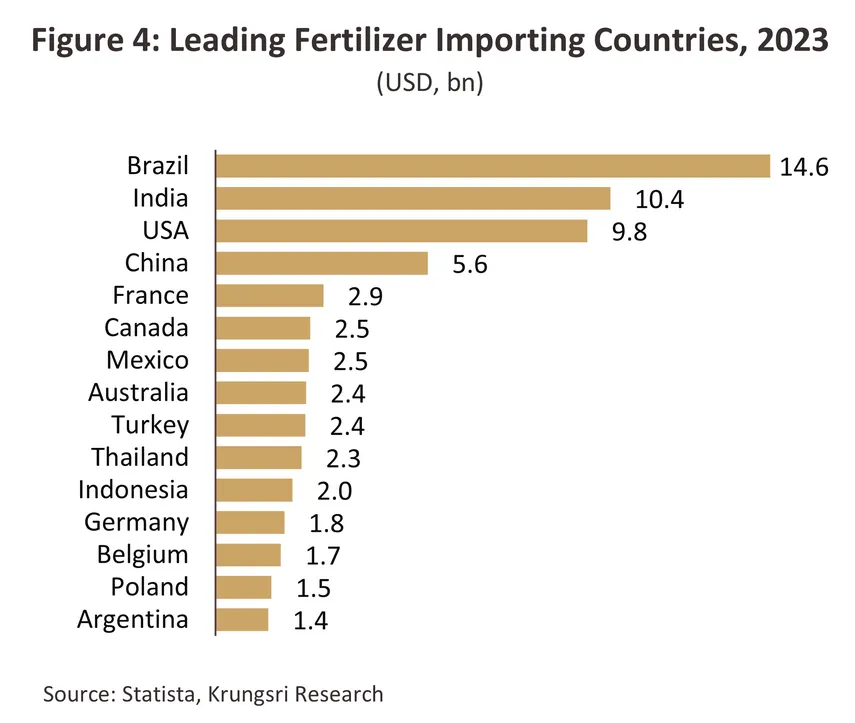
In terms of international trade, the global export value of chemical fertilizers in 2023 was USD 93.0 billion, decreasing by -30.3% from USD 134.7 billion in 2022. The country that exported the largest value of chemical fertilizers was Russia (accounting for 15.2% of global fertilizer exports), followed by China, Canada, and the United States (Figure 3). Meanwhile, the country that imported the most chemical fertilizers was Brazil (accounting for 14.6% of global fertilizer imports) (Figure 4), followed by India, the United States, and China. For Thailand, it ranked 50th among global exporters (accounting for only 0.1%) and 7th among global importers (2.6%), indicating that Thailand still relies heavily on imported fertilizer to meet the demand of the agricultural sector.
The roll out of the European Union’s CBAM (Carbon Border Adjustment Mechanism) will have a direct impact on fertilizer manufacturers since, alongside iron and steel, aluminum, cement, electricity, hydrogen, chemicals and plastics, this is one of the industries explicitly targeted by these measures. Thus, once the CBAM comes into force in 2027, importers of fertilizer will have to pay for a CBAM certificate to a value equivalent to the carbon emissions embodied in these imports. Sales into the EU will therefore become more expensive and as such, trade volume may suffer. Major exporters are hoping to head off or at least to reduce these impacts by cutting the emissions associated with their products, for example by using clean energy in manufacturing processes, deploying carbon capture and storage technologies at larger sites, and rolling out real-time carbon monitoring. Moreover, although the EU accounts for less than 1% of the value of fertilizer exports from Thailand, over the mid- to long-term, an accelerating global imperative to reduce emissions will nevertheless encourage Thai players to move in the same direction and to develop cleaner production systems themselves.
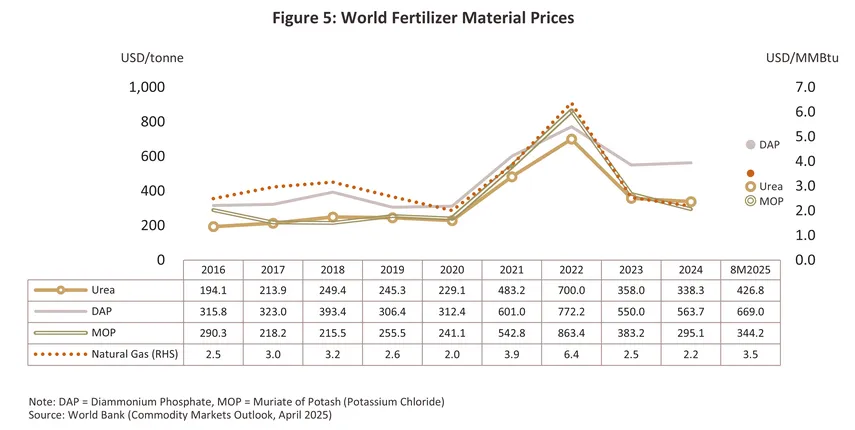
Fertilizer prices stabilized towards the end of 2024 (Figure 5) following a sharp upswing in 2021. Tight supply and rising prices had been caused by a combination of a spike in oil and gas prices that took these to seven-year highs and the lingering effects of the pandemic, which had fed through into a global shortage of shipping containers, a four-to-five-fold jump in shipping rates, and fears over prices and supply that encouraged some countries to impose controls on fertilizer exports. The market was further impacted by the outbreak of war in Ukraine, which drove fertilizer prices to record highs in 2022 and further restricted supply of potash to global markets (Russia is the world’s biggest exporter of nitrogen fertilizer and the second most important supplier of potash, while Belarus, which as a Russian ally was also caught up in war-related sanctions, is another important producer of this). In addition, prices for natural gas jumped from USD 2.0/MMBTu in 2020 to hit USD 6.4/MMBTu, and because this is the primary input into the manufacture of nitrogen (natural gas accounts for 70-85% of production costs), this then forced over 70% of European fertilizer manufacturers to cut back on output or to completely shutter production lines. At the same time, the Chinese authorities also restricted supply to global markets. However, the situation improved in 2023 and 2024 thanks to a fall in prices resulting from (i) softening energy costs, and (ii) a drop in agricultural prices, which reduced demand for fertilizer.
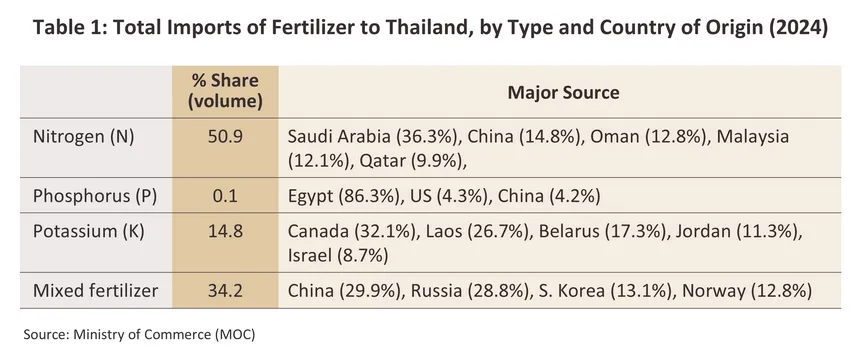
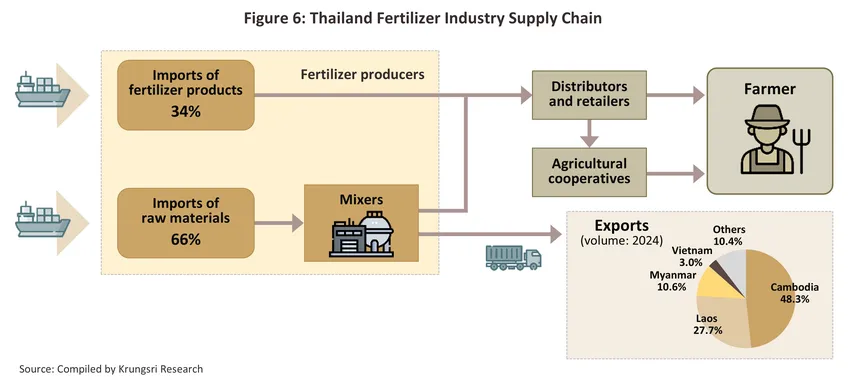
For Thailand’s chemical fertilizer industry, it is at the downstream stage and must rely almost entirely on imports from other countries. The imports can be divided into two parts: (i) Base fertilizers (raw materials) — which accounted for 65.8% of total chemical fertilizer imports in 2024, such as nitrogen fertilizers (50.9%, increasing from 48.6% in 2021), imported mainly from Saudi Arabia, China, Oman, Malaysia, and Qatar; phosphorus fertilizers (0.1%), imported mainly from Egypt, the United States, and China; and potassium fertilizers (14.8%), imported from Canada, Lao PDR, Belarus, Jordan, and Israel. Producers import base fertilizers and mix them with fillers to achieve the desired volume and nutrient proportions (two or more nutrients) according to each manufacturer’s formula; and (ii) Finished or semi-finished chemical fertilizers, accounting for 34.2%, which are blended and distributed to wholesale and retail stores. The main import sources are China, Russia, South Korea, and Norway (Table 1). As for exports, they remain relatively small, accounting for about 5% of total fertilizer production, mostly exported to neighboring countries such as Cambodia, Lao PDR, Myanmar, and Vietnam. In 2024, these countries together accounted for 89.6% of Thailand’s total fertilizer exports, compared with 79.6% in 2021.
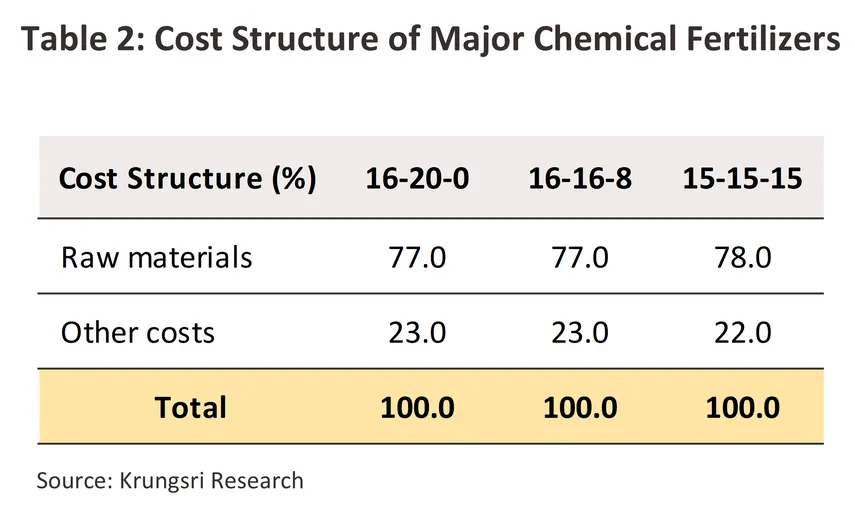
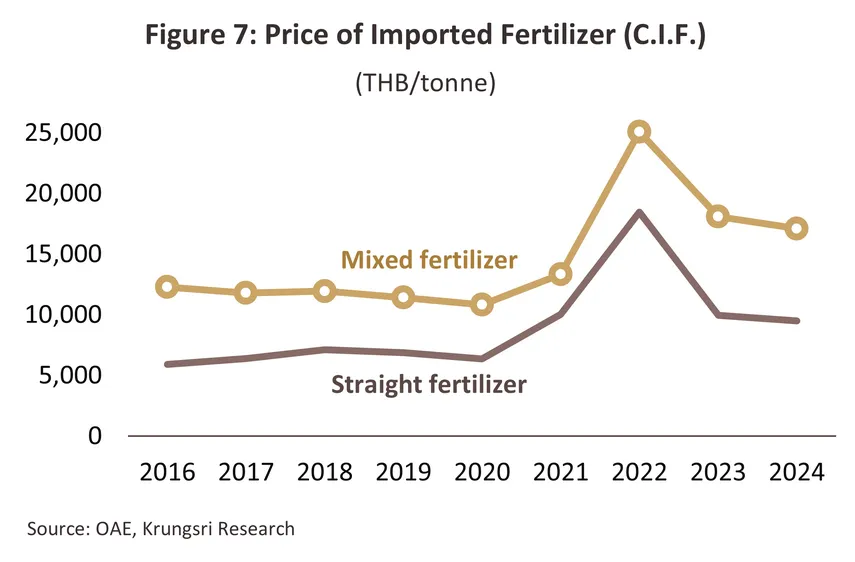
The cost structure of the industry is such that almost 80% of overheads are attributable to purchases of imported raw materials, such as urea, diammonium phosphate, and potassium chloride (Table 2). The remaining 20% of costs are for other areas, such as power and transport. Given that such a large proportion of operating overheads arise from imports, overall costs are clearly highly dependent on the direction of import prices, which are themselves determined by the prices set on world markets, although variations in the exchange rate may also add to costs. At the same time, it is difficult for manufacturers to compensate for higher costs by raising their prices because in line with the 1999 Prices of Goods and Services Act, fertilizer prices are controlled by the government via The Department of Internal Trade’s central committee on goods and services, which specifies recommended prices for some fertilizers. Manufacturers and retailers of these are then not permitted to sell goods in excess of these prices and so profit margins may be put under pressure, particularly for importers of mixed fertilizers since these carry higher costs than do straight fertilizers (Figure 7). Given this, operators typically try to expand their income base by distributing in volume.
The most commonly used fertilizers in Thailand are: (i) for straight and compound fertilizers, urea (46-0-0), ammonium sulphate (21-0-0), potassium chloride (0-0-60), and diammonium phosphate (18-46-0); and (ii) for mixed fertilizers, 16-20-0, 15-15-15, 16-16-8, and 13-13-21 mixes. Thanks to their broad range of uses with rice, fruits, and other crops, these eight types of fertilizer comprise a combined total of more than 90% of domestic fertilizer consumption and over 80% of imports (source: OAE). Domestic sales of fertilizer production and distribution are controlled by the government, and players are required to register their fertilizer with the Department of Agriculture, as required by the 1975 and 2007 laws governing the production and sale of fertilizers.
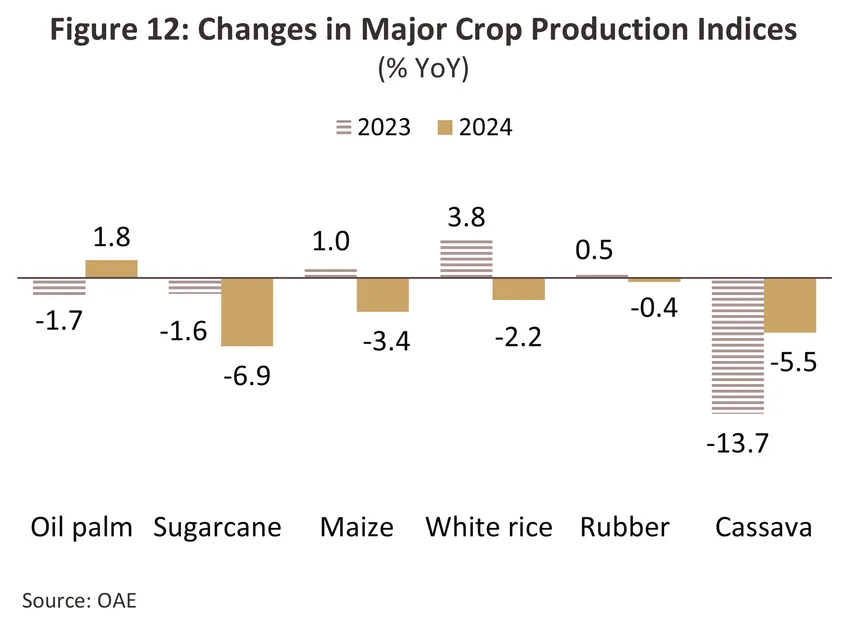
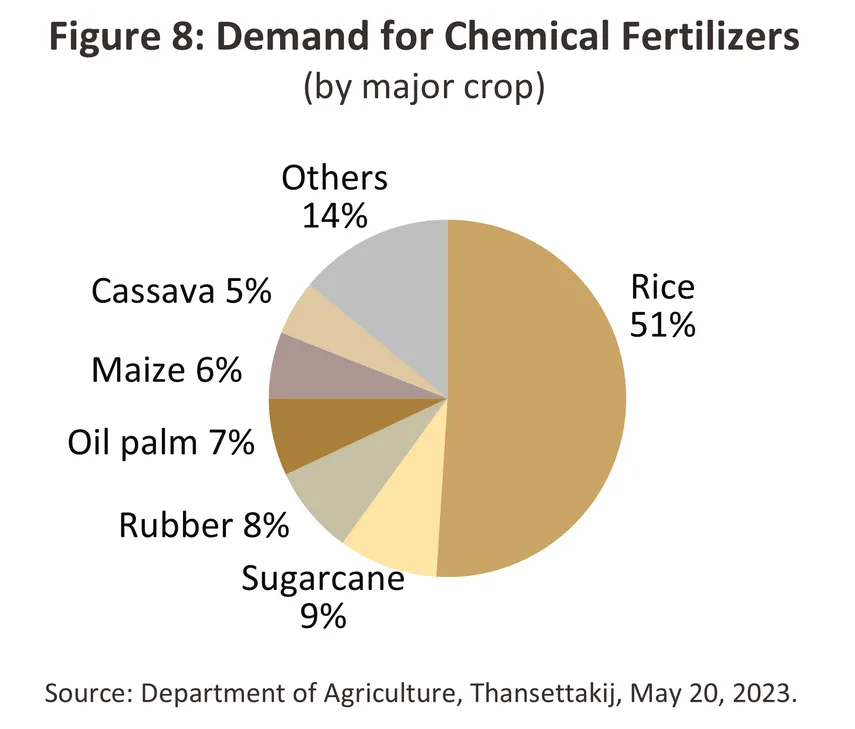
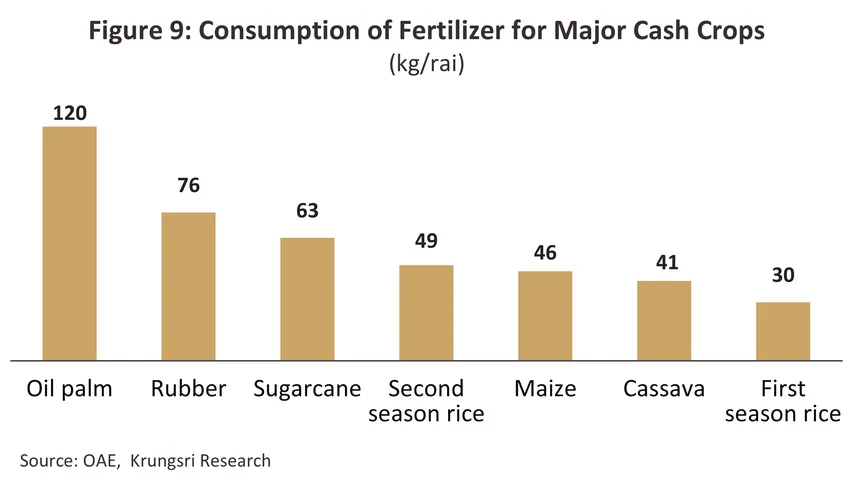
The economic crop that uses the highest amount of chemical fertilizers is rice (accounting for over 51% of total fertilizer consumption) as it has the largest cultivation area, while sugarcane, rubber, oil palm, and maize account for 6–9% of fertilizer use (Figure 8). However, in terms of the quantity applied per rai, oil palm and rubber show the highest use of chemical fertilizers because they require a higher amount of nutrients per area than rice. Following these highest -fertilizer-used crops, there are sugarcane, off-season rice, maize, cassava, and first season/rainy-season rice (Figure 9). The increase or decrease in the cultivated area of these major commercial crops therefore affects the demand for fertilizers in the same direction, and the expansion of crops with a high fertilizer application rate per rai consequently has a greater impact on fertilizer demand than the expansion of rice cultivation.
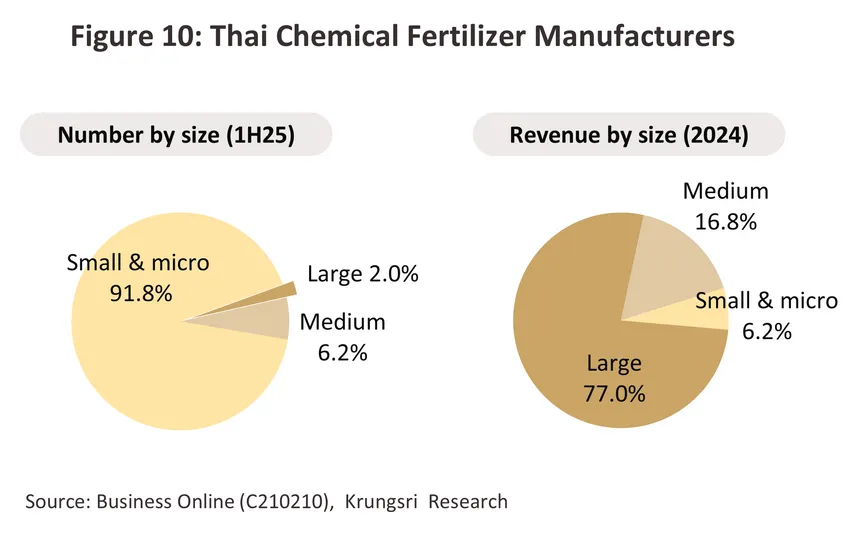
As of June 2025, there were 984 chemical fertilizer manufacturers registered with the Department of Business Development, representing an increase of 46.0% from the end of 2024. Of this total, approximately 98.0% were SMEs and micro producers, while large-scale producers accounted for only 2.0%, yet they collectively generated 77.0% of total industry revenue (Figure 10). This is because large producers benefit from lower production costs and continue to employ consistent marketing and promotional strategies, while medium and smaller producers face limitations in expanding production capacity due to inconsistent fertilizer quality.
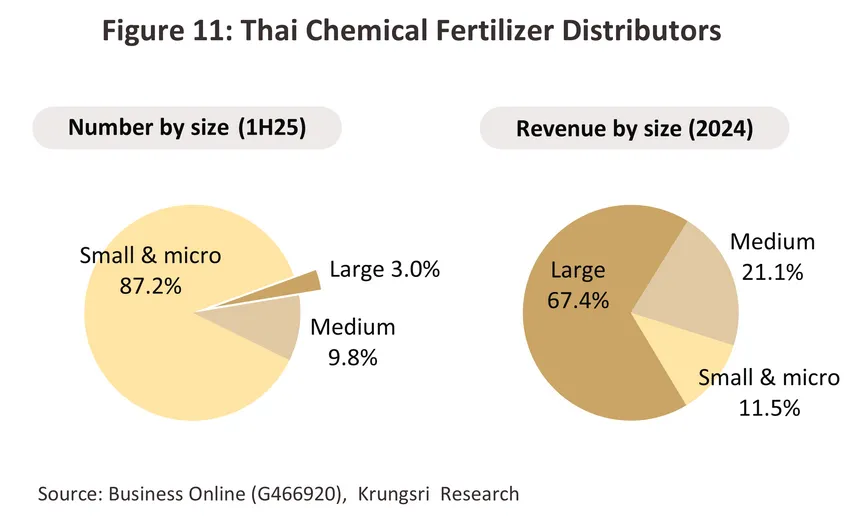
The number of fertilizer distributors — both wholesalers of chemical fertilizers and agricultural chemicals — has risen by 29.3% from the end of 2024 to 4,074 operators. Most (97.0%) are small- and medium-sized enterprises (SMEs) and micro distributors (Figure 11) located across various provinces. Because initial investment requirements are relatively low and operations are simple — buying from domestic manufacturers or importers and reselling — market entry and exit are easy. Some firms act as both wholesalers and retailers, and some re-export products to neighboring countries. Competition in this business is therefore intense. However, around 3.0% of large-scale operators enjoy competitive advantages due to: (i) lower costs from bulk purchasing and close relationships or alliances with fertilizer manufacturers, which give them greater bargaining power; (ii) strong connections with local farmers and influence over local buyers; and (iii) a diverse product range that meets farmers’ seasonal crop demands, enabling year-round sales.
Major manufacturers and distributors can be classified into the following two categories.
-
Multinational operators include Yara International (Norwegian), Haifa Group (Israeli) and COMPO Expert (German). These companies typically operate global distribution networks, take advantage of advanced manufacturing technologies, and have expertise in the production of fertilizers that are tailored to the needs of individual crops, such as foliar or water-soluble products.
-
Domestic players include Thai Central Chemical (manufacturers of the Hua Wua Khan Thai brands), Sak Siam Group (Ploy Kaset brand), Chia Tai Group (Kratai and Cho Fah), Terra Agro Fertilizer (Mongkut and Thip) and ICP Fertilizer (Ma Bin). Domestic manufacturers play an important role meeting demand from smaller agricultural operations, and these companies often also have expertise in tailoring fertilizer formulations to meet local soil conditions and specific crop requirements.
The majority of manufacturers are well capitalized, are skilled at expanding their markets, and are able to diversify their revenue base by developing new products. However, large and small companies typically take a different approach to dealing with competition, and while the former generally concentrate on innovation, sustainability and the expansion of their distribution networks, the latter focus instead on developing their relationships with agricultural communities and then providing localized services to these.
Situation
Over 2016-2023, domestic consumption of chemical fertilizer grew by 2.1% annually to an average of 4.6 million tonnes per year. This was split between straight and mixed or compound fertilizers. (i) The country used approximately 3.0 million tonnes of straight fertilizer (fertilizer that contains only one of nitrogen, phosphorus or potassium), of which the most important was nitrogen since access to this is the main determinate of growth rates, followed by potassium and phosphorus, with these accounting for respectively 51%, 15% and 0.2% of all fertilizer sales respectively. (ii) 1.6 million tonnes of mixed and compound fertilizers were consumed annually in this period.
Demand jumped 22.5% in 2024 to reach 5.5 million tonnes. Growth was driven by the following.
-
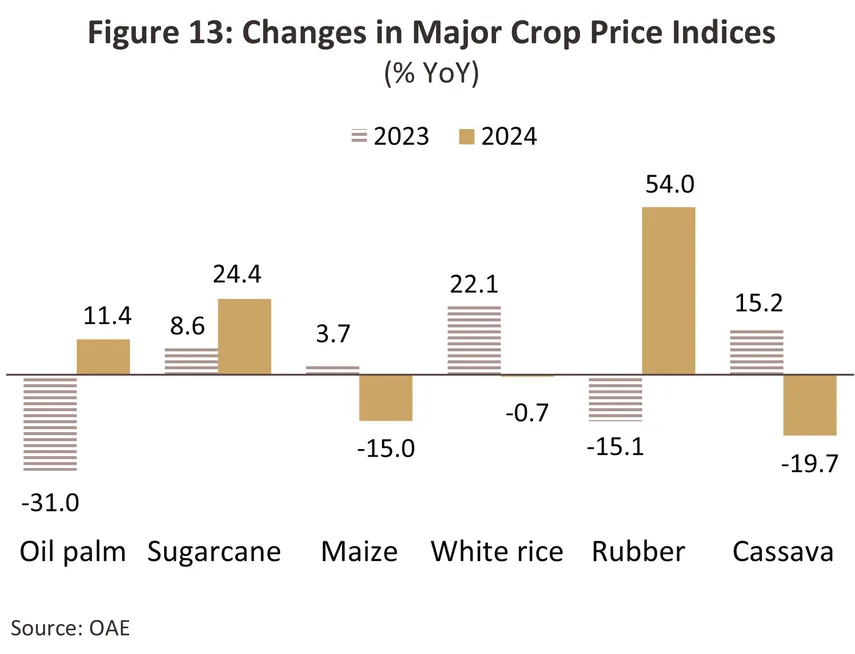
Prices for agricultural crops rose 12.7% from their 2023 level, and this helped to incentivize farmers to expand the area under cultivation. This was especially significant for major crops that benefit from heavy applications of fertilizer, including oil palm (+11.4%), sugarcane (+24.4%) and rubber (+54.0%) (Figure 13). Prices for fruits also rose, most notably for durian, mangosteen, and longan, and with demand strong, farmers applied more fertilizer as they tried to lift quality and yields.
-
Domestic fertilizer prices softened on a decline in the global cost of straight fertilizer. The latter was caused by a combination of an easing of supply chain bottlenecks and a drop off in prices for natural gas, which fell to an average of USD 2.2/MMBtu (down from USD 2.5/MMBtu in 2023), thereby pulling down ammonia production costs. Average prices for straight fertilizer thus dropped -9.9% to THB 12,409/tonne1/, although persistently high mixing and transportation costs pushed up prices for compound fertilizer, this thus rising 0.5% to an average of THB 19,072/tonne2/.
-
Assistance for farmers that came particularly in the form of the ‘Half Each’ program for fertilizer costs helped to cut overheads and improve access to this. Moreover, the government also allocated THB 60.3 billion to price support programs targeting rice and oil palm, and this contributed further to tailwinds lifting the agricultural sector.
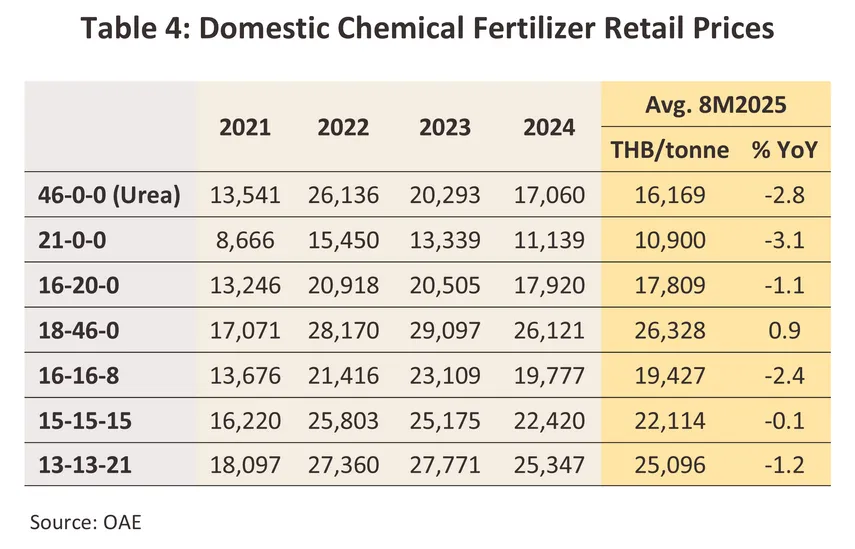
The net effect of these factors was to push down domestic prices, declines in which outpaced those of production costs. Thus, prices averaged THB 17,060/tonne for urea (46-0-0), THB 11,139/tonne for ammonium sulfate (21-0-0) and THB 26,121/tonne for di-ammonium phosphate (14-46-0). Relative to 2023, these prices were down by respectively -15.9%, -16.5% and -10.0%.
Nevertheless, the market still faced constraints and through 2024, demand growth was held back by the continuation of the El Niño at the start of the year. This extended drought conditions in some areas and so farmers responded by cutting back on plantings, which then showed up in the -2.2% decline in crop yields relative to a year earlier.
The situation with imports and exports is described below.
-
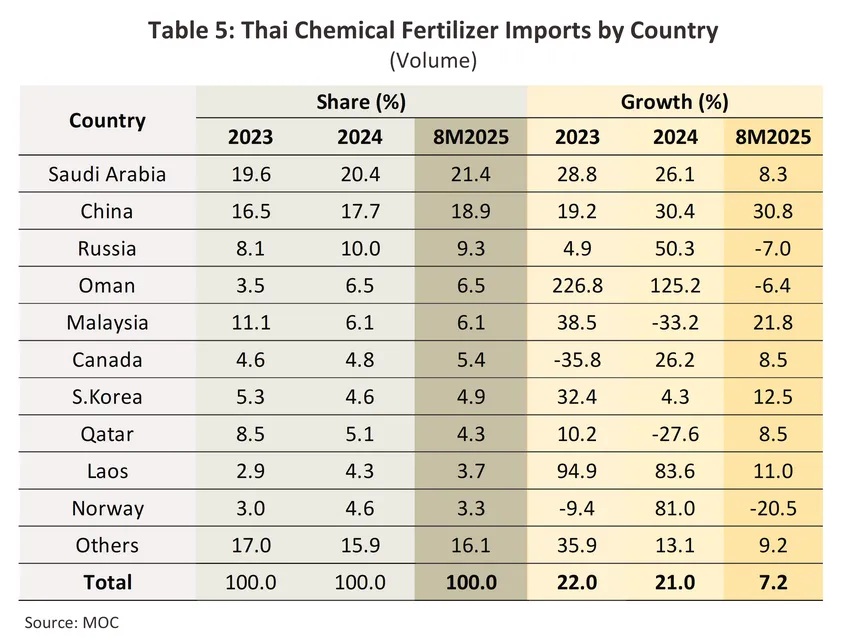
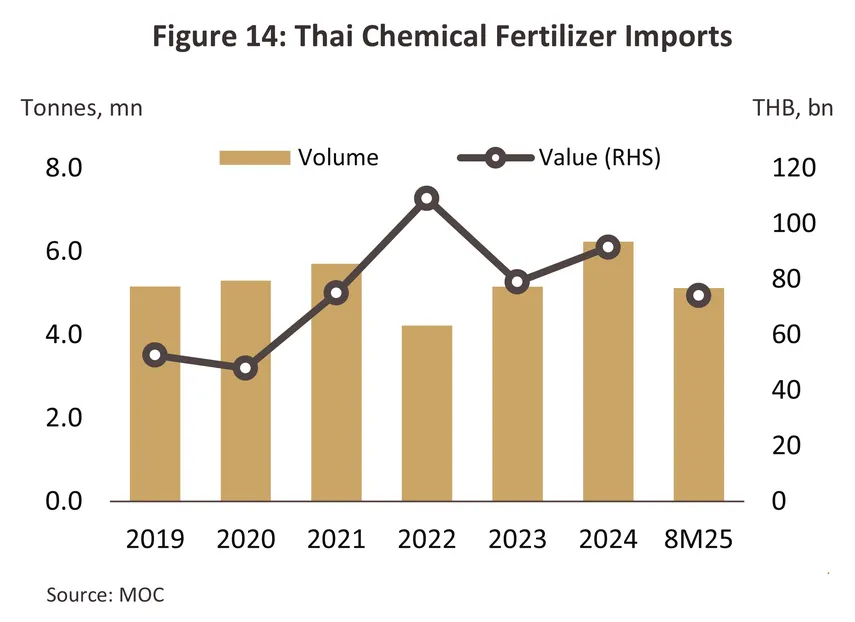
By volume and value, imports jumped by 21.0% and 15.9% to totals of respectively 6.2 million tonnes and THB 91 billion (Figure 14). These strong increases can partly be explained by lower prices for almost all imported goods. Saudi Arabia accounted for the largest single share of these imports (24.0% by volume), followed by China and Russia, though strong increases were seen in purchases from Oman, Lao PDR and Norway (Table 5).
-
Imports of straight fertilizer (65.8% of all imports by volume) totaled 4.1 million tonnes, a rise of 13.8%, though by value, these were up just 2.6% to THB 51 billion. Together, Saudi Arabia, Oman, Malaysia and Qatar accounted for 54.9% of imports. Sales into Thailand by these countries rose 4.7% by volume, but 2.2% by value (to THB 29 billion).
-
Imports of compound fertilizer (34.2% of the total) surged 37.8% by volume and 38.6% by value to 2.1 million tonnes and THB 40 billion. With a 29.9% market share, China was the country’s most important supplier, with exports to Thailand up 17.9% by volume and 25.4% by value (to THB 13 billion), though with Russia increasing its exports to Asia, its 28.8% market share put it in a close second position (this was a huge jump from 2021’s 0.9% share). In the year, exports from there jumped 60.5% by volume to 0.61 million tonnes and 52.3% by value.
-
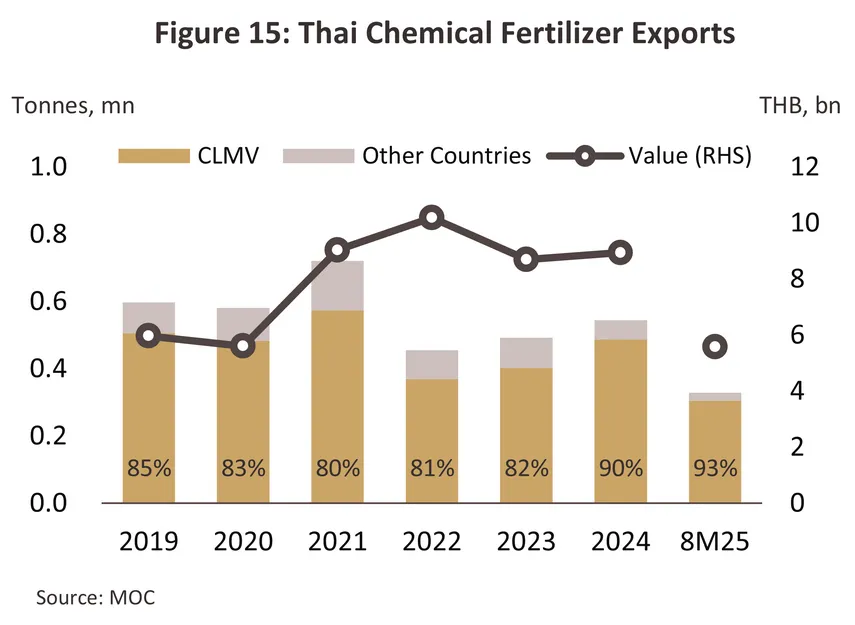
Export markets account for only some 5% of Thai output, but these still rose 10.5% by volume (to 0.54 million tonnes) and 2.9% by value (to THB 8.9 billion). 90% of these sales were to the CLMV nations, though these still rose 21.1% on the strength of these countries’ agricultural sectors (Figure 15) and the resulting increase in demand for high quality products imported from Thailand. However, looking at individual markets shows that growth was driven largely by the strength of sales into Cambodia (48.3% of export volume) and Lao PDR (27.7%), which climbed by respectively 36.8% and 25.0%. Regional markets thus continue to show high potential as a source of growth for Thai fertilizer manufacturers
Krungsri Research expects that across 2025, the industry will have developed in the following directions.
-
Favorable climatic conditions, in particular stronger rainfall from the end of 2024 through to the start of 2025, have supported an expansion in the area under cultivation in both irrigated and non-irrigated regions. This will then have encouraged farmers to step up fertilizer applications as they attempt to maintain or improve yields. Given this, over the first 8 months of the year, the MPI for the major crops rose 12.6% YoY, climbing 22.5% YoY for rice and 22.2% YoY for fruits, in detail up 167.6% YoY for lychees, 29.0% YoY for longans, and 27.8% YoY for mangosteen.
-
Ongoing government support for the agricultural sector has included the 2025 program to help farmers with the cost of fertilizer. This encompassed both straight fertilizer (nitrogen, ammonium sulfate, and potassium chloride) and 79 types of compound fertilizer, and in total this covered deliveries of more than 0.5 million tonnes of these between 10 April and 30 September. Over THB 40 billion of assistance has also been provided to farmers growing on- and off-season rice, helping to cut the cost of inputs and boost access to fertilizer further.
-
Domestic prices softened further in the year. Thus, over the first 8 months of 2025, prices for urea (46-0-0), the most widely used fertilizer, slipped -2.8% YoY to THB 16,169/tonne, with ammonium sulfate (21-0-0) also down -3.1% YoY to THB 10,900/tonne. This then naturally increased sales and boosted yields.
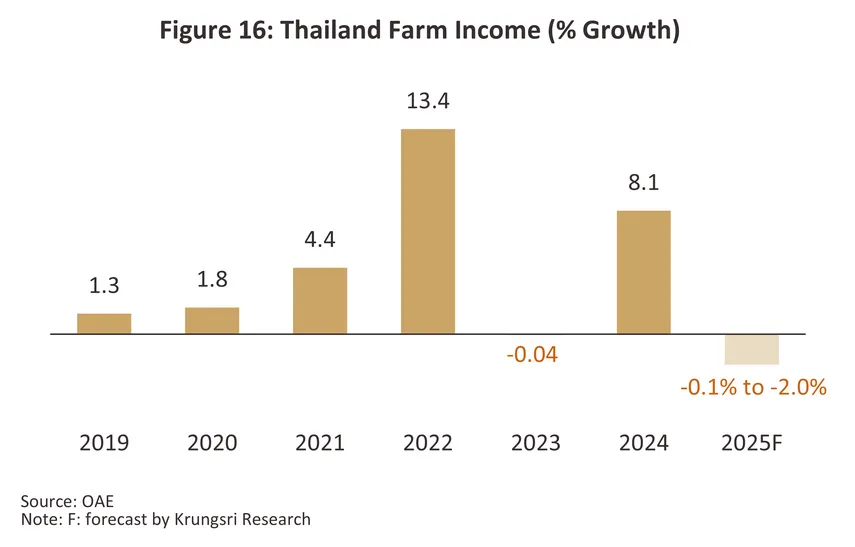
However, at the same time, these rising yields put downward pressure on farmgate prices and so the index of crop prices dropped -11.9% YoY, though oil seeds and coffee bucked the trend to climb by respectively 20.0% and 50.8% YoY. As such, farm incomes fell for almost all groups. These conditions combined with ongoing problems with labor shortages to erode agricultural purchasing power and reduce demand for fertilizer, which was then reserved for use only where necessary. Stocks held for the next planting season were also cut.
-
Over 8M25, imports rose 7.2% YoY to 5.1 million tonnes, though by value, these edged up at the slightly slower rate of 5.9% YoY to reach THB 74 billion. This was split between the following.
-
Imports of straight fertilizer (70.0% of the market) rose 11.7% YoY to 3.6 million tonnes, with the cost of imports also up 11.5% YoY to THB 45 billion. Import growth was driven by a combination of stronger demand for use with major commercial crops (e.g., rice, sugarcane and rubber) and a change in policy by manufacturers, which have shifted to importing straight fertilizer (for which prices are lower than for compound fertilizer) and then using this to make the different products required by the local market. An easing of restrictions on exports helped to boost imports from China, which then jumped 62.4% YoY by volume and 68.4% YoY by value to account for 15.5% of all imports of straight fertilizer. Imports from Saudi Arabia (27.4%) were also up 6.6% YoY and 14.6% YoY by volume and value.
-
Imports of compound fertilizer (30.0% of the total) fell -2.0% and -1.8% YoY by volume and value to totals of respectively 1.5 million tonnes and THB 29 billion. These declines were due to the strength of inventories over the last few years and worsening uncertainties over the global trading environment that have then encouraged importers to exercise greater care when managing stocks and to more closely match these to market demand. The structure of the market has also changed, with imports from Russia (29.9% of imports of compound fertilizer) sliding -8.4% YoY but those from China (26.9%), South Korea (15.8%) and Saudia Arabia (7.5%) rising by respectively 3.8%, 9.3% and 26.1% YoY.
Through the remainder of the year, imports will likely continue to strengthen as players move to meet demand. Moreover, consumption is typically stronger during this period since applications help to build leaf and fruit structure and to maximize yields in the following year. Rising global prices will also encourage players to offset the risk of increased overheads by building stocks through this period, and so overall, Krungsri Research expects that for all of 2025, imports will total 6.5 million tonnes, an increase of 5.5%.
-
Exports softened through the first 8 months of the year, dropping to 0.33 million tonnes (-8.1% YoY) that then brought in receipts worth THB 5.6 billion (-6.3% YoY). By volume, 92.8% of exports were to the CLMV nations, though overall these were down -2.9% YoY. Sales to Cambodia (34.3% of the total) crashed -28.3% YoY, but this was balanced by an improving outlook in Lao PDR (41.4% of exports), where support for the agricultural sector boosted exports from Thailand by 20.0% YoY, and in Myanmar (16.7%) and Vietnam (0.4%), where exports were up by respectively 30.4% and 6.9% YoY. In the latter case, this was due to further development of the irrigation system and official encouragement by the government to farmers to expand the total area under cultivation. More generally, export prices remained almost unchanged from a year earlier (+0.06% YoY), adding further to demand. However, for all of 2025, exports are expected to total 0.50-0.51 million tonnes, which would represent a fall of between -5.5% and -7.0% from a year earlier.
Outlook
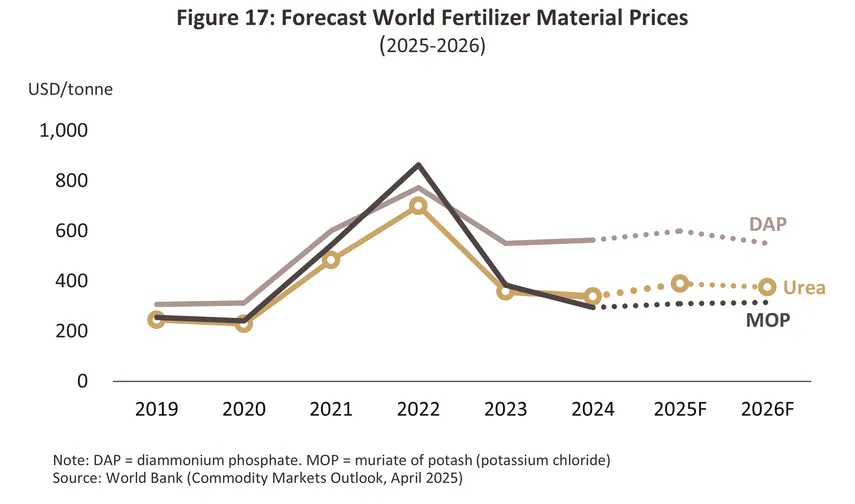
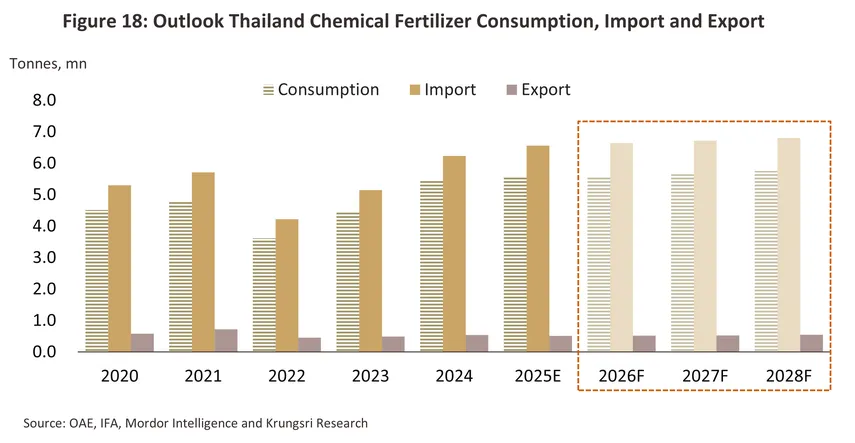
2026 conditions will remain broadly unchanged from a year earlier, although domestic prices will tend to soften somewhat in line with an expected fall in global prices for urea and diammonium phosphate; the World Bank sees these sliding from 2025’s average of USD 390/tonne and USD 600/tonne to respectively USD 375/tonne and USD 550/tonne. Prices for potassium chloride are, however, forecast to do better, inching up from USD 310/tonne to USD 315/tonne (Figure 17). Nevertheless, the poor performance of the Thai economy will drag on purchasing power, while there is also a risk that El Niño conditions may return in April and May 2026. If this occurs, the season rains will be interrupted and total precipitation will decline. With drought conditions likely to follow3/, demand for fertilizer will subside. The outlook will improve again over 2027 and 2028, and so total consumption of fertilizer is expected to reach 5.65-5.75 million tonnes. This would then translate into average annual growth of 1.0-1.5% (Figure 18), somewhat lower than the 2.1% averaged over 2016-2021. Factors supporting this outlook include the following:
-
Domestic purchasing power will strengthen gradually on growth in the Thai economy, which the IMF sees expanding by 1.8% in 2027 and 2.1% in 2028. Alongside this, Krungsri Research predicts that the tourism industry will gradually recover. With 39 million foreign arrivals expected in 2028, demand for food crops from industries in adjacent parts of the economy (most obviously restaurants) will rise. The steadily growing popularity of online shopping for food products (including processed fruit and vegetables) will combine with the continuing spread of modern trade outlets (e.g., supermarkets and discount stores) to lift demand further.
-
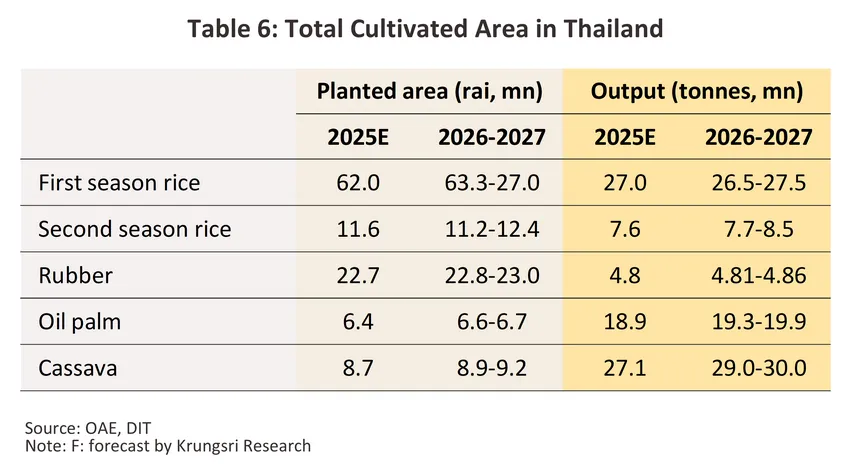
Demand for food and energy crops will trend upwards, as climate change increasingly impacts weather systems during the growing season, particularly in terms of the escalating risk of drought and the resulting drop off in yields. Ongoing conflicts in some parts of the world is also pushing up food costs, and this may periodically trigger additional food crises. Overall pressure on demand is therefore expected to rise, and in light of this, the World Bank forecasts a 3-5% annual increase in global food price indices over 2025-2027. Green growth and especially stronger demand for plant-based eco-fuels made from, for example, oil palm, cassava and sugarcane, will add to these trends, which taken together will act as a strong incentive to farmers to expand the total area under cultivation and to increase yields by stepping up fertilizer dressings (Table 6), especially of straight fertilizer. Going forward, Thailand will thus see new export opportunities open up, though these trends will particularly affect overseas sales of processed and tinned fruit, rice, energy crops (e.g., cassava) and fresh, chilled, frozen and dried fruits.
-
Government policy is helping to add to the demand for fertilizer. This includes incentives to farmers to expand the cultivation of some cash crops, for example potatoes, seed and table varieties of which are imported in significant quantities, support for fruit-processing programs that add value to agricultural output, and the promotion of plant-based foods (e.g., alternative sources of protein), part of the decade-old ‘Thai Kitchen to the World’ export promotion scheme.
-
Exporters can look forward to an improving outlook, especially for sales into the CLMV region. In detail: Lao PDR is implementing its ‘National Green Growth Strategy’, which is shifting the agricultural sector from a focus on increasing total output to a greater concern with eco-friendly development; Cambodia’s ‘Pentagon Strategy Phase I (2023-2028)’ and ‘National Agricultural Development Policy (2022-2030)’ have established a target of lifting rice exports to 1 million tonnes annually; and in Vietnam, the agricultural modernization program is encouraging the use of high-quality fertilizer. At the same time, China, which is a major supplier to the region, is cutting back on exports of some products, and this is then opening up market space within the CLMV region, which Thai producers can now step into. However, developing and sustaining a market presence over the long term will require further action, including strengthening distribution networks, setting up demonstration and education centers, and offering soil testing services.
Nonetheless, negative factors will work against these trends and will tend to restrain growth in demand. These will include the following.
-
Climate change conditions is worsening, and extreme weather events are increasing in both frequency and extent. As such, rainfall is at times declining and drought conditions are expanding in scope (especially in areas that are not irrigated), while at other times, floods are worsening, and agricultural areas are being inundated. In either case, demand for fertilizer is reduced.
-
Global fertilizer prices will likely remain above their pre-pandemic level as a result of increased worries over food security, which have pushed countries to expand the total farmed area, and moves by some countries to restrict exports and thus ensure that their domestic fertilizer market remains stable. One major example of the latter is China, which has tightened controls on overseas sales of urea and of monoammonium and diammonium phosphate, and as a result, the supply of these to world markets has fallen. In response and to avoid exposure to the risk of price volatility and possible shortages, Thai importers have begun to source supplies from a wider range of countries, including Turkey (nitrogen fertilizer), Brazil (potassium) and Canada (phosphate).
-
Integrated fertilizer use, or integrated organic farming, combines the advantages of both organic and chemical fertilizers while minimizing the downsides related to their use. This will often entail building soil structure and promoting microbial activity by adding organic material and organic fertilizers but then switching to the measured use of chemical fertilizer when this is most appropriate (e.g., when a plant is flowering or setting fruit, or when soil analysis highlights a potential deficiency). The advantage of this is that by only applying chemical fertilizers when these are most needed, yields can be maintained but costs can be cut by as much as 50-60% (the details will depend on the specifics of individual farms and crops). The government is also promoting organic farming, and through the Organic Agriculture Action Plan (2023–2027) it has set a target for expanding the total area of certified organic farmland (using the Codex Alimentarius (Codex) standards or the ASEAN Standard for Organic Agriculture (ASOA)). This has come in response to growing demand for organic products from domestic and international markets, especially in Europe and Japan, where strict standards are enforced, and rising concern among Thai consumers over personal health and food safety, and the goal is thus for Thailand to become the ASEAN leader in organic and sustainable food.
Beyond this, greater use of modern farming techniques, such as using automated drones and the application of precision agriculture when planting high-yielding exports, and deeper knowledge of issues relating to soil health will help to continue to raise yields while making better use of fertilizer and other inputs.
Fertilizer manufacturers are adapting to changing conditions in several ways.
-
Developing high-value-added products: These include customized fertilizers or bespoke goods that leverage the possibilities offered by soil testing and digital technologies, as well as products that are better adapted to the increasingly volatile climate. The latter include slow-release fertilizers4/, which are more resistant to leaching, and coated fertilizers5/, which have better uptake profiles and fewer environmental side-effects.
-
Improving fertilizer performance through technology: The National Nanotechnology Center and the National Science and Technology Development Agency have developed a chelated fertilizer that contains both amino acids and supporting nutrients, and using this can help to cut fertilizer applications by up to 50% while also raising yields by 20% (source: Modor Intelligence).
-
Making better use of digital technologies: Farmers can now use their smartphones to search for information and to buy products from online e-commerce platforms, and coupling the latter with customer relationship management systems allows suppliers to provide additional information and targeted recommendations to individual customers, cut distribution costs, and boost sales. AI can also now be used to predict changes in demand and to better manage stocks.
Going forward, the industry will need to navigate a range of challenges.
-
Supply constraints may emerge periodically. These may be caused by ongoing geopolitical stresses in the Middle East that then affect major producers of oil and gas (e.g., Iran), the extended Russian-Ukraine war, both of which are important suppliers of fertilizer to world markets, and the imposition of export controls, for example by China. This could then impact global supply chains and cause prices to spike.
-
Demand for bio- and organic fertilizers is trending upwards, especially when these are combined with chemical fertilizers since this can cut costs but still raise yields. The government is thus promoting greater use of organic products, and to help reduce imports, it has set a target of farmers using 30% bio and 70% chemical fertilizers by 2027. In response, manufacturers will therefore need to expand their product lines to cover a much more extensive range of goods, or alternatively partner with manufacturers of bio-fertilizers to offer their customers a comprehensive range of solutions. More broadly, rising global concerns with personal health and with the environment are driving greater consumer interest in organic farming, and this will boost demand for non-chemical fertilizers further.
Shifting to an economic model based on the circular economy will make the industry much more sustainable, though this will necessitate: (i) investing in energy-saving green technology that reduces carbon emissions (e.g., SCG Chemicals’ ‘waste-to-fertilizer’ project, which converts organic waste collected by communities into high-value compost, simultaneously addressing problems with waste and generating added value for local people); (ii) building strategic partnerships to offer localized solutions, thereby generating an important market differentiator; and (iii) maintaining competitiveness in overseas markets by preparing for the introduction of more stringent international environmental regulations. Players that move swiftly to adapt to these changes and that thus preserve and extend their competitiveness should be able to look forward to long-term, sustainable growth.
1/The value of imports divided by their volume (HS 3102, 3103, and 3104).
2/The value of imports divided by their volume (HS 3105).
3/El Niño conditions may return in the summer of 2026, and so the country needs to prepare for the possibility of hotter, drier conditions.
4/Slow-release fertilizers (SRFs) release nutrients into the soil at a slower pace than do regular fertilizers, although a wide range of factors (e.g., soil humidity and microbial action) can affect the rates that are seen in practice, and so only a limited degree of control can be exercised over this (source: Thai Science and Technology Journal)
5/Coated fertilizers have a resistant outer covering that is used to slow the speed at which they dissolve. Nutrients are therefore distributed through the soil more gradually, and this helps to prevent leaching and ensure that plants receive nutrients at a steady and more appropriate rate.


.webp.aspx)