-
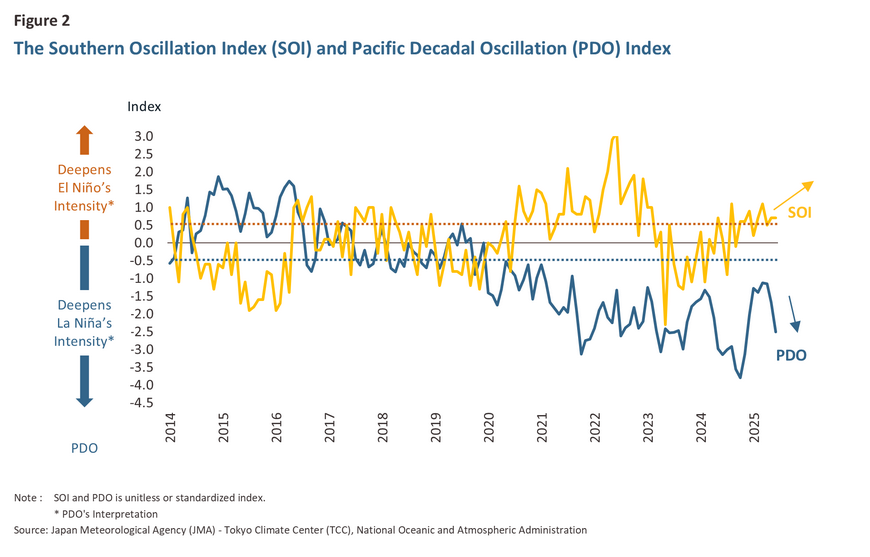
Local Monsoon: The Summer Asian Monsoon OLR Index (SAMOI7/) measures the influence of the southwest monsoon, which brings moisture from the Indian Ocean to Thailand from May to October. A positive SAMOI indicates a stronger southwest monsoon. In June 2025, the SAMOI value was 1.2, suggesting the monsoon will be stronger. This will bring more moisture and a higher chance of above-average rainfall to Thailand's western and Andaman Sea coasts.
-
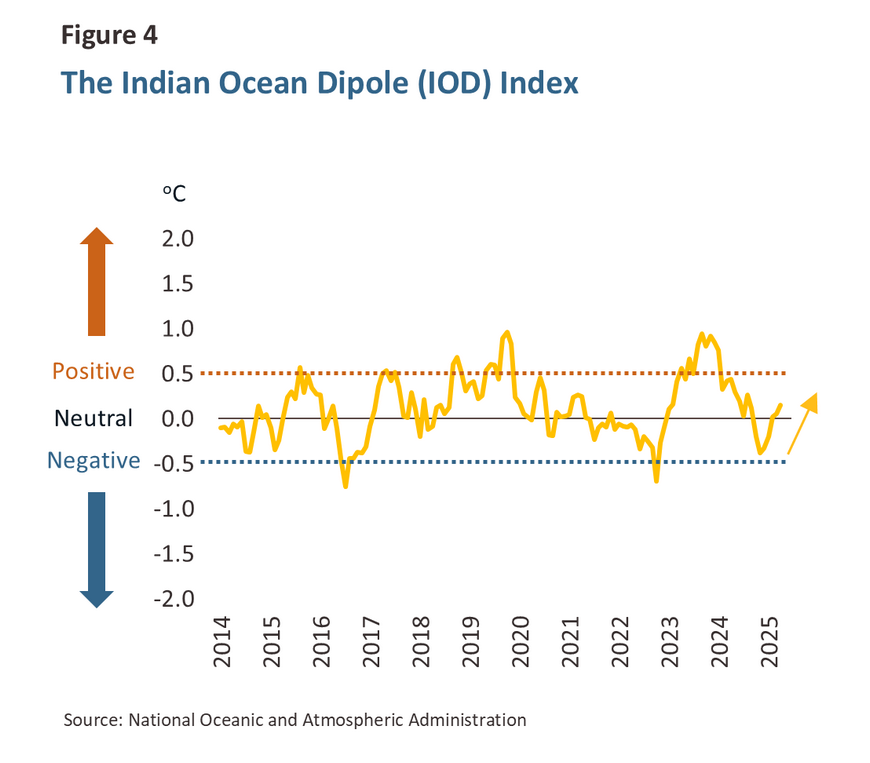
Factors influencing cloud and moisture formation: The southwest monsoon is a seasonal wind and rainfall system that originates in the Indian Ocean. Anomalies in the intensity of the Summer Asian Monsoon are influenced by differences in sea surface temperatures within the Indian Ocean, which are measured by the Indian Ocean Dipole (IOD) index8/. A consistently positive IOD value (greater than +0.5°C) causes sea surface temperatures in the western Indian Ocean (near Africa) to be warmer than usual. This shifts rain clouds westward, leading to heavier-than-normal rainfall in that region during the monsoon season. However, in April 2025, the IOD index was at +0.15°C (Figure 4), which is within the neutral range (-0.5 to +0.5°C), or a Neutral IOD state. Therefore, this year's monsoon from the Indian Ocean will result in normal seasonal weather for Thailand, particularly along the Andaman coast, without a strong influence from rain clouds or moisture from the Indian Ocean that would cause a severe, abnormal increase or decrease in rainfall.
Based on the oceanic and atmospheric indices, Krungsri Research assesses that in 2025, Thailand is likely to face above-average rainfall and stronger winds. This is a result of the expected transition into an intensifying La Niña phase (supported by the negative PDO value) and a slightly stronger southwest monsoon (due to the positive SAMOI value), despite the IOD remaining in a neutral state.
The entire Southeast Asian region is also at risk of increased rainfall and flooding. The potential severity of floods in Thailand requires further analysis of these additional weather and environmental factors:
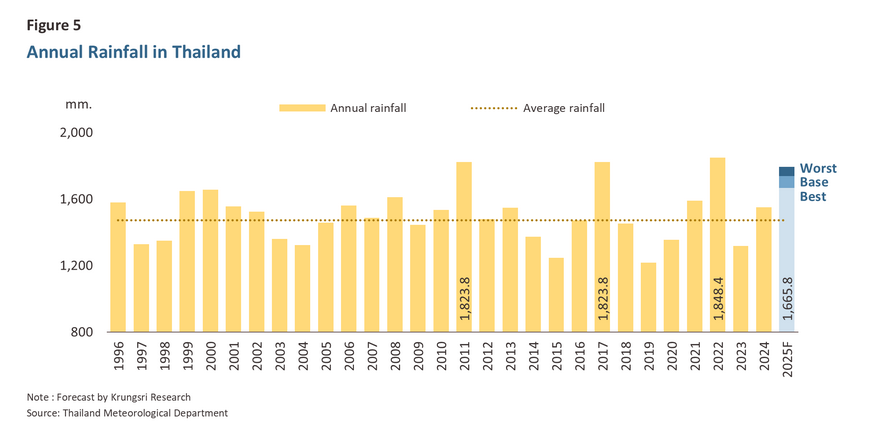
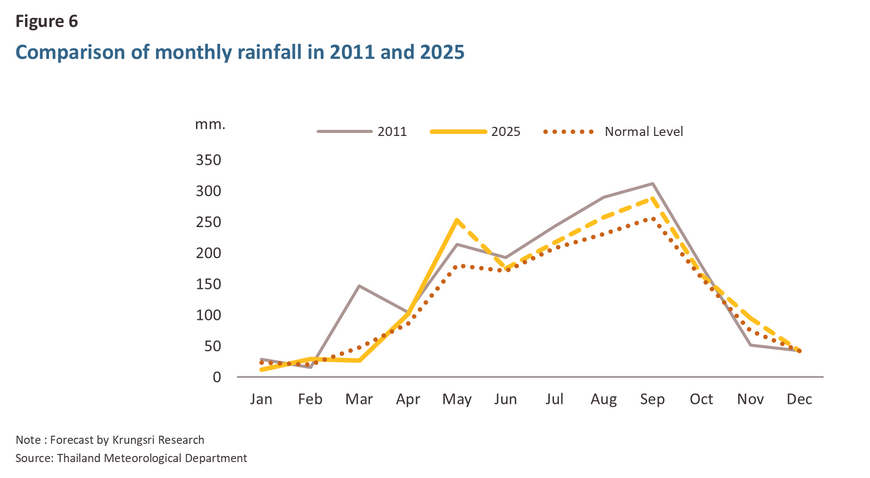
1) Rainfall in the second half of 2025 (August-December) is expected to be approximately 13.0-22.0% above normal levels9/. The ONI value for the first six months of the year, though in a neutral state, was below 0, which resulted in rainfall10/ 14.3% above average. Considering the ONI and other indices for the remainder of 2025, Thailand has a higher chance of facing flash floods in many areas. The projected total annual rainfall under the three scenarios is expected to be 1,666-1,794 millimeters, or 13.0-22.0% above the 30-year average11/ (Figure 5), but still lower than the great flood of 2011, which saw accumulated rainfall of 1,824 millimeters, or 23.9% above normal (Figure 6).
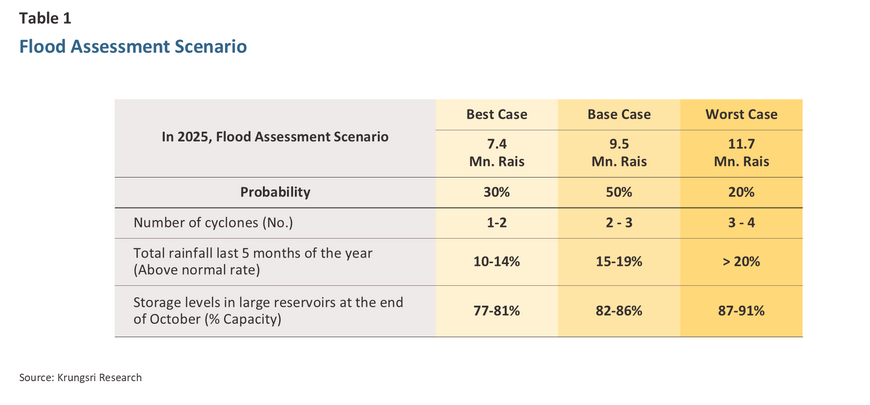
2) Frequency of Storms, based on 74 years of historical data12/ , an average of 2-3 tropical cyclones (tropical depressions, tropical storms, and typhoons) directly enter Thailand each year. Over the last 10 years, this average has dropped to 1-2 storms (Figure 7). Krungsri Research forecasts that Thailand will face a total of 2-3 tropical cyclones in 2025, which is fewer than the 5 storms that hit Thailand during the great flood of 2011. Tropical cyclones can occur from May to December, and sometimes continue into January of the following year. The highest probability for storms to form and enter Thailand is during the late rainy season (September-October), which could lead to heavy rainfall, flash floods, and overflowing rivers, especially in the East, Northeast, North, and Upper Central regions (Figure 8).
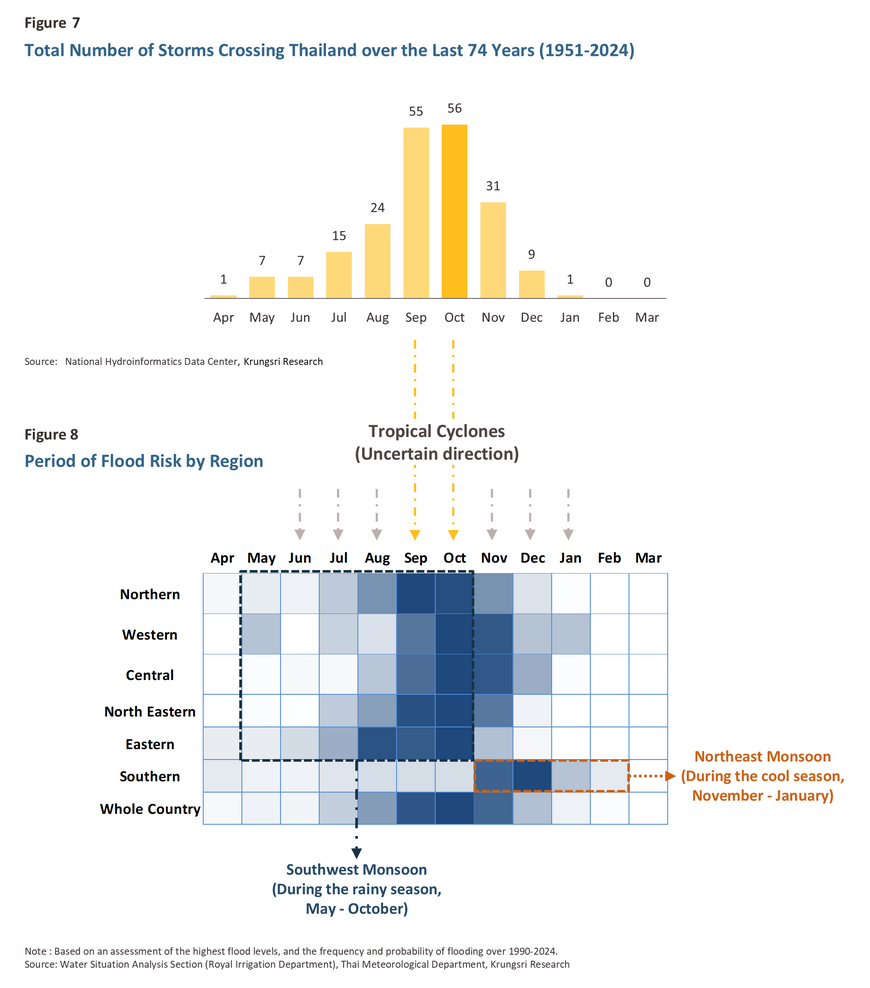
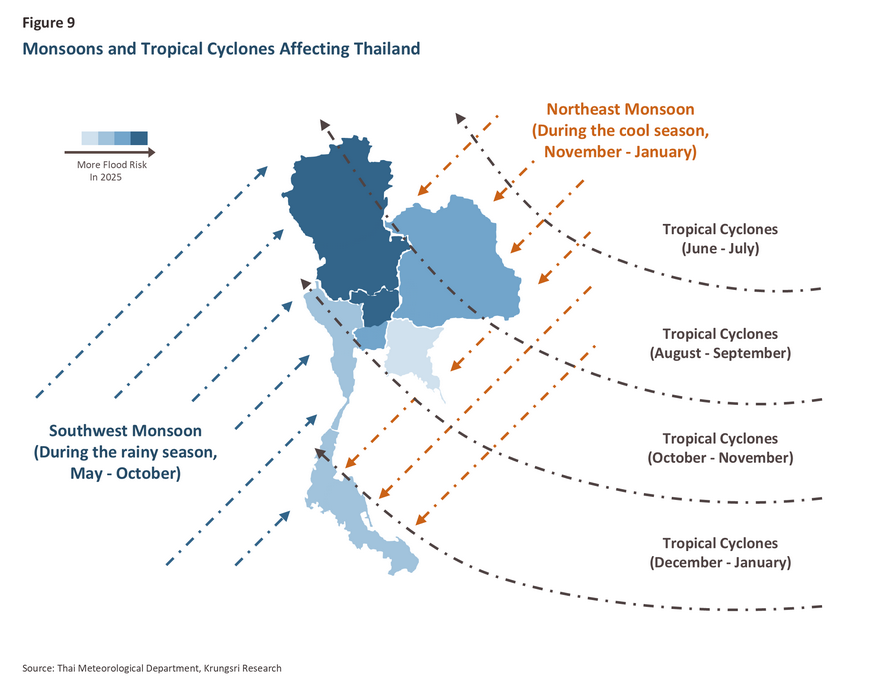
3) Local Monsoons, Thailand is affected by two local monsoons each year: (1) The Southwest Monsoon originates in the Indian Ocean and moves toward the Asian continent, covering Thailand from mid-May to mid-October (Figure 9). This coincides with Thailand's rainy season and is the primary cause of rainfall across all regions. The western and Andaman coast regions are most affected due to high mountains acting as a barrier, followed by the North, Central, Northeast, and Eastern regions. (2) The Northeast Monsoon is a cold air mass originating from China, which covers Thailand from mid-October to mid-February (Figure 9). This coincides with Thailand's cold season and is the main cause of cold weather in the North, Northeast, and Central regions. When it passes over the Gulf of Thailand, it brings moisture and heavy rainfall to the southern Gulf coast.
After analyzing the effects of local monsoons in conjunction with the oceanic and atmospheric indices, Krungsri Research projects that in 2025, the southwest monsoon will be "slightly stronger than normal" in terms of its speed or wind force, based on the slightly positive SAMOI index. However, because the IOD is in a neutral state, the amount of moisture and the formation of rain clouds affecting Thailand will remain "seasonally normal." This means rainfall will not increase significantly beyond average. Conversely, the northeast monsoon is expected to be more intense than normal, in both wind strength and rain cloud formation, as reflected by supporting indices such as ONI, SOI, and PDO, as previously mentioned.
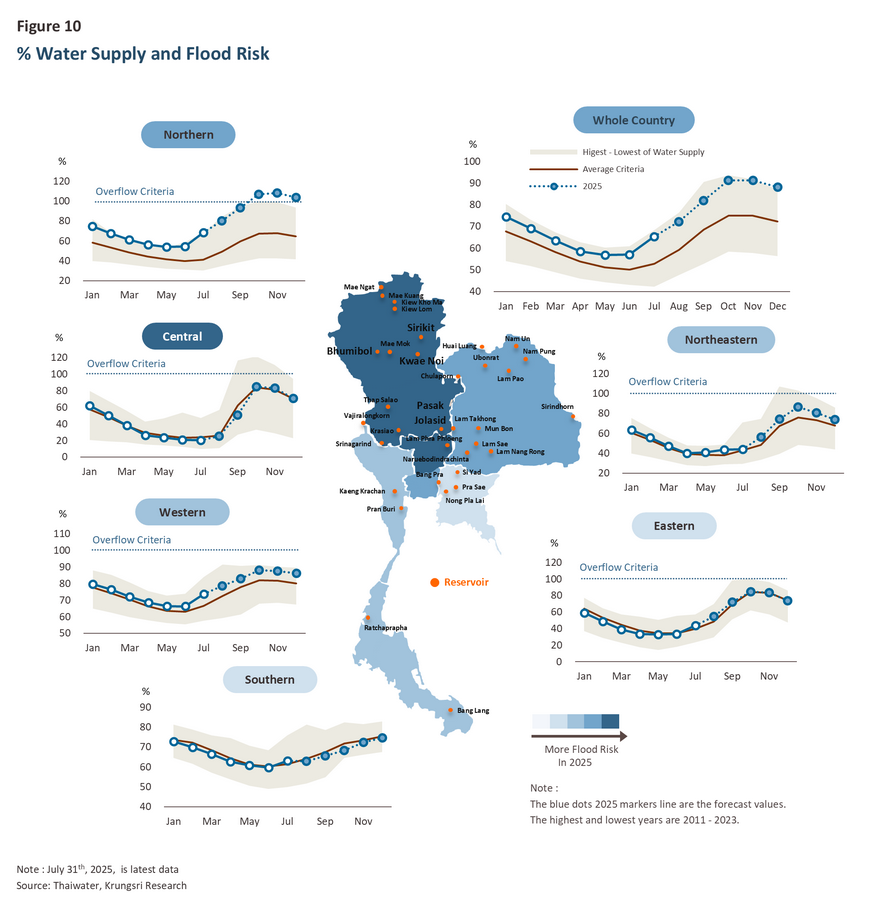
4) Water levels in large dams and medium-sized reservoirs are above average. At the end of June 2025, the total water volume in large dams was 40,522 million cubic meters, which is 57.1% of their total capacity. Although this is higher than the 7-year historical average13/, it is still lower than the 2011 great flood year, when the volume was 40,747 million cubic meters (58.4% of capacity) (Figure 9). Similarly, medium-sized reservoirs held 2,656 million cubic meters, or 52.1% of their capacity, which is also higher than the 3-year historical average14/.
Krungsri Research assesses that these factors will likely result in above-normal rainfall during the second half of 2025. This is due to the influence of the southwest monsoon, which will bring seasonal rainfall to all regions, combined with an expected increase in tropical cyclones. The storm "Wipha" in July 2025 was the first tropical cyclone to enter Thailand this year, with more expected from August to October. Additionally, the stronger-than-expected northeast monsoon will primarily affect the southern Gulf coast during the fourth quarter of 2025, leading to a higher-than-normal amount of rainfall in the second half of the year.
Considering water levels in dams, some regions have levels above average and close to recent highs15/ . This reflects a higher chance of flooding. The North, Northeast, Upper Central regions (in Q3), and the southern Gulf coast (in Q4) are classified as high-risk flood areas. The Lower North, a major waterway, and the Central region, a flood-prone area that receives water, are particularly vulnerable. A flood event would cause damage across agricultural areas, buildings, households, consumer goods, transportation routes, and public utilities.
2025 Recent Flood Situation
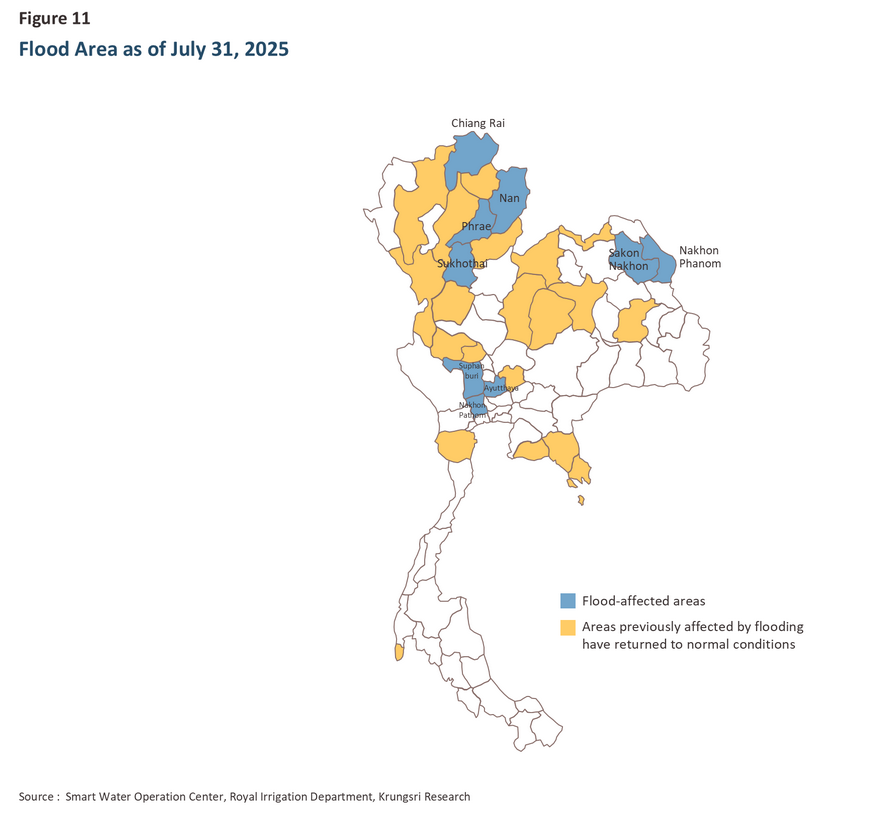
From January to July 2025, Thailand was affected by monsoons and monsoon troughs moving across the country, along with low-pressure cells from neighboring countries. This led to flooding in certain areas, particularly in the North, Upper Northeast, East, and Central regions16/. From the beginning of the year to July 31, 202517/, a total of 29 provinces were affected by floods. As of July 31, 20 provinces had returned to normal conditions, while 9 provinces were still experiencing flooding18/ (Figure 11). Over the past 30 days (June 30-July 29, 2025)19/, a total of 0.9 million rai of land was affected, with 7,483 households impacted. The most severely damaged province was Chiang Rai, with 0.26 million rai affected, followed by Phayao (0.08 million rai), Sakon Nakhon (0.07 million rai), Nong Khai (0.07 million rai), and Sukhothai (0.07 million rai). Damaged agricultural areas included 0.33 million rai of rice fields, followed by field crops and vegetables (46,274 rai), and fruit trees, perennial plants, and others (13,738 rai).
Upcoming Flood Risks for the Remainder of 2025
Thailand is expected to face a continuous increase in flood risks for the rest of 2025, with a particularly high risk in September–October for all regions except the South. This is due to the Meteorological Department's forecast of above-normal rainfall20/. In the South, flood risks will increase in November–December due to the annual influence of monsoons, monsoon troughs, and tropical cyclones. Considering other contributing factors for the rainy season, such as weather conditions and environmental signals, Krungsri Research has forecasted the risks and vulnerable areas under the following assumptions:
-
Number of Storms Entering Thailand: It is expected that at least 2-3 storms will enter Thailand, bringing more rainfall than usual. This is because the Oceanic Niño Index (ONI), which indicates El Niño–La Niña conditions, is continuously declining and may enter a La Niña state in August–September 2025.
-
Rainfall Volume: The effect of La Niña will result in above-average rainfall for the final five months of this year. Higher rainfall will lead to more severe damage.
-
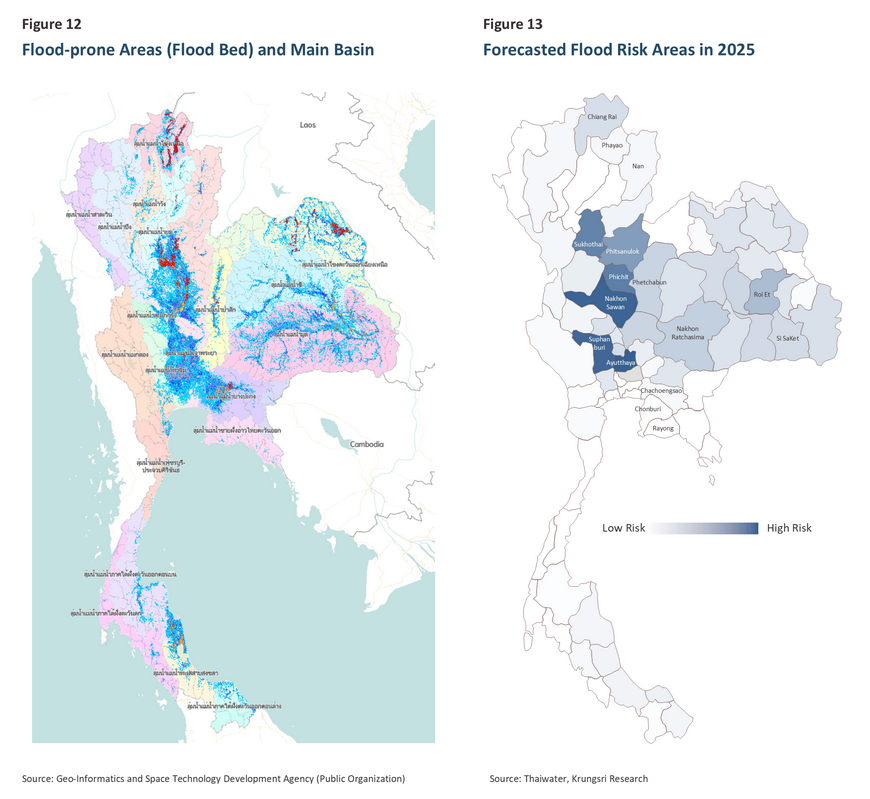
Area Affected: Even though large and medium-sized dams had over 35% of their storage capacity remaining at the end of July 2025, damage will increase significantly if rain falls in areas that dams cannot manage. The Central region is at high risk, especially if heavy rain occurs downstream of dams or outside the 13 low-lying floodplains of the Chao Phraya River basin, which are recurring flood zones or water retention areas21/ (Figure 12).
-
Water levels in the main waterways: River conditions depend on the volume of water flowing through the basin. If rainfall and the area of rainfall exceed the river's capacity, the river may overflow. In 2025, the main flood-risk areas are the Lower North, Central, and Northeast regions (Figures 12–13).
In addition, there are other uncontrollable or unpredictable factors that could increase flood risks in 2025, such as higher sea levels in the Gulf of Thailand or increased water volumes in natural sources, especially in the Mekong River basin. These factors would heighten the risk and potential damage from floods, as they would slow down the drainage process.
Krungsri Research View: Projected Economic Impact of Floods in 2025
Floods can cause various forms of damage to buildings, residences, factories, machinery, vehicles, transportation routes, and livestock. Economic crops are affected by the volume and strength of floodwaters. If water levels rise gradually and recede quickly, some crops may not be completely destroyed. However, strong currents and prolonged, high water levels will severely damage crops such as jasmine rice, sugarcane, and cassava, as well as various garden and field crops. This, in turn, impacts related industrial supply chains and can lead to higher prices for agricultural products due to supply shortages.
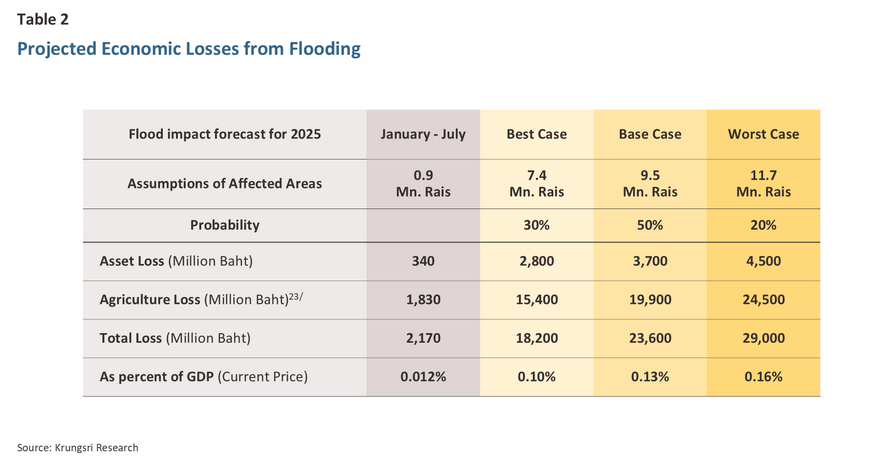
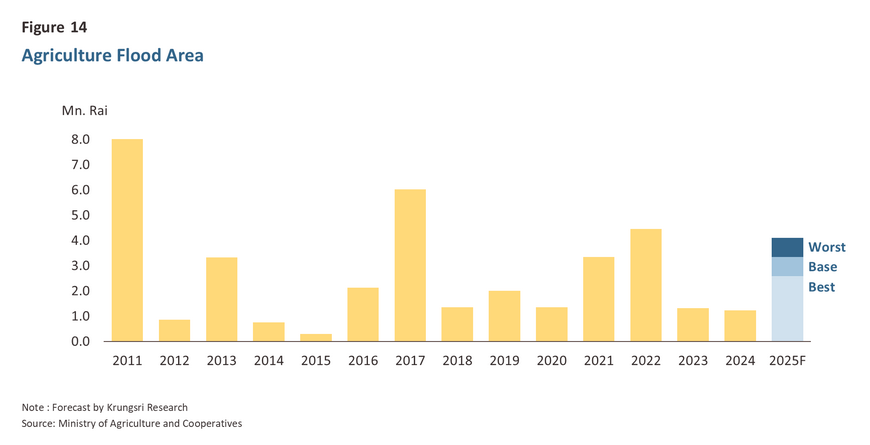
Krungsri Research has simulated three scenarios22/ to assess the total area that could be affected by floods in 2025 and evaluate the impact on economic activities (Table 2):
-
Best Case: In this scenario, which represents the least damage, 7.4 million rai of land would be affected, with asset and property damage amounting to THB 2.8 billion. Damage to agricultural output would be THB 15.4 billion, for a total of THB 18.2 billion in damages, or approximately -0.10% of GDP.
-
Base Case: This scenario projects 9.5 million rai of affected land, with asset and property damage of THB 3.7 billion and agricultural output damage of THB 19.9 billion. The total damage would be THB 23.6 billion, or approximately -0.13% of GDP.
-
Worst Case: In this scenario, 11.7 million rai of land would be affected. Asset and property damage would be THB 4.5 billion, and agricultural output damage would be THB 24.5 billion, for a total of THB 29.0 billion in damages, or approximately -0.16% of GDP.
The level of economic damage from a flood depends on 1) rainfall volume and water management, 2) the area where the flood occurs, and 3) the location of economic entities (residences, factories, agricultural areas). Therefore, if a flood happens in an area of high economic importance, such as an industrial estate, a key agricultural region, or a major transportation route, the resulting damage will propagate through the entire supply chain, from upstream to downstream, leading to a higher overall economic impact.
However, Krungsri Research expects that the floods in the second half of 2025 will not be as severe as the great flood of 2011. The economic impact is also not expected to be as significant as the 2011 event, which the World Bank estimated caused damage of up to THB 1.44 trillion24/. Although the amount of rainfall in 2025 may be similar, the country now has greater water retention capacity in both large and medium-sized dams. Additionally, improved water management readiness by the government (e.g., warning systems, maintenance, and funding) and enhanced flood prevention systems by the private sector, particularly in industrial estates, will help mitigate the impact more effectively.
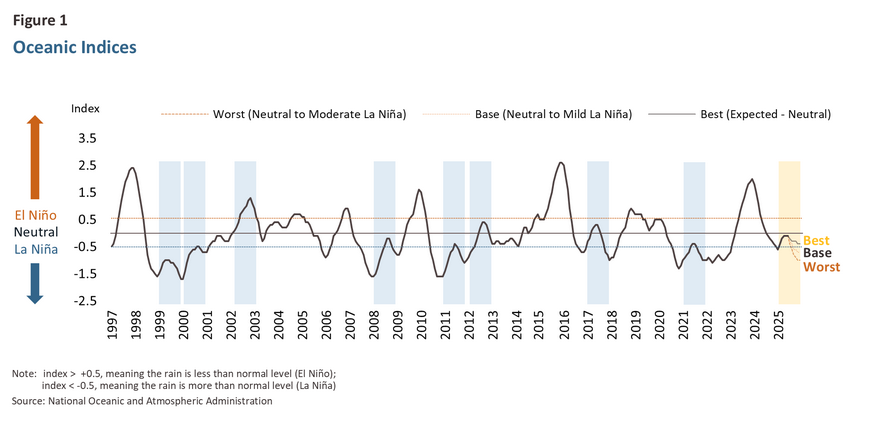
1/ The El Niño/Southern Oscillation (ENSO) is a major climate phenomenon that occurs in the tropical Pacific Ocean, involving an interconnected relationship between the ocean and the atmosphere. The status of ENSO is measured using the Oceanic Niño Index (ONI), which helps identify whether conditions are El Niño, La Niña, or Neutral. The ENSO cycle typically occurs every 2-7 years.
2/ The ONI is an oceanic indicator, representing a 3-month running mean of sea surface temperatures. For example, the MJJ value reflects the average for May, June, and July. Therefore, the latest ONI value for June 2025 would be the 3-month average for May, June, and July 2025.
3/ An ONI value between -0.5°C and 0.5°C indicates a Neutral state, meaning sea surface temperatures are trending back toward their average.
4/ The La Niña is a phenomenon witnessed when sea surface temperatures in parts of the Pacific fall below the average, which usually leads to changes in the distribution of atmospheric moisture and higher than normal rainfall in Southeast Asia. The intensity of these events is measured by the ONI Index, with values of -0.5°C to -0.9°C considered a weak La Niña. Values of -1.0°C to -1.4°C are classified as a moderate La Niña, between -1.5°C and -2.0°C is a strong La Niña, and anything over -2.0°C qualifies as a very strong La Niña. If the ONI is positive and above 0.5°C, this points to El Niño conditions, which are graded similarly to those for La Niña, though with positive rather than negative deviations from average temperatures.
5/ Historical data is available from 1950 to 2024 (75 years).
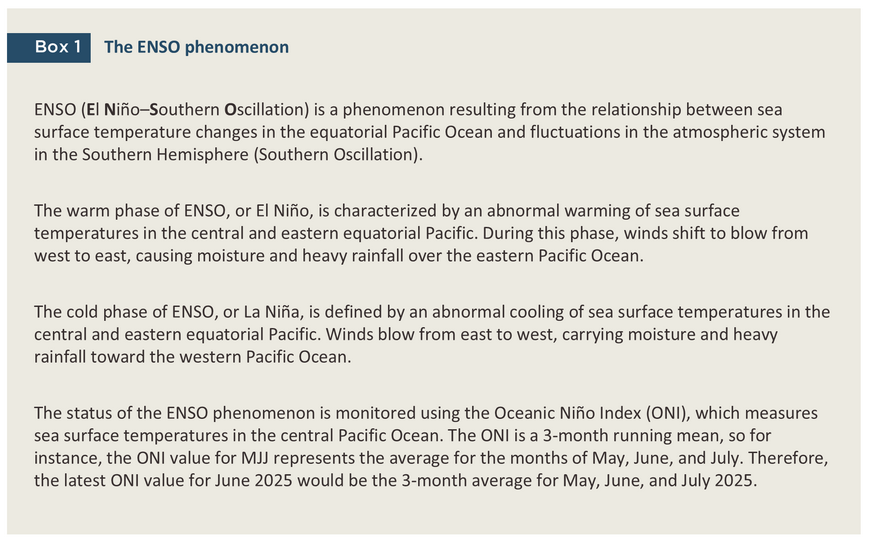
6/ The Pacific Decadal Oscillation (PDO) is a phenomenon of temperature differences between the eastern and western sides of the Pacific Ocean near 20°N. A negative PDO value (below -0.5) indicates that sea temperatures in the central and northwestern Pacific are warmer than normal, leading to warmer conditions in Asia, while the North American Pacific coast becomes cooler and wetter. A negative PDO promotes a higher frequency and intensity of La Niña events. The opposite is true when the index is positive. This phenomenon typically shifts between positive and negative phases every 20-30 years. In June 2025, the PDO index was a negative -2.5.
7/ The Summer Asian Monsoon Outgoing Longwave Radiation Index (SAMOI) is a system for measuring the overall strength of the summer monsoon across a large part of Asia, from South and Southeast Asia to East Asia, which is the wettest season for the region. A positive SAMOI value indicates a stronger-than-normal monsoon, which increases the likelihood of above-average rainfall in Thailand and may raise the risk of flooding. Conversely, the same principle applies if the index is negative. If the index is close to zero, the monsoon is considered to be of normal strength.
8/ The Indian Ocean Dipole (IOD), also known as the Dipole Mode Index (DMI), is the alternating movement of warm currents between the western and eastern sides of the Indian Ocean (within the regions 50°E-70°E, 10°S-10°N and 90°E-110°E, 10°S-0°N). A negative IOD value (below -0.5°C) means that warm currents accumulate in the eastern Indian Ocean. This causes rain clouds and heavy rainfall to shift eastward, resulting in above-normal rainfall in Thailand during the monsoon season, while the African coast on the other side of the Indian Ocean experiences drought. The opposite is true when the index is positive. An index value between -0.5°C and 0.5°C is considered a Neutral IOD state.
9/ Normal level refers to the average rainfall over a 30-year period (1991–2020).
10/ Average monthly rainfall for each province across the country is analyzed from data collected by the Thai Meteorological Department using the Inverse Distance Weighted (IDW) spatial averaging method.
11/ Average rainfall over the 30-year period is 1,472 millimeters.
12/ Available data covers the 74 years from 1951 to 2024.
13/ Available data covers the 15 years from 2011 to 2025. The average water volume in large reservoirs at the end of June each year is 50.6% of total reservoir capacity.
14/ Available data covers the 9 years from 2017 to 2025. The average water volume in medium-sized reservoirs at the end of June each year is 51.1% of total reservoir capacity.
15/ The highest monthly water levels in each dam from 2011–2024 are represented by the upper gray frame of the water level for each region in Figure 10.
16/ The National Agricultural Big Data Center (NABC) has estimated flood impacts in 28 affected provinces. Source: Report on the Agricultural Disaster Situation as of July 31, 2025, prepared by the Center for Disaster Monitoring and Relief for Agriculture, Ministry of Agriculture and Cooperatives.
17/ Source: Document on the Water Situation and Management for the 2025 Rainy Season as of July 30, 2025, prepared by the Office of Water Management and Hydrology, Royal Irrigation Department.
18/ Provinces still experiencing flooding include Chiang Rai, Sukhothai, Nan, Phrae, Suphan Buri, Nakhon Pathom, Ayutthaya, and Sakon Nakhon.
19/ The assessment of impact and damage is an approximation and has not been verified with on-site inspections. Source: Geo-Informatics and Space Technology Development Agency (Public Organization) (GISTDA).
20/ Source: Thailand's 3-Month Weather Forecast for August–October 2025, issued on July 29, 2025.
21/ Flood-prone areas from 2011–2020 (9 years) and water retention areas include Thung Chiang Rak, Thung Fang Sai Khlong Chai Nat-Pa Sak, Thung Tha Wung, Thung Bang Kum, Thung Pa Mok, Thung Phak Hai, Thung Chao Chet, Thung Bang Kung, Thung Bang Ban-Ban Phaen, Thung Pho Phraya, Thung Phraya Banlue, Thung Phra Phimon, and Thung Rangsit Tai.
22/ This is based on the assumption of currently affected areas, combined with the probability of floods for the rest of the year, using historical data from the National Hydroinformatics Data Center, the Office of Agricultural Economics, the Office of the National Economic and Social Development Council, the Geo-Informatics and Space Technology Development Agency, the Department of Disaster Prevention and Mitigation, the Royal Irrigation Department, the National Agricultural Big Data Center, and the Ministry of Agriculture and Cooperatives.
23/ Calculated by Krungsri Research. Data for affected areas as of August 1, 2025, assuming agricultural land damage is approximately 30-35% of the total flood-affected area. The value of the damage is calculated as: Damage Value = (Production losses = Total area of completely damaged agricultural land x Yield per rai) × Average agricultural product price for 2025.
24/ Source: 04 Thailand’s National Adaptation Plan, The Institute for Sustainable Development of Natural Resources and Environment (mnre.go.th).