Introduction
Thailand will move from El Niño to La Niña conditions over 2024, but although the country will continue to feel the effects of the El Niño through the first half of the year, the emergence of a monsoon trough in 2023 means that reservoirs are currently at close to their historical average. However, areas lying outside irrigation networks will be more heavily impacted by higher temperatures, heatwaves, accelerated rates of evaporation, delays to seasonal rains, and overall lower rainfall, and the resulting drought will then affect the environment, the agricultural sector, industries linked to this, and consumption. Krungsri Research expects that this will then cut outputs of crops that are more drought-sensitive, most notably off-season rice, sugarcane, and cassava, as well as other economically important crops such as corn, fruits, and some agroforestry goods, though this will impact downstream industries more than those that are upstream from the agricultural sector. This will then generate losses for the economy that in the base case are estimated to run to some THB 51.3 billion. There will then be a risk of flooding in some areas in the second half of the year, though the most important indicator of this will be indices such as the ONI, which will tend to move to neutral and then to La Niña conditions, and the PDO and IOD indices, which will trend into a negative phase (i.e., below -0.5). This will then increase the impact of tropical storms on Thailand, with these most likely to affect the lower north, the upper central, and the northeastern regions, especially those areas that have been subject to repeated flooding in the past. This may then cause damage and losses to households, factories, machinery, and agricultural outputs. In the base case, Krungsri Research sees 1.7 million rai potentially suffering from flooding at a cost of THB 260 million in damage to property and assets and a further THB 4.2 billion in agricultural losses. Combined losses from drought and flooding in 2024 are therefore expected to come to THB 55.8 billion, shaving -0.31% from GDP and adding 0.32-0.35% to headline inflation.
Indications of a transition from El Niño to La Niña conditions
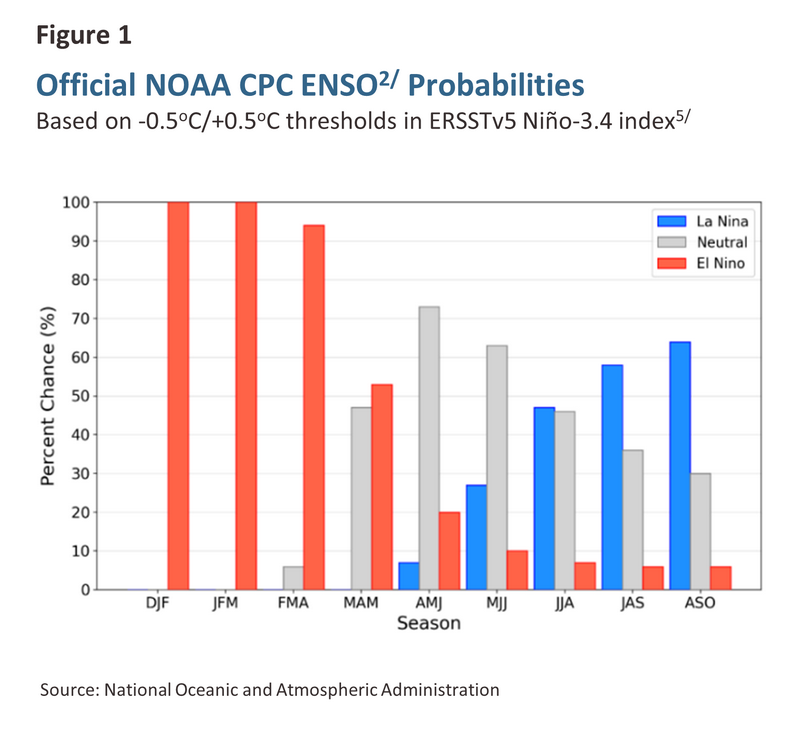
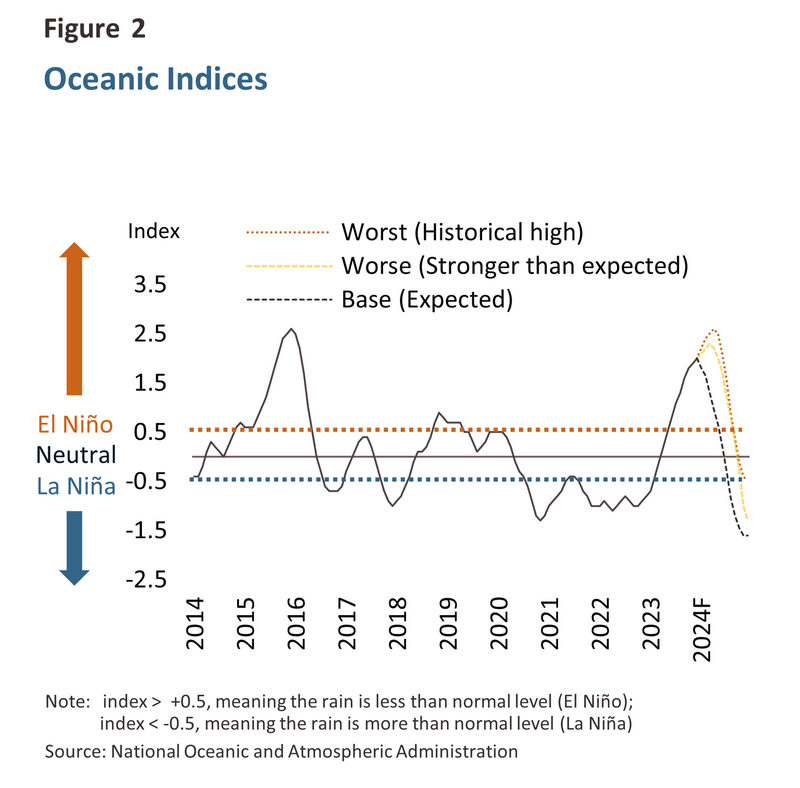
As 2024 began, Thailand remained in El Niño1/ conditions but changes in the Oceanic Niño Index (ONI), a measurement based on sea-surface temperatures in the equatorial Pacific, indicate that this is softening. Thus, in December 20232/, with temperatures 2.0oC above normal, the ONI indicated a ‘very strong’ El Niño that was close in scale to four earlier historically strong events3/ recorded in 1972 (2.1oC), 1982-1983 (2.2oC), 1997 (2.4oC), and 2015 (2.6oC). However, as the year progressed, the ONI began to weaken and it is now likely that the index will return to neutral conditions4/ this year, potentially then transitioning to a La Niña1/ (Figure 1). In light of these changes, Krungsri Research has assessed outcomes for 2024 based on three different scenarios (Figure 2):
-
Base case: Having begun to weaken in January, the ONI will enter neutral conditions in June 2024 and La Niña conditions in August 2024.
-
Worse case or stronger than expected El Niño: In this case, the ONI will increase to close to its 1982-1983/1997 levels in March before returning to neutral conditions in September 2024 and La Niña conditions in November 2024.
-
Worst case or historical high: In this scenario, the ONI will hit a 74-year high in April, as in 2015, and then transition to neutral conditions in September 2024 and a La Niña in December 2024.
What will the consequences be of the 2024 El Niño?
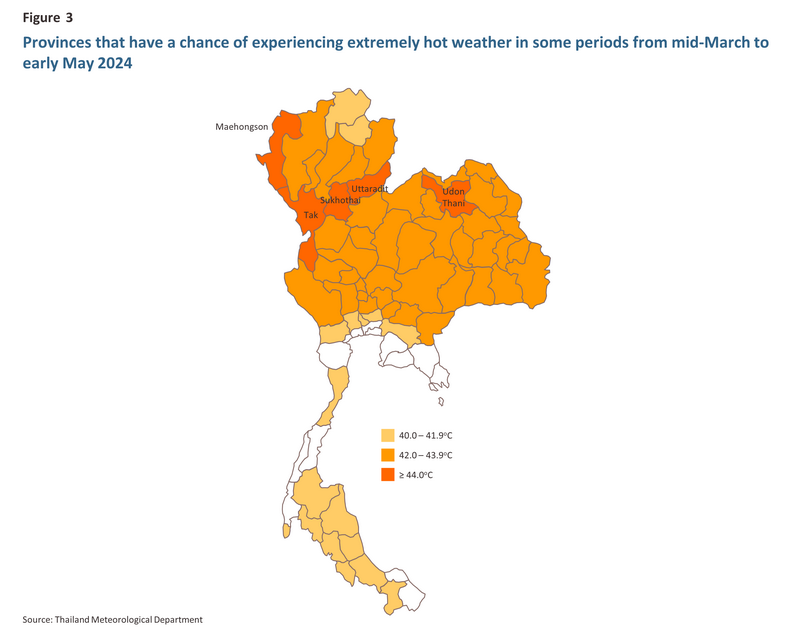
From the start of the year through to mid-2024, Thailand will face elevated temperatures and an increased likelihood of heatwaves, these being the typical outcomes of El Niño conditions. These periodic changes to the weather are driven by abnormally high sea surface temperatures in the equatorial Pacific that then cause a redirection of the current. This begins to flow towards the east of the Pacific (i.e., to South America), while trade winds weaken bringing hotter, drier weather to the western pacific (i.e., to Southeast Asia). The most recent forecast by the Thai Meteorological Department6/ indicates that this year, peak temperatures are likely to be 1.0-1.5oC above normal, which would push these above their level in the summer of 2023 and well into the zone designated as ‘extremely hot’7/. The highest temperatures will be in the north and northeast of the country, where they will reach 43.0-44.5oC, followed by the central and eastern regions (42.0-44.0oC), while in the BMR and the south, temperatures should hit a maximum of 40.0-41.0oC. Likewise, minimum temperatures are expected to be 1oC above normal nationwide. Such high temperatures are likely to pose a danger to the environment, triggering an increase in forest fires, and exacerbating particulate pollution and health problems connected to the heat. The consequences of extreme heat will also extend to include widespread coral bleaching, problems with growth and reproduction for aquatic life, and a decline in agricultural yields. This may then trigger food shortages, leading ultimately to increases in the price of agricultural products and other consumer goods.
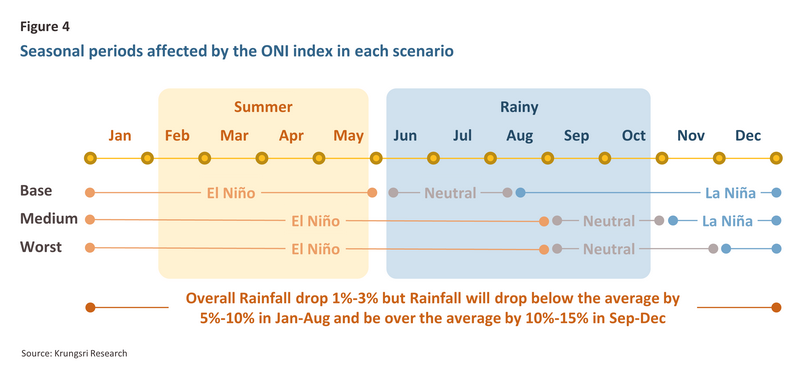
In the second half of 2024, the seasonal rains are likely to be disrupted (Dry Spell), and although the Meteorological Department will announce the end of the summer at the close of May 2024, El Niño conditions will mean that the onset of rains will likely be delayed or weakened, though naturally, if the ONI remains in the El Niño zone, these impacts will be amplified through June and July (Figure 4). This will reduce the water available for storage, and areas outside the reach of irrigation systems (Drought-stricken Area) may lack sufficient water to support agricultural activities.
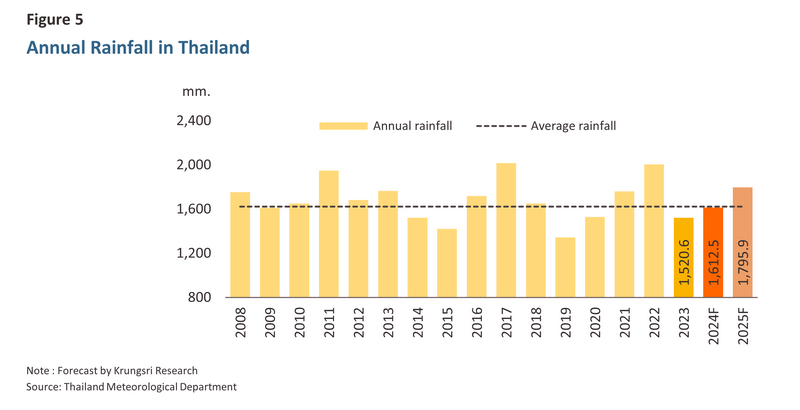
Although there is a strong probability that the ONI will return to normal conditions in the second half of 2024, there will likely be a reduced timeframe during which rain will be available for storage, while the continuing impacts of the El Niño will likely reduce rainfall. Nevertheless, overall levels of precipitation should remain close to the historical average, and Krungsri Research sees this dropping by just -1% to -3% this year relative to the average8/, or to around 1,613mm. This would then be close to the 30-year average (Figure 5), while in 2025, La Niña conditions are expected to return, pushing rainfall 5-10% above the long-term average. This would result in average precipitation of 1,700-1,800mm across the year, still far off the 1,948mm recorded during 2011, the year of the Great Flood, and 2017’s 2,016mm, which also coincided with widespread flooding. Over 2024-2025, the total quantity of useable water that is available should therefore be sufficient to meet demand, and as temperatures fall and access to water improves, the agricultural sector will benefit.
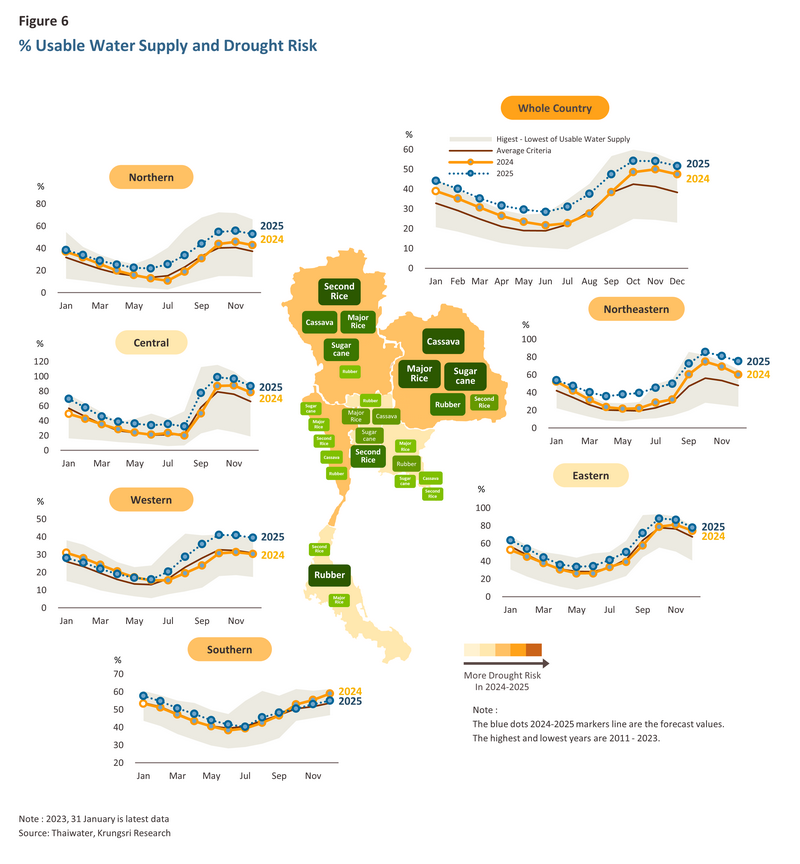
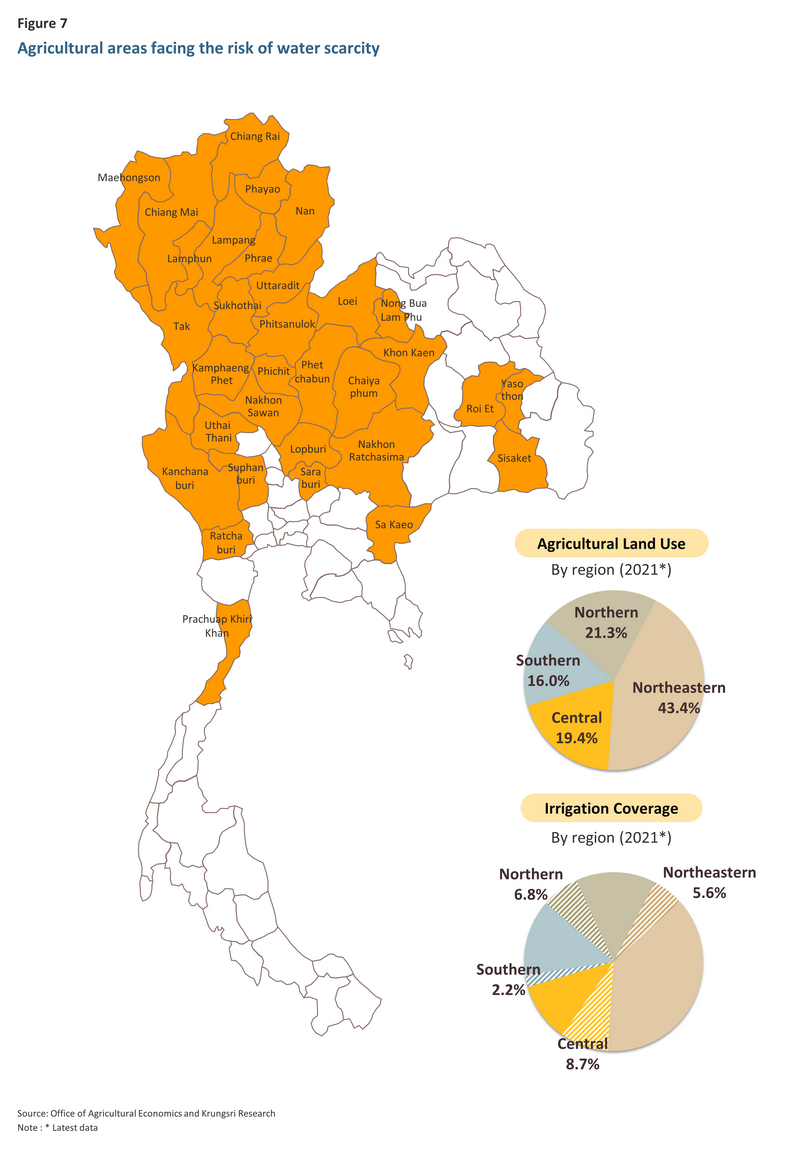
Over September and October 2023, the emergence of a monsoon trough raised rainfall above the average and so as of January 2024, the quantity of usable water in natural and artificial reservoirs in all regions was above normal for the period (Figure 6). Areas within the reach of irrigation systems will therefore be furnished with sufficient water through the year, but farmers in areas lacking access to irrigation are exposed to a considerable level of risk, especially during the first half of the year, when temperatures will be elevated but rainfall and soil moisture will be reduced. Farmers working unirrigated areas in 32 provinces may therefore see yields drop (Figure 7).
The impacts of drought on industrial supply chains and the economy overall
Krungsri Research expects that this year’s El Niño will impact the economy through 2024. This will manifest in the following ways.
1) Impacts on agricultural outputs
The effects of the drought will be felt by growers of many types of agricultural products, including rice, cassava, sugarcane, rubber, and oil palm, as well as fruits such as mango, durian, and pineapple. However, the exact effects will vary according to the type of the crop, where it is grown, and when it is planted and harvested. For example, agroforestry products such as rubber, oil palm, mango, durian, etc. are generally more drought-resistant than annual crops/field crops, but during a drought, outputs will still decline, although the extent of the fall will vary according to where these are grown. For annual crops/field crops such as rice, cassava, sugarcane, and corn, the impacts will depend on when the crops are planted, grown and harvested.
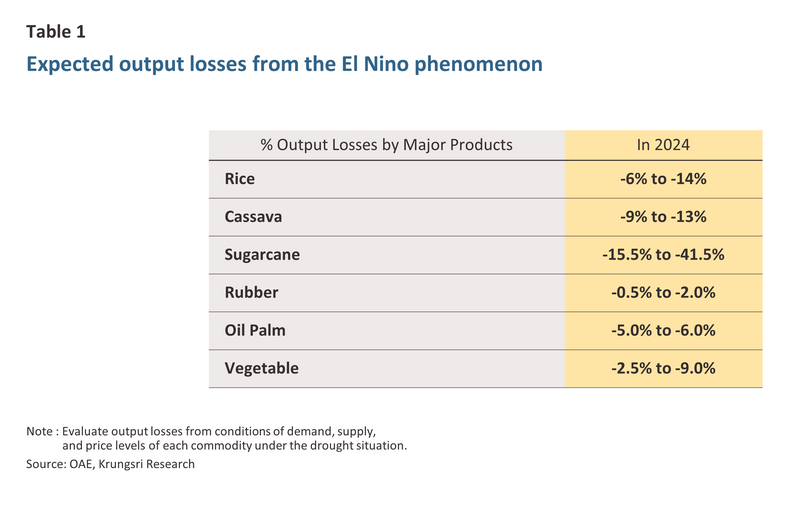
Krungsri Research has assessed the impacts of the drought on outputs for the major crops of rice, cassava, sugarcane, rubber, and oil palm, all of which are both sensitive to drought and important inputs into downstream supply chains9/ (Table 1). For these products, supply shortages resulting from the drought-induced drop in outputs may push up prices.
A number of factors will affect outputs, including: (i) the extent of irrigation systems and the quantity of water available for use in irrigation; (ii) delays and interruptions to seasonal rains (Dry Spell) that may then restrict plant growth; (iii) drier and hotter weather that will increase rates of evaporation and lower soil moisture, potentially increasing crop losses; and (iv) higher production costs (e.g., for the fuel and electricity used to operate pumps, as well as for insecticides and pesticides). In 2024, outputs of rice and sugarcane will be most heavily affected by drought, while the areas most impacted will be in the north, northeast and west of the country (Figure 6). Lower outputs will then undercut agricultural incomes, although through 2025, as La Niña conditions emerge, temperatures will fall and moisture will increase, thus helping outputs to bounce back.
2) Impacts on manufacturing supply chains
When assessing the financial impacts of drought, consideration must be given to the linkages between the agricultural sector and other parts of the economy, and so Krungsri Research here considers the supply chains of those crops that are most likely to be affected by drought and delayed rains, that is, rice, cassava, sugarcane, rubber, and oil palm. This analysis is based on the 2015 Input-Output Tables produced by the Office of the National Economic and Social Development Council.
The results of the analysis show that the drought will result in losses not just for the agricultural sector but will extend to include both upstream and downstream industries. In the case of the former, this will result from lower outputs and hence reduced demand for upstream goods, while in the latter case, businesses consuming agricultural goods as inputs may have to cut back on production or source more expensive alternatives. Losses will thus not be limited only to the agricultural sector, and businesses in the agro-processing, manufacturing, and service sectors that are dependent on supply chains directly and indirectly linked to agriculture may also suffer as a result of the drought.
3) Krungsri Research view: Impacts of the drought on GDP
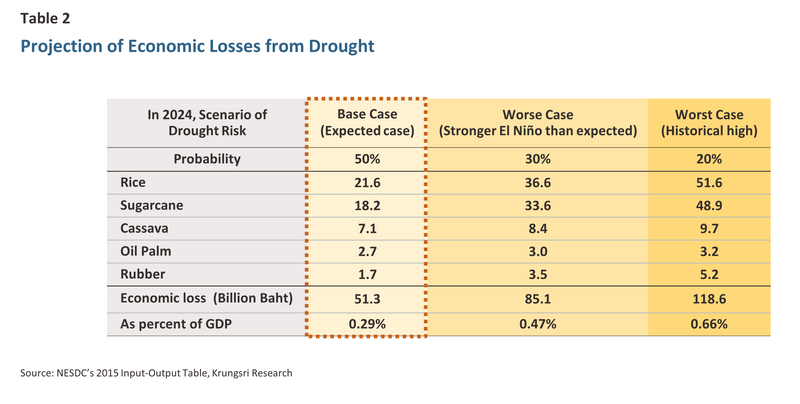
Analysis of the impacts of this year’s drought is based on the effects of earlier El Niños in 1972, 1982-1983, 1997 and 2015, which had similar intensities and which followed a comparable track as conditions returned to normal. Krungsri Research’s assessment of the situation is thus that in 2024, in the base case, the drought will cut -0.29% from GDP, while in the worst-case scenario, this will accelerate to a -0.66% drop in GDP.
However, the analysis also shows that the extent of the impacts on GDP depend on when an El Niño occurs and how much irrigation water is available for use, and so a combination of water management policies and the timing of the onset of rains from June onwards will play an important role in minimizing the economic effects of the drought. Krungsri Research’s assessment of the latter have thus been split into three scenarios according to the intensity and length of the El Niño conditions (Table 2). These are:
-
Base case: Losses to supply chains will total THB 51.3 billion, cutting GDP by -0.29% relative to the non-drought condition.
-
Worse case or stronger than expected El Niño: Supply chain losses will reach THB 85.1 billion, or -0.47% of GDP.
-
Worst case or historical high: Combined losses across all supply chains will climb to THB 118.6 billion, slashing -0.66% from GDP.
Is flooding really preferable to drought? The rising risk of floods as the El Niño abates
In addition to the drought, Thailand faces the prospect of flooding later in 2024 as changes in weather patterns and environmental factors influence the climate. These will include the following:
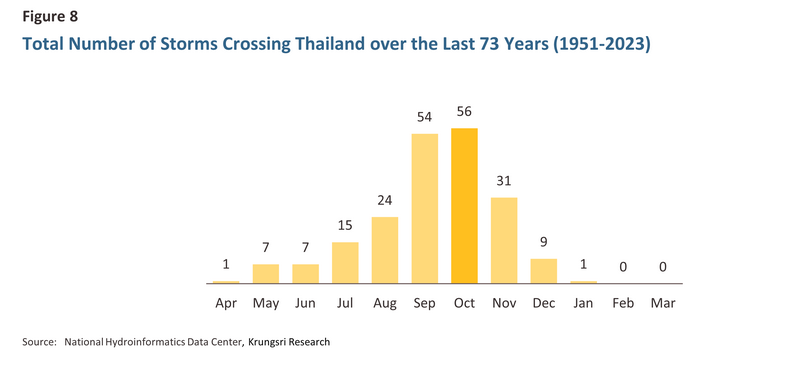
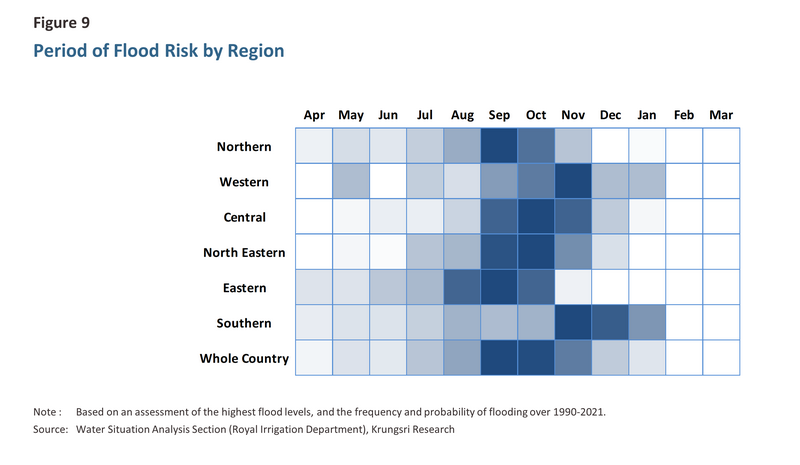
1) In all three scenarios, the Oceanic Niño Index (ONI) weakens into a La Niña (i.e., turns negative). In the base case, a La Niña emerges in August 2024, leading to heavier than normal rainfall, while in the worse and worst cases, although a weak El Niño prevails in August 2024 before the return of neutral conditions in September and October 2024, there is still a strong likelihood that rainfall will return to normal levels. At the same time, the annual tropical cyclones that arrive in Thailand through August to October should ensure plentiful rainfall (Figure 8), and this may then trigger flash flooding (Figure 9).
2) In 2024, total rainfall during the rainy season, in particular over the period from September to December, is expected to be 10-15% above normal10/. There will therefore be an increased risk of flash flooding over the last two months of the rainy season, especially in flood plains and other flood-prone areas. Nevertheless, there will be only a slight risk of widespread flooding given the lower-than-normal rainfall in the first half of the year. This will keep the total for the year somewhat lower than the average of 1,613mm and significantly below the 1,948mm recorded in 2011 (Figure 5).
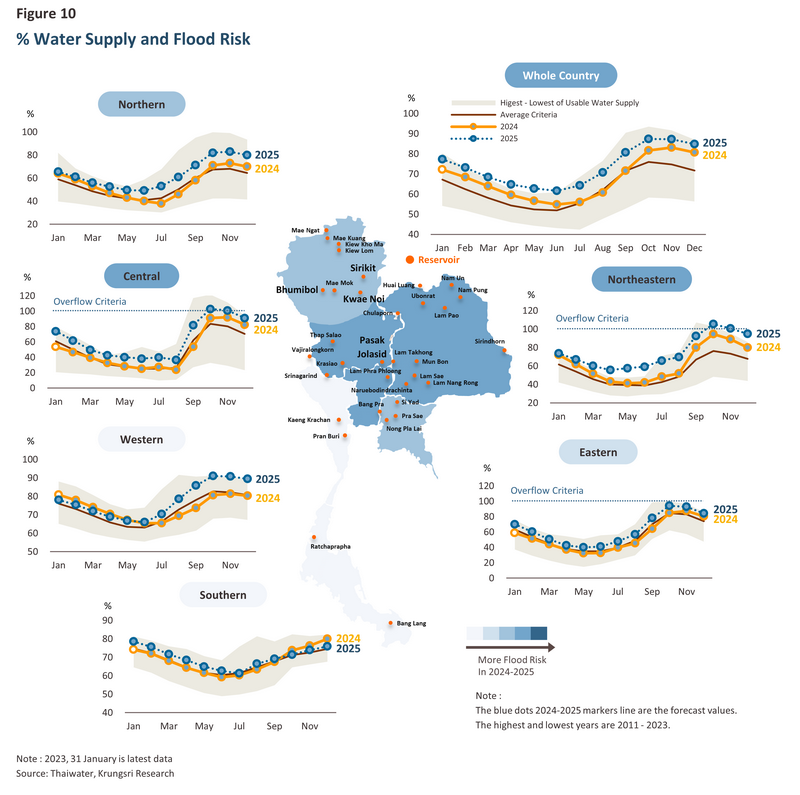
3) Storage levels in large and mid-sized reservoirs are currently above average11/, and as of January 2024, 51,166 million m3 of water was held in large reservoirs, these thus being at 72% of capacity. This is higher than both the 13-year average12/ and the 46,783 million m3 (or 67% capacity) held in 2011, the year of the Great Flood (Figure 10). Likewise, mid-sized reservoirs are at 74% capacity, which is also above their 2011 level of 68%. However, these figures indicate that the country’s reservoirs have only a limited capacity to store additional rainwater, and so if rainfall is above average in reservoirs’ catchment areas, the risk of damage to reservoirs and dams may make it necessary for the authorities to increase the release of water from these, thus adding to the possibility that flooding will be experienced in downstream areas.
4) Number of cyclones, 1 or 2 tropical cyclones13/ are expected in 2024, and these are most likely to affect Thailand in September and October. Long-term data indicate that 2-3 cyclones are typically encountered annually14/, but over the past decade, this has dropped to 1-2 per year15/.
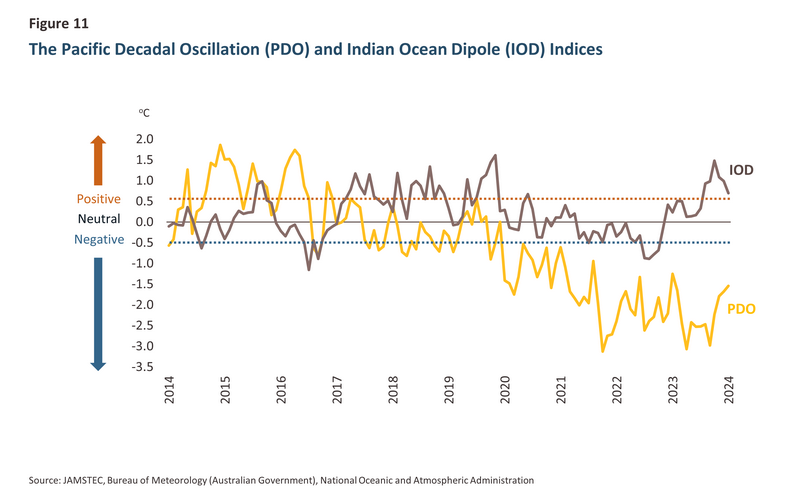
5) Tropical cyclones may also affect the weather in Thailand indirectly, and so in addition to cyclones passing over the country, others may weaken to regular storms in neighboring countries but still impact rainfall in Thailand. The risk of this is reflected in two indices, the Pacific Decadal Oscillation (PDO)16/ and the Indian Ocean Dipole (IOD)17/, which stood at respectively -1.5 and 0.7 in January 2024 (Figure 11). However, the IOD is trending downwards and so there is an increasing likelihood that rainfall will return to normal in the second half of 2024.
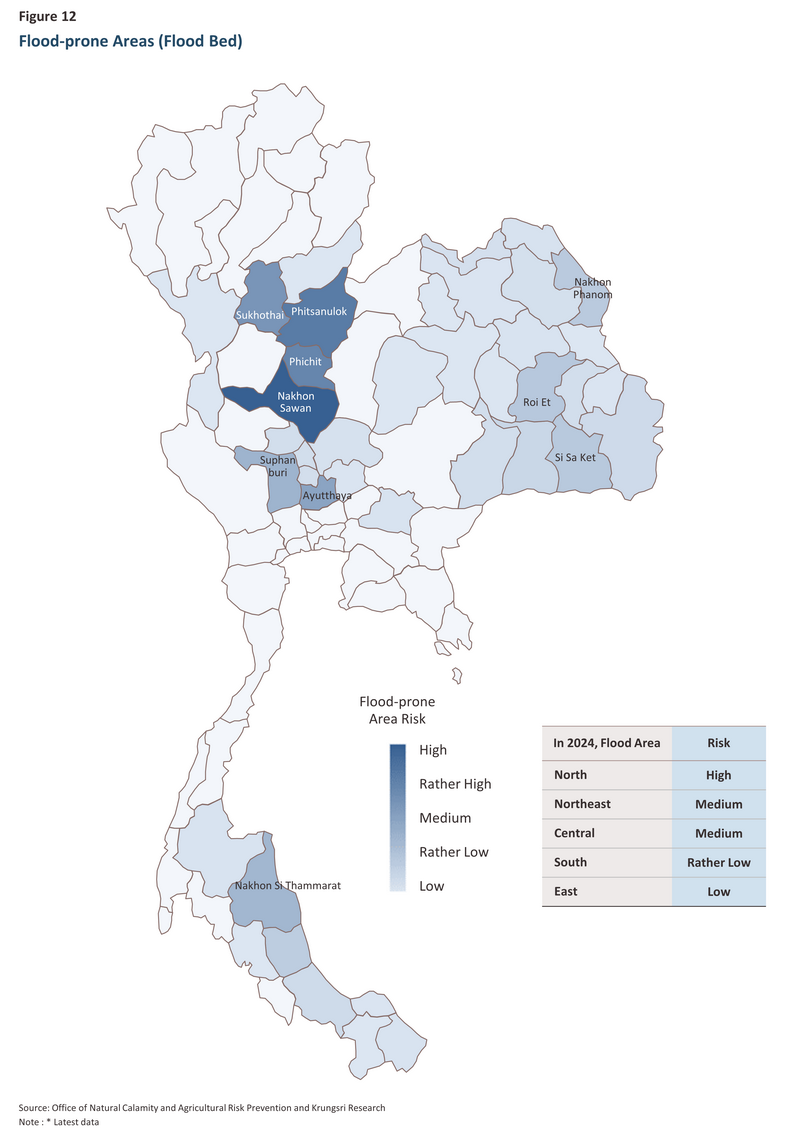
Given the above, water levels will rise through the second half of 2024, and as the rainy season develops, reservoir levels that are already above average will climb to close to recent highs, thus increasing the risk of flooding. This will, though, be limited to flood plains and other flood-prone areas, especially in the northeast, lower north, and central regions (Figure 12). The resulting damage to buildings, houses, other types of property and assets, and communications routes would then generate additional losses for the agricultural sector beyond those caused by the drought at the start of the year.
Likely impacts of flooding on the economy
Damage resulting from flooding may be more varied than that caused by the drought, and this may extend to include losses to commercial structures, homes, factories, machinery, vehicles, communications networks, and livestock. Impacts on agricultural crops will vary depending on the extent of the flooding and how fast floodwaters move, and if flooding is gradual and not too deep and dissipates rapidly, the impacts on crops should be fairly limited. However, if flood waters are fast moving and areas remain inundated to a significant depth for an extended period, crops such as rice, sugarcane, cassava, and other plants will undergo greater damage and impacts on downstream industrial supply chains will be more extensive. In addition, the resulting supply shortages are likely to push up the prices of agricultural goods affected by this.
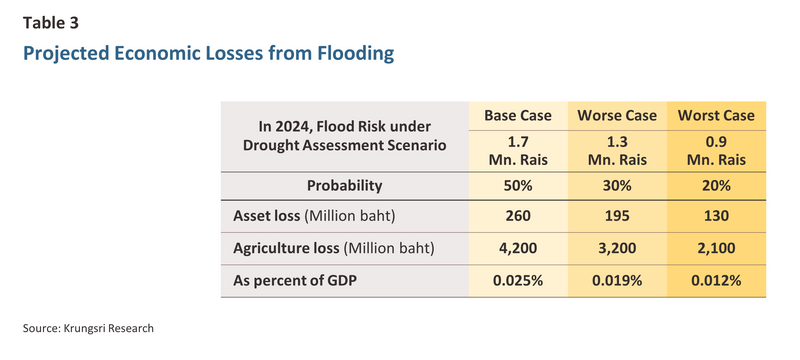
Krungsri Research has analyzed the extent and possible economic impacts of this flooding under the three different scenarios used in the analysis of the impacts of the El Niño18/ (Figure 3).
-
Base case: In this scenario, flooding impacts 1.7 million rai. This causes THB 260 million in damage to asset and THB 4.2 billion in crop losses, cutting -0.025% from GDP relative to a no-flood condition.
-
Worse case: Flooding is reduced to 1.3 million rai, causing THB 195 million in asset damage and THB 3.2 billion in crop losses. GDP is thus reduced by -0.019%.
-
Worst case: 0.9 million rai is impacted by flooding. This generates THB 130 million in losses from asset damage and THB 2.1 billion in damage to crops, shaving -0.012% from Thailand’s GDP.
The economic consequences of flooding will depend on: (i) total rainfall and water management policies; (ii) the areas affected by flooding; and (iii) the overlap between flood zones and economically important areas (i.e., households, factories, and farmland). Thus, if flooding is experienced in more economically significant areas, such as in and around industrial estates, major agricultural areas, or communications networks, this is more likely to have consequences for upstream and downstream manufacturing supply chains, thereby amplifying the associated economic losses.
Nevertheless, there is a host of additional factors that may influence the risk of flooding but that are unpredictable and outside anyone’s control. This includes the sea level in the Gulf of Thailand and the extent of water held in natural reservoirs, which is currently rather high, especially in the Mekong River basin. Because these factors may slow the dispersion of floodwaters, there is a risk that this will add to the losses resulting from a given level of flooding. Outcomes will also be affected by the extent and effectiveness of advance government planning, including preparing low-lying areas to receive flood waters, effective management of reservoirs, removing blockages to waterways, assembling machinery and equipment in high-risk areas, deploying effective water distribution policies, and advance checking of dam embankments, retaining walls and other public infrastructure.
The overall impacts of drought and then flooding on growth and inflation
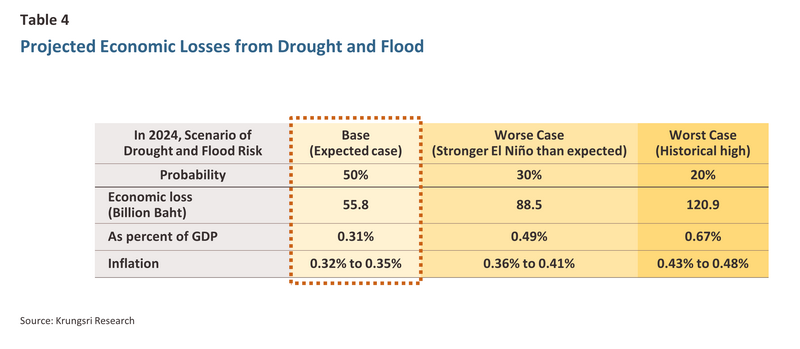
Combining the impacts of the drought and floods under the three scenarios allows for an assessment of the effects of these on supply chains and on the economy overall (Table 4).
-
Base case: Supply chain losses will total THB 55.8 billion, shrinking the economy by -0.31% relative to the no drought/no flood case.
-
Worse case: Supply chain losses will total THB 88.5 billion, shrinking the economy by -0.49% relative to the no drought/no flood case.
-
Worst case: Supply chain losses will total THB 120.9 billion, shrinking the economy by -0.67% relative to the no drought/no flood case.
In addition to the impacts described above, drought and floods may also add to inflation. This will be because the combined effects of these will be to cut agricultural output, generating shortages across supply chains and pushing up prices for agricultural and agro-processing goods, especially for rice, sugar, vegetable oils, and some vegetables. This will then add to household bills, the cost of food consumed outside the home, and overheads for businesses in related parts of the economy, which will be hit by both direct cost increases and second-order effects. The net effect of this will be to add 0.32-0.35% to headline inflation19/, though because manufacturers raise prices in whole-baht units, the actual effect on inflation may be more pronounced than this analysis indicates.
1/ An El Niño is said to have occurred when Pacific sea-surface temperatures in a designated area are above normal for an extended period. Typically, this will then result in lower-than-normal rainfall and thus drought in Southeast Asia. The intensity of any given El Niño is measured by the ONI Index. Thus, if this is in the range 0.5-0.9, this is a weak El Niño, if it is between 1.0-1.4, it is a moderate El Niño, between 1.5 and 1.9 is regarded as a strong El Niño, and above 2.0 is a very strong event. Likewise, values below -0.5 indicate La Niña conditions, with the same (negative) ONI values being used to classify this as weak to very strong.
2/ The El Niño/Southern Oscillation (ENSO) is a periodic phenomenon that lasts for a minimum of several months. Measurements of the strength of the ENSO are typically averaged over three-month blocks, so that for example the DJF value indicates the average ENSO intensity over December, January and February. The most recent value for the ONI for December 2023 averages measurements for November and December 2023 and January 2024.
3/ Measurements go back to 1950, a timespan of 74 years.
4/ Neutral conditions are said to occur when sea surface temperatures are in the range -0.5oC to 0.5oC relative to the average.
5/ The Pacific Ocean in the area 5oN-5oS and 170oW-120oW. This is referred to as the Niño 3.4 Region.
6/ Long-term forecast for summer 2024 made by the Meteorological Department, published 25 January, 2024.
7/ The Meteorological Department classifies temperatures in the range 35.0-39.9oC as ‘hot’ and those above 40oC as ‘extremely hot’.
8/ The Meteorological Department predicts that over the February to May summer season, rainfall will be 30% below the long-term average (source: The Meteorological Department’s long-term forecast for summer 2024, published 25 January, 2024).
9/ Based on an assessment of the period of the harvest, the area under cultivation that has access to irrigation and that lacks this, the type of crop being grown, the likelihood of crop losses, and current prices.
10/ The average for the 30 years between 1991 and 2020.
11/ Over 2011-2023, January storage levels have averaged 67.6% of capacity.
12/ The 13 years between 2011 and 2023.
13/ Includes depressions, tropical storms, typhoons, etc.
14/ The average for the 73 years between 1951 and 2023.
15/ The average for the 10 years between 2014 and 2023.
16/ The Pacific Decadal Oscillation (PDO) is a phenomenon caused by differences in sea temperatures on either side of the Pacific in the region 20oN. During a negative phase, water in the east is warmer, and this tends to raise rainfall in Thailand and nearby areas above normal levels. Positive and negative phases typically cycle over a period of around 30 years.
17/ The Indian Ocean Dipole (IOD) (measured using the Dipole Mode Index (DMI)) is an oscillation in local water temperatures between the east and west sides of the Indian Ocean in the areas 5oE-7oE, 1oS-1oN and 9oE-11oE, 1oS-0oS. When the index is in a negative phase, warm water collects in the east of the Indian Ocean, and this is linked to an increase in rainfall in Thailand and neighboring countries.
18/ Assuming that around 50-60% of the affected area is used for agriculture.
19/ Calculated by Krungsri Research based on data from the Ministry of Commerce.