Business conditions will slowly improve for airlines over the three years from 2021 to 2023, helped by the rebound in the global economy and world trade. In addition, the increasingly widespread rollout of COVID-19 vaccines will also feed into a steady reopening of national borders, and with an easing of travel restrictions, demand for domestic and international air travel will strengthen. However, the need to step up investments to meet higher health and safety standards that are both being set by the global airline industry and imposed by the changed post-crisis environment will place a heavier financial burden on operators, and carriers that are on a liquidity crunch, operate only a limited number of routes or have a restricted market share will run the risk of facing a cash-flow crunch and of being forced out of business.
Overview
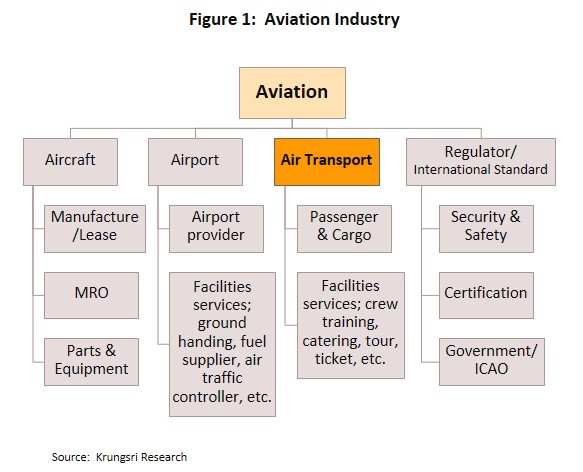
Air transportation plays an important role in national economies. In the wider aviation industry supply chain (Figure 1), it is linked to other parts of the economy both directly (e.g., manufacture of aircraft and aircraft parts, aircraft maintenance, airports, etc.) and indirectly (e.g., through trade, investment, tourism, logistics and warehousing).
Transporting goods and people by air is faster and makes it considerably easier to access to far-flung locations than using other transport modes. It is the safest form of transportation[1] and operations generally run close to scheduled times. This makes air travel an increasingly popular mode of transportation worldwide, which is reflected in the construction of modern airports around the world, ongoing development of large-capacity aircraft to meet rising demand to transports cargo and passengers, the rollout of new, modern transportation tools and equipment, the upgrade and expansion of warehousing facilities to meet demand generated by airports, and the increasing efficiency of the carriers. However, air travel has its downside, notably high per-unit cost, the need for extensive infrastructure to support the whole airline industry, and requirement for road transport links to connect to the final destinations.
Generally, carriers can be classified according to the type of items transported.
1) Passenger carriers: These aircraft have cabins fitted with all the features necessary to provide regular passenger services. For these players, the main source of revenue is ticket sales, boosted by additional receipts generated from on-board retail services. However. to maintain a steady revenue stream, passenger carriers sometimes sell a portion of tickets annually to tour agents at wholesale prices.
2) Cargo and air express services: These use freighters that are equipped with the machinery and equipment needed for goods handling. Within this segment, revenue is derived principally from shipping charges and fees for customs clearance. Most operators offer charter services and move general cargo, cargo that require special handling, service cargo (i.e., goods for the airline and airline staff), and diplomatic cargo and mail.
3) Combined carriers: These utilize space in the belly of passenger aircraft to carry cargo. Hence, they generate revenue from both ticket sales and air freight charges.
4) Other air services: These target niche markets, such as sightseeing flights, training flights, skydiving, aerial filming and photography. These services often require the use of specific types of aircraft such as helicopters, balloons, and small airplanes.
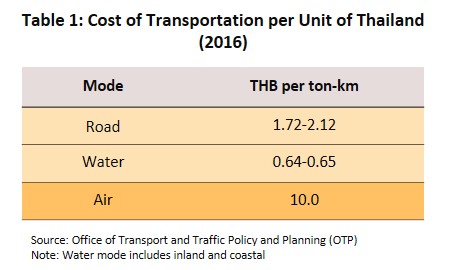
Generally, it is more expensive to move goods by air (Table 1). For an airline, business costs comprise: (i) operating costs which is about 55% of total costs. That includes jet fuel (normally 30-35% of total business costs, but this could rise to 40-45% when oil prices spike[2]); (ii) fixed costs (33% of the total), including staff costs (which can be especially high for skilled staff), cost of purchasing or leasing aircraft, and fees for managing flight information and related systems; and (iii) other costs, such as those incurred for regular aircraft checks and maintenance, scheduled maintenance fees, and charges for the use of airports and parking facilities. The major sources of revenue are approximately 75% from passenger services, 15% from airfreight, and 10% from other services (Figure 2).
In Thailand, carriers regularly use aircraft that they own or lease, but in both cases, they are required to obtain an air operator license (AOL) from the Civil Aviation Authority of Thailand (CAAT). Freight forwarders are exempt from this requirement[3]. The industry is mostly controlled by combined carriers since this business model allows operators to maximize profits. Under the combined-carrier model, airline operators and freight forwarders sell space in aircraft holds to third parties or to domestic and international business partners. This then allows services to connect seamlessly and link across a comprehensive route network.
Airline services typically include the following:
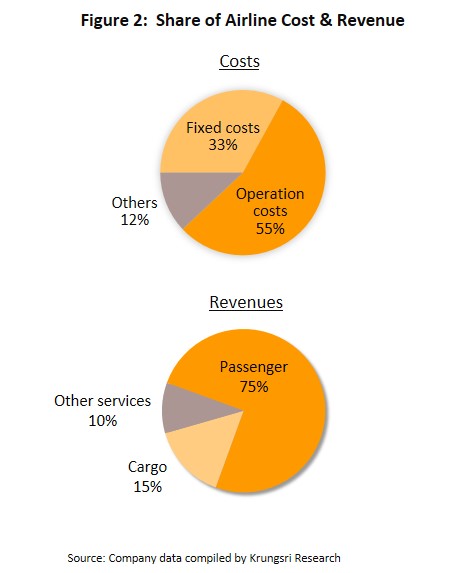
1) Scheduled services operate fixed routes on a pre-arranged timetable, allowing operators to allocate planes for passenger and freight in advance. They can also arrange charter flights. 44.2% of Thai operators operate this type of services (Figure 3).
2) Non-scheduled or charter flight services operate intermittent or on-demand flights. These services are offered by 46.5% of Thai operators, most of which are small companies that may only have a single aircraft, which means they are unable to exercise a great deal of discretion over the services they offer. The CAAT has issued regulations specifying that players that operate only a single plane are restricted to providing ad hoc charter flights, while those that run at least two aircraft may provide program charter flight services.
3) Other services include sight-seeing and training flights, skydiving, and aerial filming and photography. 9.3% of Thai operators provide these kinds of services.
The Thai airline industry has seen steady growth since 2008, thanks to: (i) liberalization of the industry, first for airfreight (2008) and then for domestic inter-city passenger transport (2010), and finally, with the implementation of the ASEAN Economic Community in 2015, the liberalization of travel between the ASEAN zone and other regions; (ii) economic growth, which has lifted consumer spending power; and (iii) the rising number of services offered by low-cost carriers (LCCs) which typically offer fares that can be 40-50% cheaper than those offered by full-service carriers (FSCs), thus making mass air travel more affordable. These have attracted a larger number of players to the market, but with this, competition has increased for both low-cost and full-service carriers. Over this period, players have also invested heavily to expand their fleet and the efficiency of their operations[4], the number of routes they serve, and on marketing to niche or specific groups (e.g. charter flights).
Operators may be characterized by their main operation:
- Passenger carriers: There are 81 currently (53.3% of all airlines operating in Thailand). 68 of these run scheduled flights, the most important being Thai Airways and New Gen Airways, while foreign joint ventures include Thai AirAsia X (Malaysian) and Thai Vietjet Air (Irish and Vietnamese). 13 airlines do not run regular flights, including Thai Lion Air Mentari (Indonesian), Mjets and SFS Aviation.
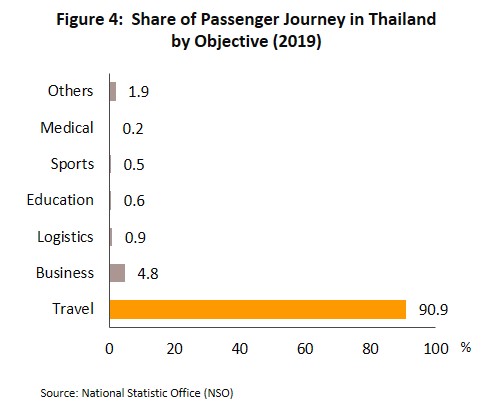
Growth in the passenger segment has naturally moved in step with the expanding tourism sector. 90.9% of passenger arriving in Thailand do so for the purpose of tourism (Figure 4).
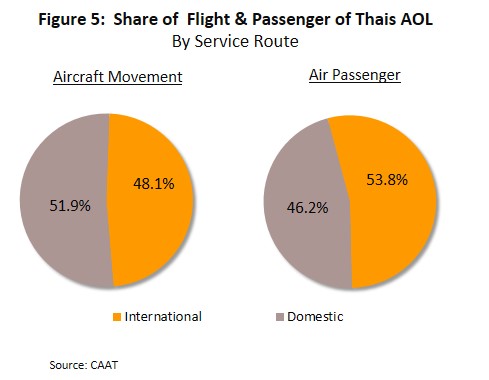
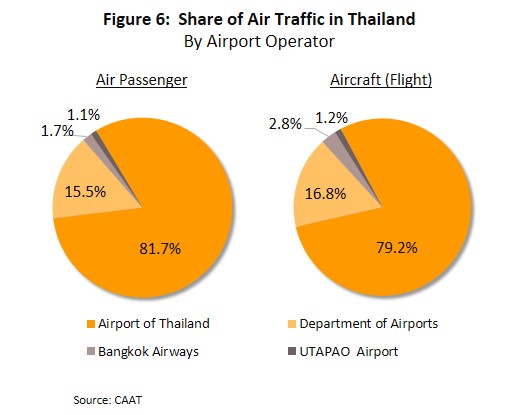
As such, in 2019, 48.1% of all aircraft flying to Thailand were international flights (Figure 5), up from 45.8% in 2018. But by number of passengers, this had risen, and in 2019, 53.8% of all passengers were international arrivals. This was partly driven by government efforts to stimulate the tourism sector, which resulted in almost 40 million foreign tourist arrivals in 2019 (up 4.4% from 2018 total). This was also supported by higher flight frequencies and additional routes served by airlines (especially LCCs), and the rising number of Thais traveling abroad, which in 2019 rose to a new record of 10.4 million. The busiest airports in the country are Suvarnabhumi and Don Muang, which combined processed 64.7% of all passengers transiting in airports in the country[5] (Figure 6).
- Airfreight: There are 71 airfreight operators in Thailand (46.7% of all operators), 69 of which run scheduled flights. Major players in this segment include Bangkok Airways (which has its own warehousing facilities at Suvarnabhumi and is owner of 3 airports), Triple I Asia Cargo, FedEx (a joint-venture with Dutch investors), and DHL Express International (a joint-venture with German players). The 2 charter operators are K-Mile Air and Thai Express Air.
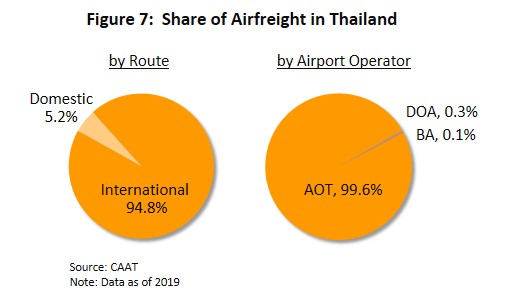
Goods that are typically shipped by air include those that have a high value or that require special handling, such as gems and jewelry, fresh cut flowers, vaccines, computer parts, and electronic equipment. 95% of airfreight is bound for overseas markets (Figure 7). Domestically distributed goods are generally moved by road, and sea routes are usually used for goods that are moved in bulk and container box. The market is also strongly influenced by the fact that airfreight is significantly more expensive than other shipping options. The overwhelming majority of goods shipped by air within or from Thailand (almost 80% of the total) are processed through airports owned by AOT, including Suvarnabhumi and Don Muang[6].
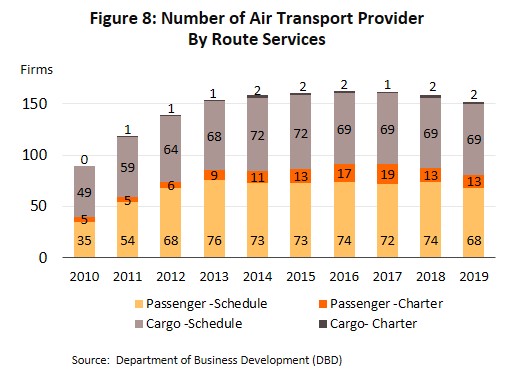
The Ministry of Commerce data on companies registered in Thailand show that as of 2019, there were 152 air transport operators in the country. This includes both Thai players and joint ventures with foreign companies[7] (Figure 8).
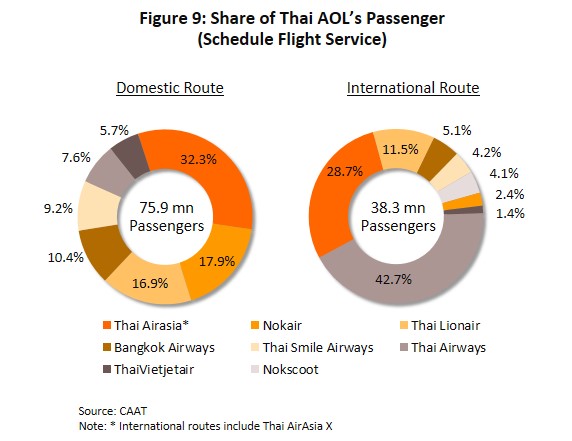
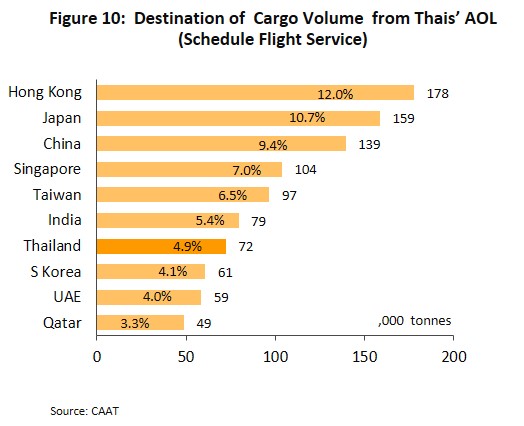
In 2019, among Thai operators of scheduled flights, Thai AirAsia had the greatest share of the domestic passenger market (Figure 9), carrying 24.5 million customers in the year (32.3% of all domestic air travelers). This was followed by Nok Air (17.9%) and Thai Lion Air (16.9%). For the international market, Thai Airways had the largest share of Thai-based operations, with 16.3 million customers (42.7% of the total), followed by AirAsia Group (28.7%) and Thai Lion Air (11.5%). For outbound travelers, the most popular destinations were China, Japan and Singapore. However, for airfreight, the split between domestic and international segments is very different, with the former accounting for just 4.9% of all Thai airfreight. For goods flown overseas, the most popular destinations were Hong Kong (12.0% of all Thai-originating freight), Japan (10.7%) and China (9.4%) (Figure 10)
.
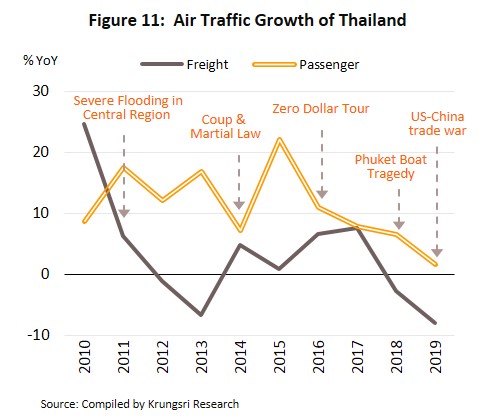
Generally, because most Thai operators are combined service carriers, they have the flexibility to rapidly reallocate space in their aircraft and schedules to meet prevailing passenger and cargo requirements (Figure 11). Therefore, as demand for passenger services rises and falls, operators can allocate space to cargo services in a counter-cyclical fashion. This has allowed players to preserve revenue as well as to grow despite fluctuating demand.
Situation
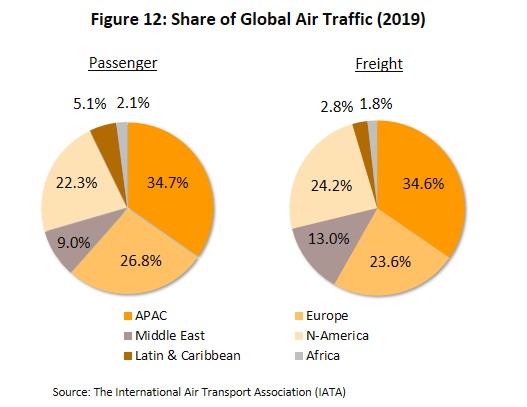
In 2019, players faced more challenging global business conditions due to slower growth in air passenger traffic. Meanwhile, demand for airfreight fell for the first time in a decade due to weaker global trade and economy and more geo-political tensions. In the year, the Asia-Pacific region (APAC) contributed the largest share to both the passenger and freight markets, the region accounting for 34.7% and 34.6% of the global total, respectively. This was followed by Europe, North America, and the Middle East (Figure 12). The main features of the global market for air travel and transport in 2019 are given below.
- Revenue passenger kilometers (RPKs), which measures the total distance of passenger journeys, rose 4.2% worldwide from a year earlier. With 4.9% and 4.8%, growth in Africa and Asia-Pacific, those regions ran ahead of the global average. Growth was next highest in Europe and Latin America (Figure 13).
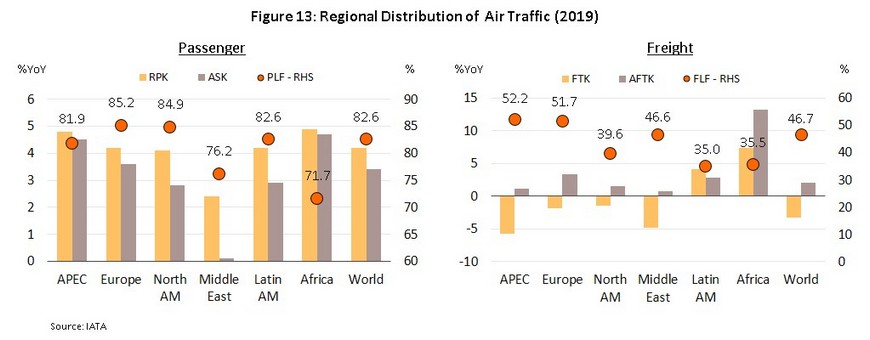
- Available seat kilometers (ASKs), which measures airline passenger capacity in terms of distance traveled, increased by 3.4%. Marking increases of 4.9%, 4.5% and 3.6% each in Africa, Asia-Pacific and Europe, these were above average. In the Middle East, ASK rose just 0.1%. Because increases in ASK lagged RPK growth, passenger load factor (PLF) also rose, climbing 0.9 ppt on its 2018 value to 82.6%.
- Freight tonne kilometers (FTKs; weight moved by distance) slipped 3.3%, in-line with generally weaker global trade in 2019 (about 35% of the value of the latter is attributed to goods shipped by air; source: International Air Transport Association). And with the exception of Africa and Latin America where air cargo volume rose by 7.4% and 4.2% respectively, falls were seen across the board. But at the same time, available freight tonne kilometers (AFTK) rose 2.1% and caused the freight load factor (FLF) to slip 2.6 ppt to 46.7%, though the FLF remained above the global average in Asia-Pacific and Europe.
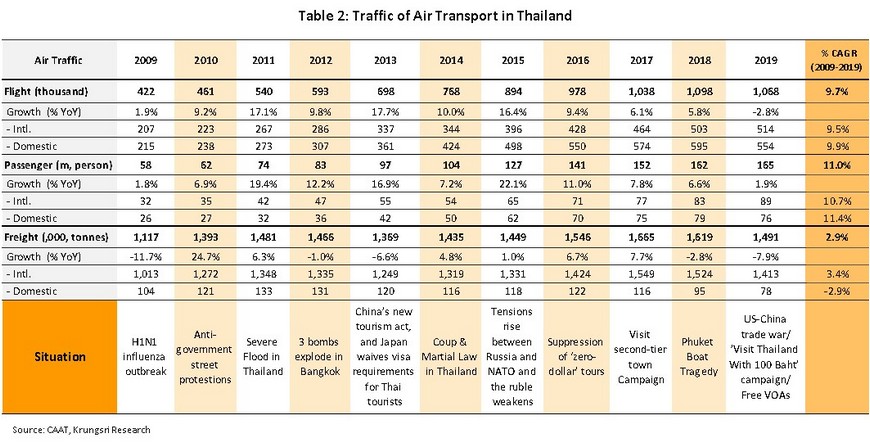
For Thailand, 2019 saw weaker growth in passenger numbers and airfreight volume falling for the second consecutive year. The latter was driven by slower economic growth, which dropped from 4.1% in 2018 to just 2.5% a year later, and the first fall in exports in 4 years. On the other hand, passenger services benefitted from government support for the tourism sector, including the waiving of fees for visas issued on arrival (VOAs) between 15 November 2018 and 30 April 2020. In addition, a 3.9% appreciation of the baht and several promotion campaigns had encouraged more Thais to travel abroad, boosting the total number of international flights and travelers. However, at the same time, some operators turned loss-making, including Thai AirAsia which recorded THB474 million loss, and Nok Air which was THB2.0 billion in the red. The overall situation for scheduled flights over the past decade is given in Table 2 below.
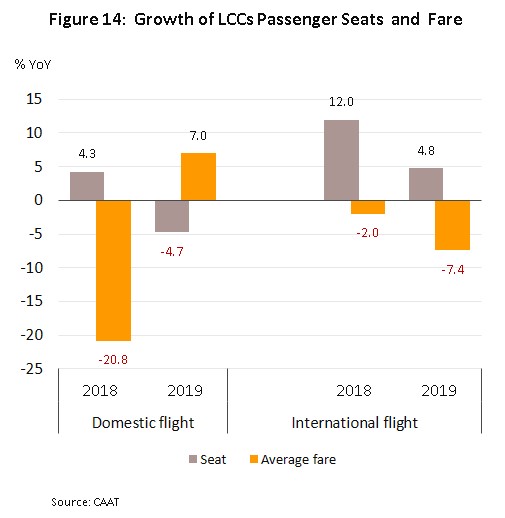
- In 2019, the number of flights fell for the first time in a decade, sliding 2.8% to 1.1 million. However, while the number of domestic flights fell 6.9% to 550,000, international flights rose 2.2% to 510,000. This discrepancy in growth was partly driven by the decision of low-cost carriers to switch their resources from servicing domestic routes to international routes, which then fed into an average 7.0% hike in fares for domestic routes, but that was balanced by a 7.4% drop in international ticket fares (Figure 14).
- Passenger numbers also rose at the slowest rate in 9 years in 2019, inching up 1.9% to 165 million. However, there was again a divergence between domestic passenger trips and international trips. While the latter rose 7.2% to 88.8 million (in line with the 4.4% annual rise in the number of foreign arrivals), the number of domestic air passengers dropped for the first time in a decade, sliding 3.8% to 76.3 million. The countries that contributed the largest share of foreign arrivals in Thailand were, in order of importance, China, India and the ASEAN-5.
- Airfreight volume fell 7.9% in 2019, falling for the second consecutive year. Both the international and domestic markets saw declines, at -7.3% and -17.9%, respectively (or 1.4 million and 0.078 million tonnes each). The most important destinations for airfreight flights originating in Thailand were Hong Kong, Japan and China.
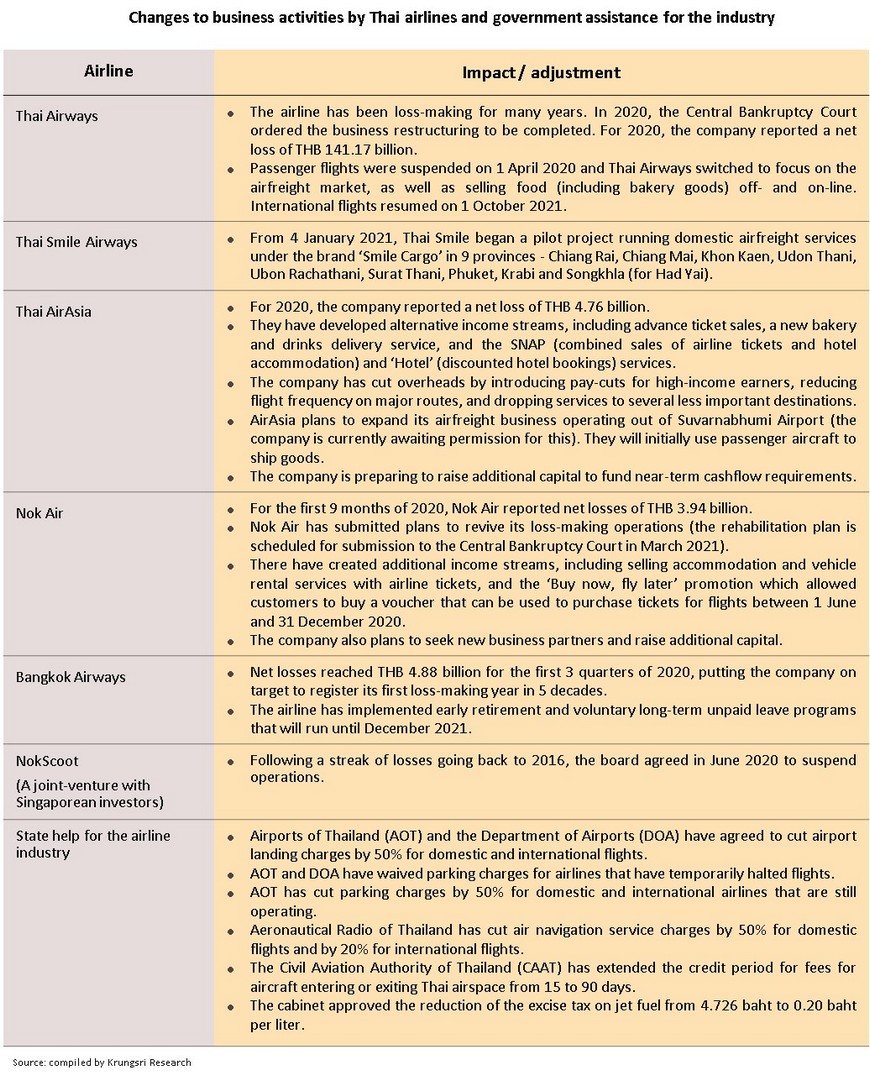
In 2020, the airline industry endured a body-blow delivered by the COVID-19 pandemic. That has pushed many airlines into the red and caused more than a few to fail, including NokScoot and Thai Airways. In response to the difficult business environment, airlines rushed to cut overheads (for example, by slashing salaries, laying off staff, and reducing fleet size) and sought bailouts from governments. Indeed, the International Air Transport Association (IATA) estimates that in 2020, passenger numbers crashed 60.5% to just 1.8 billion from 4.5 billion in 2019. Following the collapse in passenger numbers, losses reached record highs, estimated at USD119 billion across the industry worldwide. Losses in North America were the highest at USD45.8 billion, followed by Asia-Pacific (USD31.7 billion) and Europe (USD26.9 billion). Against this, the airfreight segment managed to grow slightly in the year as operators rapidly repurposed idle passenger planes to carry cargo. That increased the share of revenue from airfreight for the industry; it tripled from 12% in 2019 to 36% in 2020 (source: IATA).
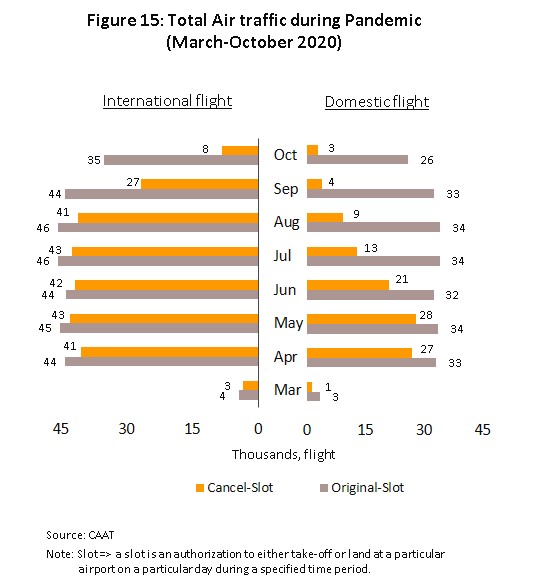
Weaker demand for air travel prompted Thai carriers to reduce international flights in March last year (Figure 15). They then ceased all passenger flights in April (though some airfreight flights continued). Airlines restarted domestic services in June after the government eased national lockdown measure, allowed inter-province travel to resume, and tried to jump-start domestic tourism, for example, with the ‘We Travel Together’ program. At the same time, economic activity also started to return to normal. However, international travel remained stalled. Details of the air travel market in 9M20 are given below (Figure 16).
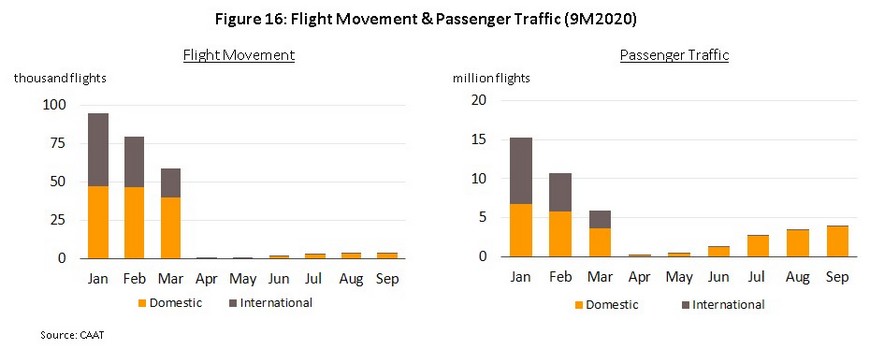
- In the first 9 months of 2020, airlines operated 360,000 flights (-54.7% YoY), split between domestic and international segments as described below.
- About 240,000 domestic flights operated in 9M20, which represents a crash of 41.6% YoY. Between March and October, 110,000 flights were cancelled (-46.2%), but in the 3rd quarter of the year, the domestic segment began to pick up and with over 90% of seat capacity back in service by the end of the period, airline activity returned to close to pre-pandemic levels. In addition, many carriers also increased flight frequency for existing route or added new destinations. Thai AirAsia added flights to Chiang Mai, Phuket, Krabi and Surat Thani, Thai Smile added a new route from Bangkok to Nakhon Si Thammarat, and Thai Vietjet Air offered a new services between Bangkok and Had Yai, Khon Kaen and Nakhon Si Thammarat.
- In the same period, international flights were down 68.8% YoY to around 120,000. Operators started to suspend international flights at the end of March when some countries (e.g., China, South Korea and Japan) started to restrict entry. They eventually ceased most flights by May, except for special repatriation planes and cargo flights using airport services. Following this extensive grounding of planes between March and October, airline traffic fell by 250,000 flights (-80.3%) compared to the original schedule for the period.
Krungsri Research estimates that in 2020, the number of domestic flights fell by 39.8% and international flights by 74.8%.
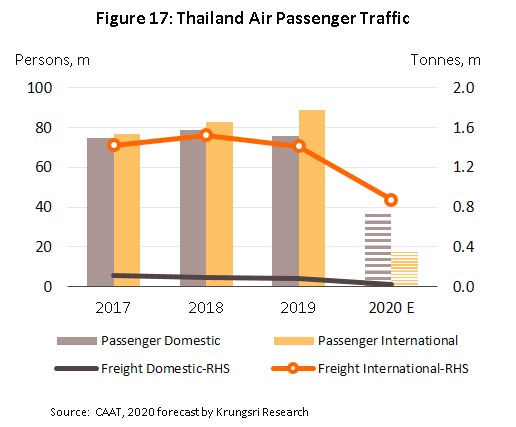
- Passenger numbers also experienced an unprecedented crash, sliding 64.2% YoY to 44.0 million in 9M20. Domestic passenger numbers fell 51.0% to 27.9 million in the period. International passenger numbers fell by a larger quantum, slipping 75.7% to 16.1 million, though this was in line with the 79.5% drop in international tourist arrivals. However, the domestic segment was starting to recover prior to the second COVID-19 outbreak that started in mid-December, helped by government policies such as the ‘We Travel Together’ scheme and the introduction of special or replacement holidays to help players in the tourism sector stay afloat through this difficult time. For full-year 2020, the number of domestic passengers is estimated to have fallen by 50.9%, and international passenger numbers by 79.8% (Figure 17).
- Airfreight also suffered last year but by a smaller degree. The volume of goods transported by air shrank 35.5% YoY to 710,000 tonnes in 9M20, comprising a 58.1% fall in domestic freight (to 25,000 tonnes) and a 34.2% decline in international shipment (to 680,000 tonnes) (Figure 18). The marked difference in the decline in these two segments is explained by international operators’ decision to increase the share of allocated cargo space on passenger planes and allocating cargo space to business partners on special flights. For example, Thai Airways had increased the volume of agricultural and industrial goods that it shipped[8] as well as added flights to meet higher demand to ship goods overseas, including medicines, medical supplies, food and consumer products.
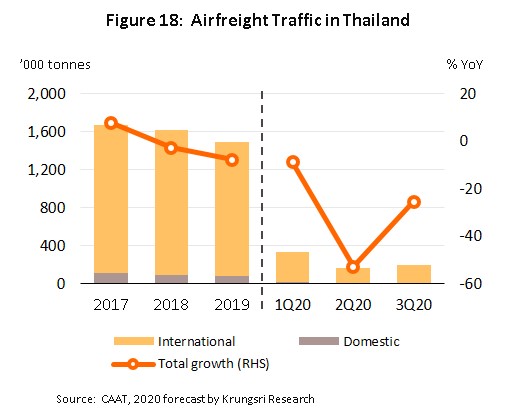
In addition, there are less restrictions on airfreight than passenger arrivals. For example, Lao PDR allows cargo planes into the country and China permits one cargo flight a week. Krungsri Research estimates that for full-year 2020, domestic airfreight tumbled 69.0% but international airfreight would have dropped by only 38.2%.
In 2020, demand for jet fuel (Jet A1) slumped by more than 60% to an average of just 7.3 million liters/day. Consequently, jet fuel prices also dropped to record lows (Figure 19), although this as also partly due to a surge in reserves.
Outlook
In 2021, IATA sees global passenger numbers rising 55.6% to 2.8 billion. And assuming the rollout of vaccination programs goes according to plan, they should return to near pre-COVID levels by 2024. However, airlines would still register an estimated USD38.7 billion losses in 2021, in addition to the THB119 billion in losses racked up in 2020. However, cashflow should improve in 2022-2023. By region, Asia-Pacific, Africa and the Middle East will recover faster than North America and Europe. By segment,
the airfreight market will perform better than passenger services. In 2021, 61.2 million tonnes of cargo is expected to be shipped by air (compared to 54.2 million tonnes in 2020), close to the 61.3 million tonnes moved in 2019.
Krungsri Research forecasts a slow recovery for Thai carriers, especially passenger airlines which activity will only return to 2019 levels in 2024. However, recovery will be supported by the following factors.
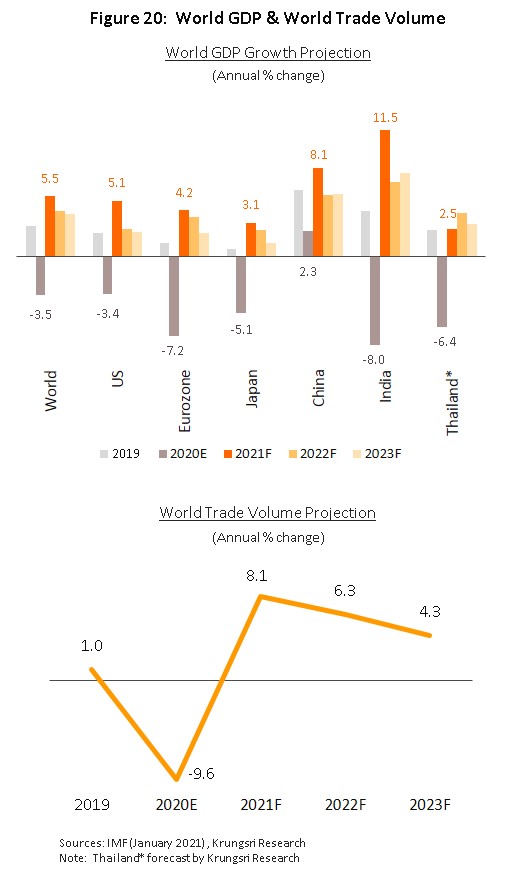
- The world economy is expected to recover strongly in the coming period. Following a contraction of 3.5% in 2020, the IMF forecasts 5.5% and 4.2% growth in 2021 and 2022, respectively. In addition, global trade is forecast to grow at an annual average rate of 6.2% between 2021 and 2023 (Figure 20). The recovery in global manufacturing and trade will lead to greater demand for airfreight services, for example, for agricultural goods and high-value electronic products and equipment.
- The Thai economy is projected to expand by an average rate of 3.0-4.0% per year over the next few years, after shrinking by 6.4% in 2020. Tourist arrivals will recover slowly following the vaccination programs worldwide. Thailand will likely reopen the country to foreign travelers in stages, initially limiting entry to only business travelers, medical tourists, and those from countries with low domestic transmission. Thus, compared to approximately 40 million arrivals in 2019, we project only 4.0 million arrivals in 2021, 11.4 million in 2022, and 26.4 million in 2023.
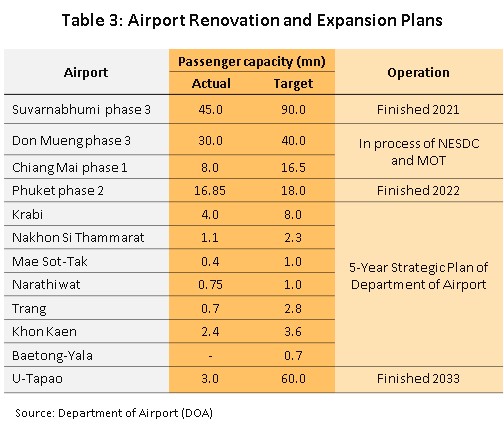
- Other positive factors that could boost demand include: (i) government measures to stimulate and sustain consumer spending and encourage domestic travel, including the ‘Half Each’ and ‘We Travel Together’ programs (until April 2021); (ii) marketing targeted at high-potential groups, such as long-stay visitors, health & wellness tourists, and professional sportsmen; and (iii) plans to upgrade and expand airports across the country to process a larger volume of aircraft, passengers and freight, such as the works at U-Tapao Airport (slated for completion in 2023) (Table 3).
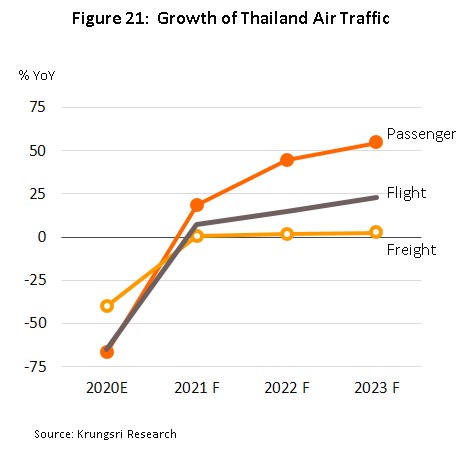
The factors outlined above will encourage demand for air travel and freight services (Figure 21). This will support recovery in the air transport industry from the second half of 2021. Trends for the Thai air transport industry over 2021-2023 are given below.
- The number of flights will pick up in 2022-2023 along with higher passenger numbers. Domestic flight will benefit from plans by several carriers to expand the number of cities that they serve, especially business routes. Bangkok Airways plans to start new services between Bangkok and Had Yai, Khon Kaen and Mae Sot, Thai AirAsia will start flying the Bangkok-Krabi and Bangkok-Surat Thani routes, and new flights operated by Thai Lion Air will link Ubon Ratchathani and Surat Thani. But for international flights, recovery will be slower. The market is only projected to recover to pre-pandemic (2019) levels in 2024.
- Passenger numbers will accelerate in 2022-2023 and by 2024, the market should return to pre-pandemic level of 165 million per year. Krungsri Research expects the domestic market to recover ahead of the international segment, because the former will benefit from shorter distances while the latter will be affected by longer shadows cast by the pandemic and persistent fear of infection. The Tourist Authority of Thailand forecasts 120 million domestic trips in 2021 and 180 million in 2022, with a share of this sharp rise attributable to air travel. In addition, foreign arrivals will start to rise again and over half of these will use domestic air services. Overall, the international segment should recover completely by 2024, by which time international passenger numbers will be back to 2019 levels.
- The volume of all freight moved by air is forecast to increase by 2.0-3.0% annually. The market for domestic airfreight will remain relatively unchanged from the situation in 2019 due to the ongoing development of road and rail infrastructure, which would increase transportation options for shippers and simultaneously reduce transportation costs. By contrast, the international freight market will rebound faster, moving along with improving world trade and the expanding global economy. International airfreight will also be helped by the rising volume of vaccines being shipped and by stronger e-commerce sales that utilize same-day ride-hailing delivery services.
- Cost of jet fuel is expected to remain low, with the EIA forecasting global demand for oil would only return to pre-pandemic levels in 2022. The Thai Energy Policy and Planning Office predicts that consumption of aviation fuel will average 8-11 million liters/day in 2021, compared to 2020 average of 7.3 million liters/day. Hence, Krungsri Research sees commercial demand for jet fuel rising steadily to 19-20 million liters/day by 2023, the level before the first COVID-19 outbreak.
From 2021 to 2023, airlines will face greater challenges arising from: (i) stronger competition from major foreign carriers that are expanding passenger and freight services to Asia, which could force Thai players to review their business models and utilize cabin and hold space more efficiently; (ii) changes to global safety standards for the industry[9] that could increase overheads; (iii) government investment to modernize and expand Thailand’s air transport infrastructure possibly falling behind schedule; and (iv) the need to increase investment in health and safety following the COVID-19 crisis. The net effect of these factors will be to cap profit growth and reduce competitiveness of smaller players.
Krungsri Research view
Over the next 3 years, operators’ earnings will recover slowly. For passenger services, the number of domestic passengers will rebound ahead of international passenger numbers, but growth will be limited by resurgence of COVID-19 cases overseas, uncertainty over when to resume international flights, and the still-fragile Thai and global economies. The industry will also be affected by stronger price competition, especially on domestic routes where fares for passenger and air freight services are controlled. This could force airlines to review their pricing strategies to remain competitive. Nevertheless, the government will continue to help airlines and they would be granted permission to reallocate idle cabin passenger space for cargo. Together, these will help to offset revenues lost due to weak demand for passenger air travel.
- Passenger carriers: In this segment, revenue will rise slowly along with a gradual recovery in air travel to normal levels by 2024. An improving economy will help to lift passenger numbers, and airlines will also be able to generate additional revenue from related activities, such as handling and distributing goods, selling souvenirs and similar items, managing transport systems for passengers and goods, and processing customs charges. In addition, to expand their geographical footprint, players will try to improve their competitiveness by partnering with businesses that operate their own transport or airline networks. But competition will worsen in the industry, especially as players try to cut costs to preserve and expand market share in areas previously occupied by both Thai and overseas airlines. This could increase liquidity risks for some players that could force them to reduce their fleet size.
- Cargo services: Revenue should be flat in this segment, with growth capped by limited space available in cargo flights, though this would be a major problem mainly for small aircraft operators which generally face greater financial constraints. Players in this segment also have to face greater competition from passenger carriers that are now also moving cargo, and because they are normally larger and better able to manage their hold space, there is greater risk of airfreight operators experiencing liquidity problems. However, players will benefit from the recovery in manufacturing and trade, increasing trend for businesses to relocate production facilities to Thailand, growth in e-commerce, and the possibility of partnering with other freight forwarders that serve an established customer base. Given the balance of influences on the segment, airfreight companies should see revenues returning to pre-pandemic levels.
[1] 290 airlines are members of the International Air Transport Association (IATA). These members carry 82% of global air traffic, and from their data, IATA states that over the 5 years from 2012-2017, there were an average of 75 incidents annually, which then dropped to 62 in 2018, while in terms of loss of life, air travel remains significantly safer than other types of travel (i.e., cars, buses, motorcycles, trains and boats).
[2] Airlines often reduce the risk of being adversely affected by price spikes by hedging against fluctuations in the jet fuel price.
[3] Air transport operators are of two types: (i) those that have an air operator’s license and that own or lease their own aircraft for use on regular flights; and (ii) those that do not operate their own flights but instead act as agents for those that do, selling space in aircraft holds on to third parties.
[4] This is calculated from the cost per available seat kilometers (CASK), which is obtained by taking the total operating costs and dividing this by the total number of seats multiplied by the distance travelled (the ‘available seat kilometers’, or ASK).
[5] These two sites are operated by Airports of Thailand (AOT), which manages a total of 6 airports in Thailand.
[6] Source: Civil Aviation Authority of Thailand
[7] Source: Department of Business Development
[8] Noted by Deputy Minister of Transport Thaworn Senniam following an inspection of Thai Airways warehouses at Suvarnabhumi Airport, April 16, 2020.
[9] These have been stipulated by the International Civil Aviation Organization and include the need to address significant safety concerns (SSCs), checking the full ICAO coordinated validation mission (Full-ICVM), and carrying out the Federal Aviation Administration’s international aviation safety assessment (IASA). Carriers operating in Europe also need to meet the safety certification standards set by the European Union Aviation Safety Agency (EASA).


.webp.aspx)