EXECUTIVE SUMMARY
The Thai canned seafood industry is expected to continue expanding at a low rate from 2025 to 2027. Production volume is projected to grow by an average of 1.0-2.0% per year. Meanwhile, Domestic consumption volume is anticipated to remain stable at an average growth rate of 0.0-1.0% per year, aligning with weak purchasing power stemming from economic uncertainties, and intense competition from a wide variety of other food products available at attractive prices. This is despite supporting factors such as the development of new products that cater to the niche demands of modern consumers. Regarding export volume, growth is expected to be only 1.8-2.8% per year, pressured by US tariff measures that could impact exports, particularly in the latter half of 2025 and throughout 2026, following accelerated inventory accumulation in the first half of 2025. However, factors that continue to support export growth include: 1) Thailand's advantage in production scale, which keeps the export prices of Thai canned tuna competitive compared to some rivals; 2) Product quality recognition and safety standards, especially in the Halal market; and 3) Expansion into new markets with good growth potential in the Middle East, Latin America, Africa, and ASEAN countries.
Krungsri Research view
The outlook for Thailand's canned seafood industry from 2025-2027 is projected to see moderate growth. The domestic market is expected to remain stable, while export markets may be affected by the U.S. tariff hike amid intensifying global competition. This competition is driven by market expansion from competitor countries that benefit from trade agreements or lower production costs, such as China, Ecuador, Vietnam, Mexico, and Indonesia. These challenging factors could impact producers' revenue and profitability.
Producers of canned seafood: Revenues are expected to continue growing at a gradual pace, pressured by increasing challenges. This includes a slowdown in the domestic market amid economic uncertainties and a slowly recovering tourism sector. Meanwhile, exports will face risks from US tariff policies, since the US is a major market. Businesses with the potential for profitability will be those capable of expanding into markets that are still growing, particularly the Middle Eastern market, which recognizes the quality of Thai products under Halal standards. It is projected that export volumes of canned and prepared/preserved fish products will grow by an average of only 2.1-3.1% per year. In contrast, canned and prepared/preserved other seafood products (excluding fish) are expected to contract by an average of -0.6% to -1.6% per year.
Overview
Global canned and prepared/preserved seafood products1/ industry
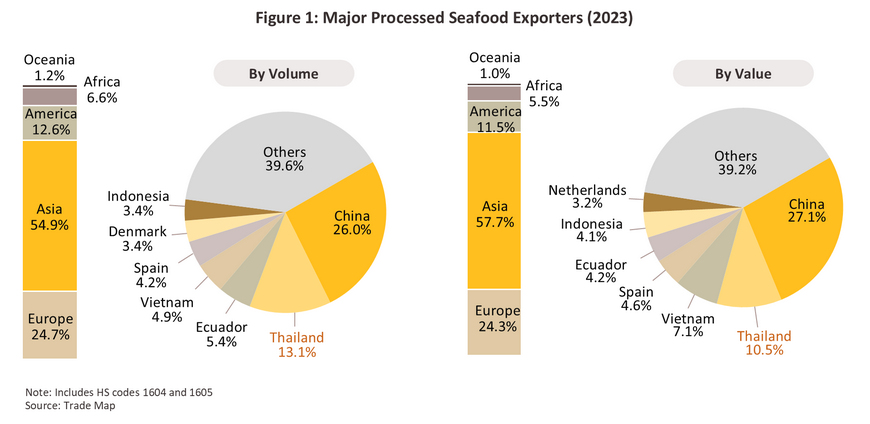
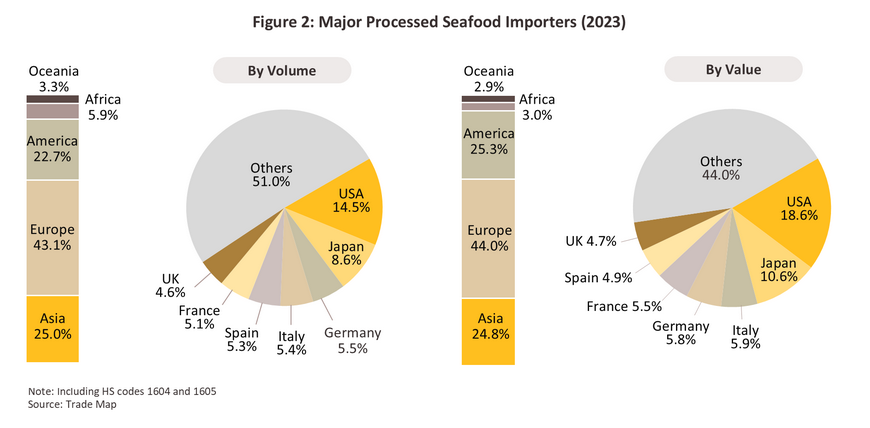
In 2023, the global export volume of canned and prepared/preserved seafood products reached 5.3 million tons, valued at USD 33 billion. China was the leading exporter, accounting for 26.0% of the world's canned and prepared/preserved seafood export volume, followed by Thailand (13.1%), Ecuador (5.4%), Vietnam (4.9%), and Spain (4.2%), respectively (Figure 1). On the import side, the United States was the main importer, making up 14.5% of the world's canned and prepared/preserved seafood import volume. It was followed by Japan (8.6%), Germany (5.5%), Italy (5.4%), and Spain (5.3%), respectively (Figure 2).
Key canned and prepared/preserved seafood products include:
-
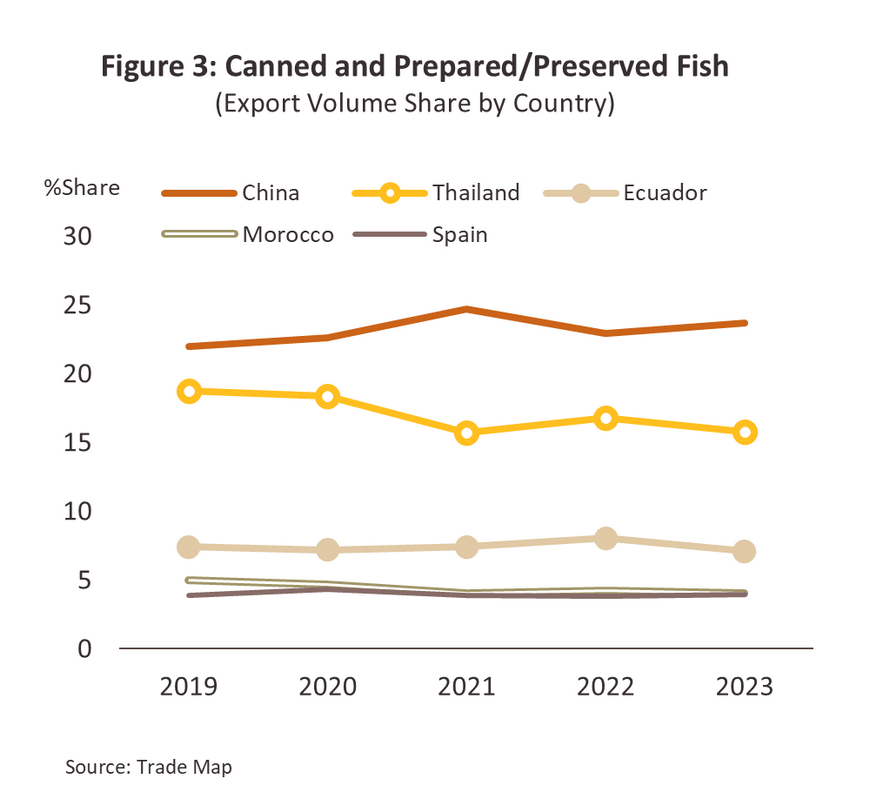
Canned and Prepared/Preserved Fish Products2/: In 2023, the global export volume of canned and prepared/preserved fish products was 4.0 million tons, valued at USD 20 billion. This represented 75.2% of the total volume and 60.6% of the total value of global canned and prepared/preserved seafood exports. The average export price was USD 4,991.4 per ton. China was the leading exporter, accounting for 23.7% of the global export volume of canned and prepared/preserved fish products, followed by Thailand (15.8%), Ecuador (7.1%), Morocco (4.0%), and Spain (4.0%) (Figure 3). The United States was the main importer, accounting for 11.1% of the global import volume of canned and prepared/preserved fish products, followed by Japan (7.1%), Italy (6.3%), Germany (6.2%), and France (5.8%), respectively. The world's main export products within this category are:
-
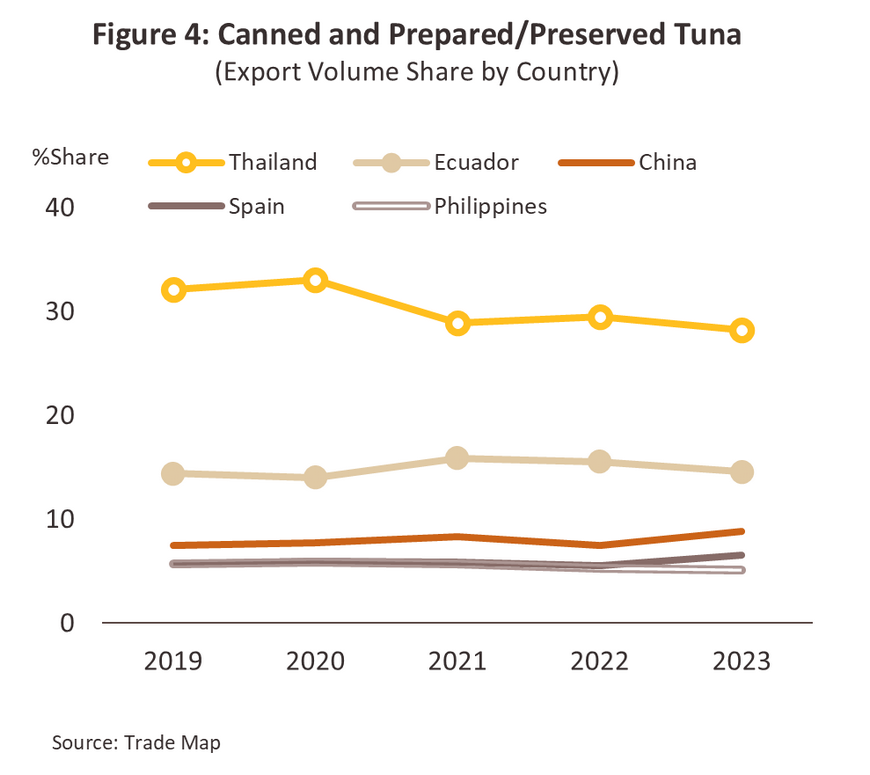
Canned and prepared/preserved tuna products3/: The export volume reached 1.6 million tons in 2023, representing 39.5% of the global export volume of canned and prepared/preserved fish products. Thailand was the leading exporter, accounting for 28.2% of the global export volume of canned and prepared/preserved tuna products, followed by Ecuador (14.6%), China (8.8%), Spain (6.6%), and the Philippines (5.1%) (Figure 4).
-
Canned and prepared/preserved other fish products, whole or in pieces4/: The export volume was 0.7 million tons, accounting for 18.6% of the global export volume of canned and prepared/preserved fish products. China was the leading exporter, with over 53.8% of the global export volume of this category, followed by Germany (13.4%) and Poland (7.0%).
-
Prepared fish products5/ (e.g., fish sausages, fish balls, fish roe): The export volume was 0.6 million tons, representing 15.7% of the global export volume of canned and prepared/preserved fish products. China was the leading exporter, with 22.3% of the global export volume of prepared fish products, followed by Thailand (13.4%), Lithuania (6.9%), Spain (6.3%), and Malaysia (4.6%)
-
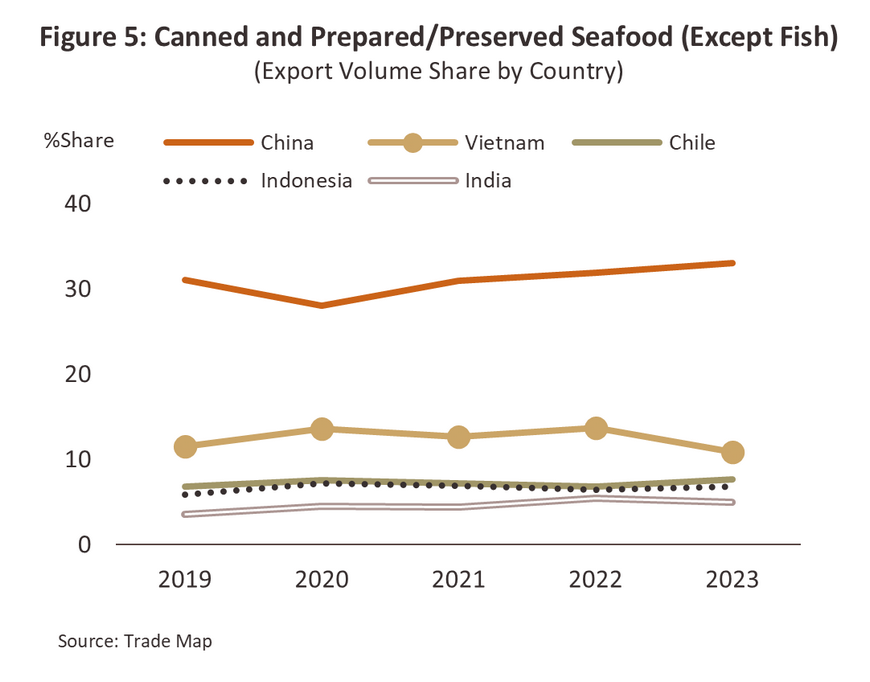
Other canned and prepared/preserved seafood products (excluding fish)6/: In 2023, the global export volume of other canned and prepared/preserved seafood products (excluding fish) reached 1.3 million tons, valued at USD 13 billion. This accounted for 24.8% of the total volume and 39.4% of the total value of global canned and prepared/preserved seafood exports. The average export price was USD 9,817 per ton. China was the main exporter of other canned and prepared/preserved seafood products (excluding fish), with a 33.1% share of the export volume, followed by Vietnam (10.9%), Chile (7.7%), Indonesia (6.8%), and India (5.0%) (Figure 5). On the import side, the United States was the primary importer, accounting for 23.9% of the global import volume of other canned and prepared/preserved seafood products (excluding fish). It was followed by Japan (13.0%), South Korea (7.6%), China (5.0%), and Spain (4.2%), respectively. The main global export products within this category are:
-
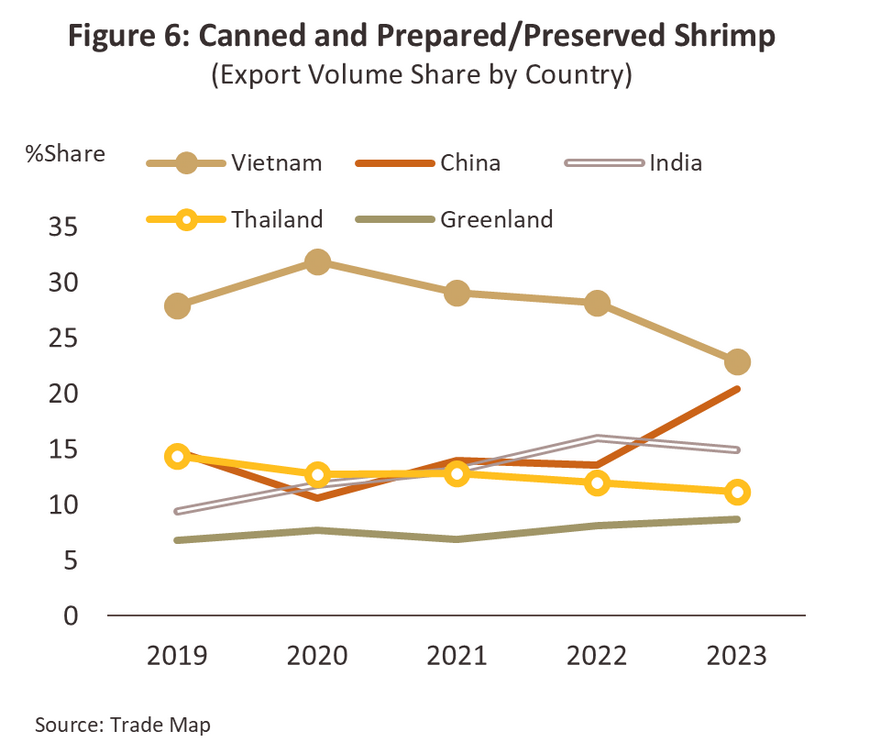
Canned and prepared/preserved shrimp products7/: The export volume was 0.3 hundred thousand tons, representing 26.1% of the global export volume of other canned and prepared/preserved seafood products (excluding fish). Vietnam was the leading exporter, accounting for 22.9% of the global export volume of canned and prepared/preserved shrimp products, followed by China (20.4%), India (14.9%), Thailand (11.2%), and Greenland (8.7%) (Figure 6).
-
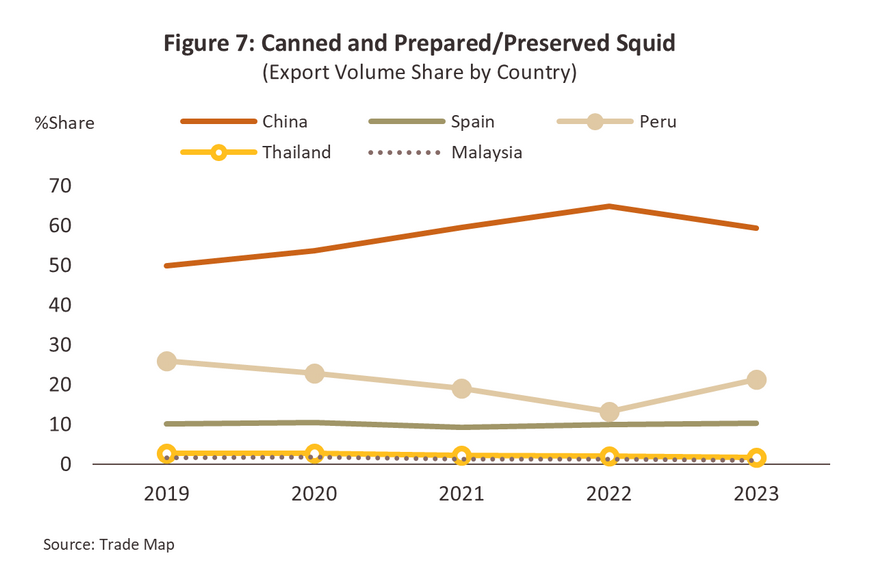
Canned and prepared/preserved squid products8/: The export volume was 0.3 hundred thousand tons, representing 24.2% of the global export volume of other canned and prepared/preserved seafood products (excluding fish). China held the largest share at 59.4% of the global export volume of canned and prepared/preserved squid products, followed by Peru (21.4%) and Spain (10.2%) (Figure 7).
-
Non-canned prepared/preserved shrimp products9/: The export volume of was 0.2 hundred thousand tons, accounting for 15.8% of the global export volume of other canned and prepared/preserved seafood products (excluding fish). Indonesia was the top exporter, with 24.2% of the global export volume of non-canned prepared/preserved shrimp products, followed by Vietnam (15.9%), China (10.1%), Thailand (7.3%), and India (5.3%)
The canned and prepared/preserved seafood industry in Thailand
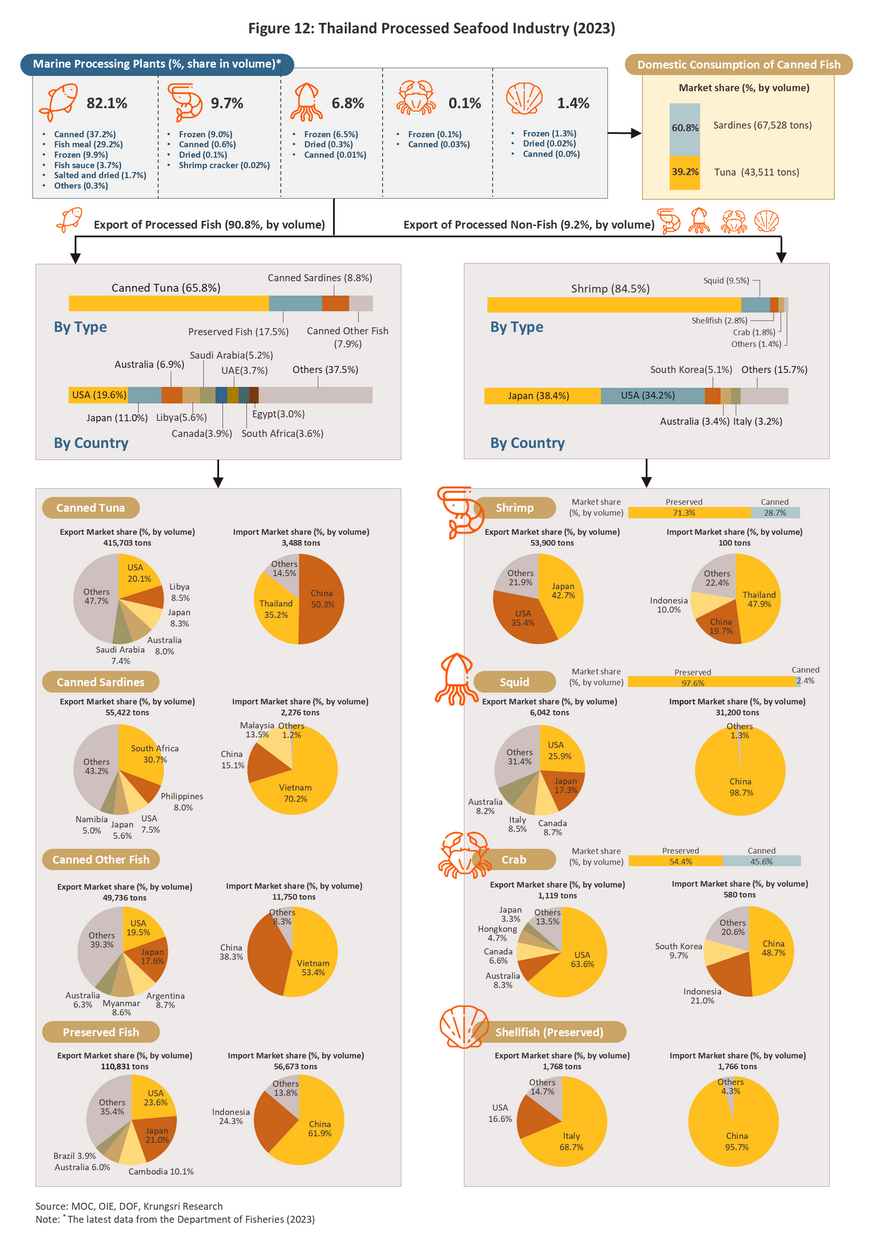
A survey of fishery business statistics for 2023 by the Department of Fisheries found that the total number of all marine animal processing factories in Thailand was 1,262 factories, an increase of 5.3%. The most numerous types of factories were salted fish factories, numbering 482, which accounted for 38.2% of all marine animal processing factories in Thailand. In contrast, canned aquatic animal factories numbered only 47, making up just 3.7%.
-
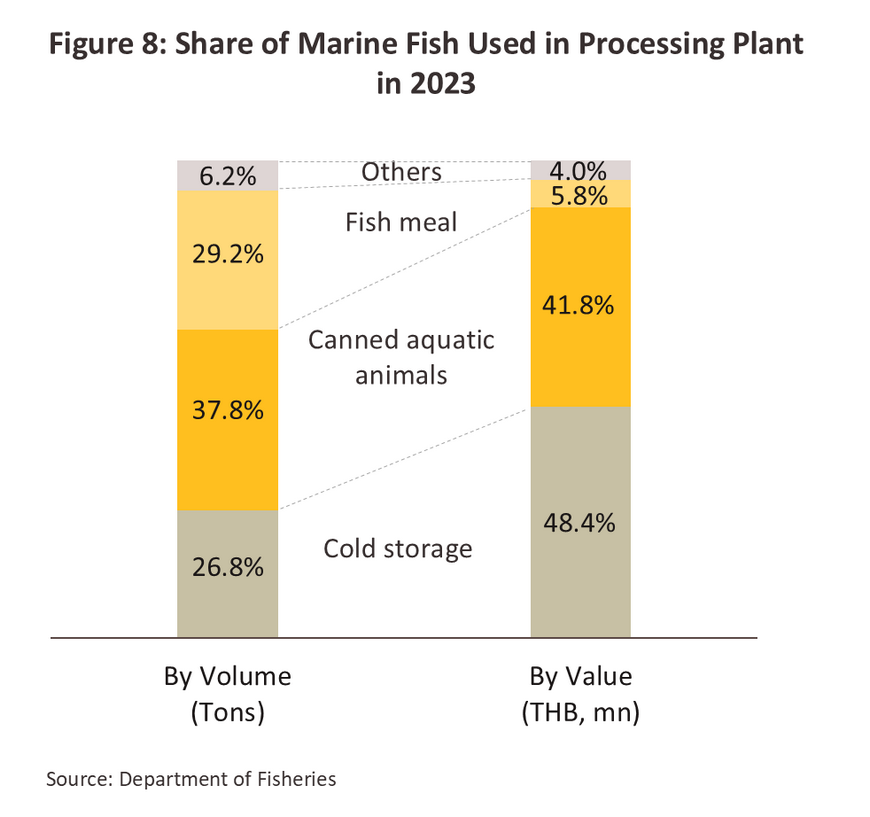
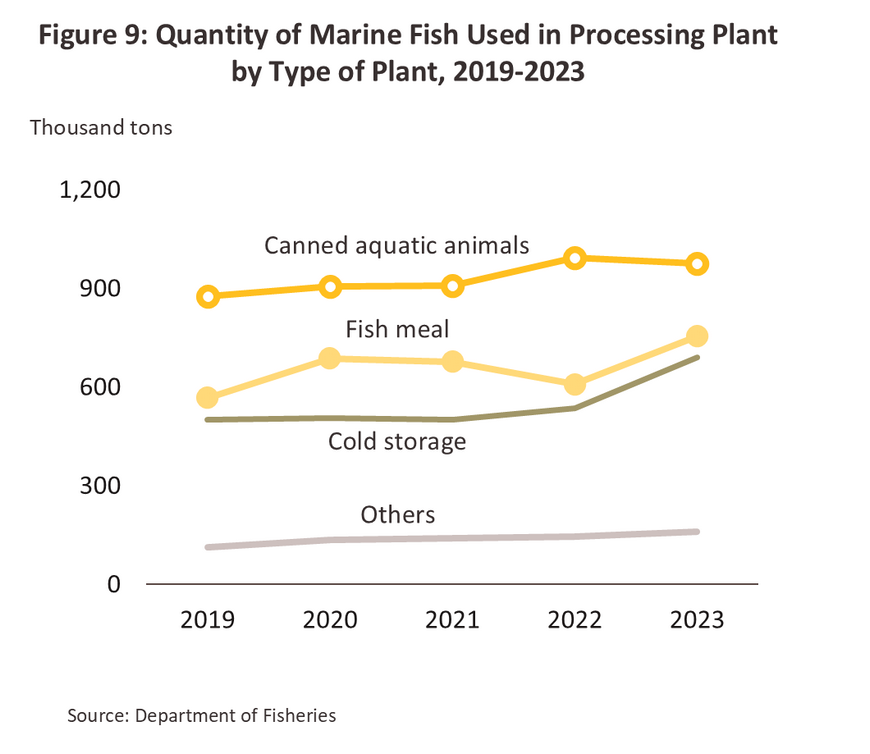
In terms of the volume of marine animals used in factories, Thailand processed a total of 2.6 million tons of marine animals in 2023, an increase of 0.3 million tons from 2022, or a growth of 13.1%. Canned marine animal factories accounted for the highest share of marine animal usage, at 0.98 million tons, representing 37.8% of the total marine animal volume used in all processing factories. This was followed by fishmeal factories with 0.75 million tons (29.2%) and cold storage factories with 0.69 million tons (26.8%), respectively (Figures 8-9).
-
Considering value, the marine animals used in marine animal processing factories in 2023 were valued at THB 120 billion, an increase of THB 22 billion, or 23.1% growth from the previous year. Cold storage factories had the highest value of marine animals used, at THB 58 billion, accounting for 48.4% of the total value of marine animals used in all processing factories. This was followed by canned marine animal factories at THB 50 billion (41.8%) and fishmeal factories at THB 7 billion (5.8%), respectively (Figure 8).
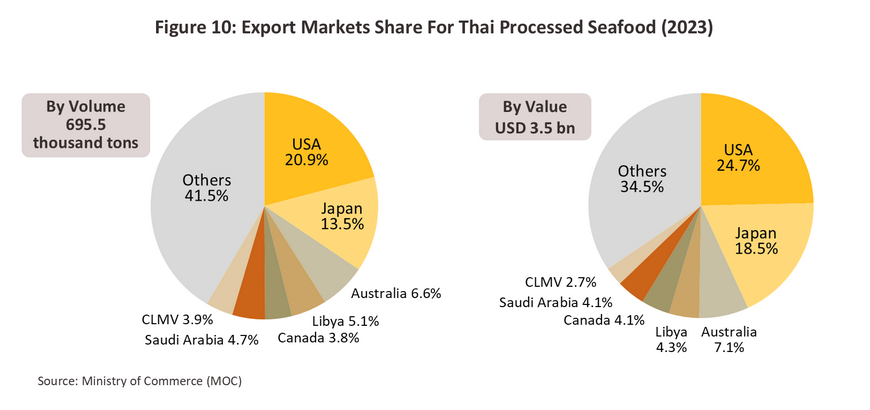
In 2023, Thailand exported a total of 695.5 thousand tons of canned and prepared/preserved seafood products, valued at USD 3.5 billion, or THB 120 billion (Figure 10). Thailand holds a relatively high competitive potential in the global market for processed fish and shrimp products, accounting for 13.1% of the total global export volume of canned and prepared/preserved seafood products. Although some of the raw materials for aquatic animals come from Thai fishing vessels, they are still insufficient to meet the demand of the canned and prepared/preserved seafood industry. This requires Thailand to import raw aquatic materials for processing, with most being fresh, chilled, or frozen tuna mainly imported from Taiwan (17.1% share). This is followed by fresh, chilled, or frozen fish, including livers and roe, predominantly from the European Free Trade Association or EFTA (26.9% share). As for shrimp raw materials, most originate from domestic aquaculture, while crabs (mainly blue crabs) primarily come from Thai fishing vessels. Thailand's key export markets are presented as follows.
Thai canned and prepared/preserved seafood products are categorized into two main groups:
-
Canned and prepared/preserved fish products: In 2023, the export volume of canned and prepared/preserved fish products was 631.7 thousand tons, valued at USD 2.8 billion. This represents 90.8% of the total volume and 80.7% of the total value of all canned and prepared/preserved seafood exports. The primary market was the United States, accounting for 19.6% of Thailand's canned and prepared/preserved fish export volume. This was followed by Japan (11.0%), Australia (6.9%), Libya (5.6%), and Saudi Arabia (5.2%). The main export products in this category are canned fish, which hold the highest export share. Key canned fish products include:
-
Canned Tuna: Production volume reached 513.3 thousand tons, accounting for 80.1% of total canned fish production. The main raw material is imported from Taiwan (17.1% share of Thailand's fresh, chilled, or frozen tuna imports), followed by Nauru (15.3%) and South Korea (10.5%). Sales volume was 459.4 thousand tons, representing 78.2% of total canned fish sales. Domestic consumption accounted for 43.7 thousand tons, or 39.3% of domestic canned fish sales. The remaining 415.7 thousand tons were exported, accounting for 88.2% of canned fish export volume, with an export value of USD 1.9 billion. The primary market is the United States, with a 20.1% share of Thailand's canned tuna export volume, followed by Libya (8.5%), Japan (8.3%), Australia (8.0%), and Saudi Arabia (7.4%).
-
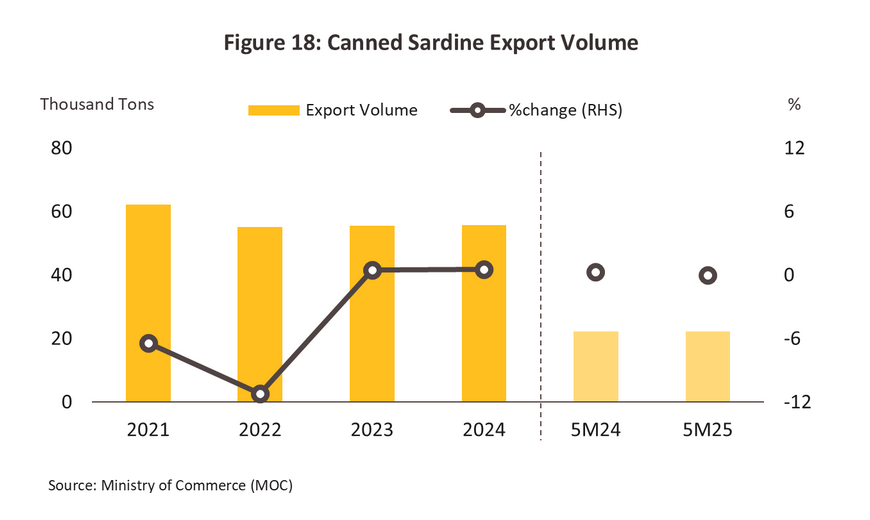
Canned Sardines: Production volume was 127.7 thousand tons, representing 19.9% of total canned fish production. Most raw material imports primarily from Japan, accounting for 45.3% of Thailand's sardine import volume, followed by Russia (36.8%) and Myanmar (5.9%). Sales volume reached 122.9 thousand tons, comprising 21.8% of Thailand's total canned fish sales. This was split into 67.5 thousand tons for domestic consumption (60.7% of domestic canned fish total sales volume), with the remaining 55.4 thousand tons exported. This export volume represented 11.8% of the total and was valued at USD 144.2 million. The main markets included South Africa (30.7% of Thailand's canned sardine export volume), followed by CLMV (10.8%), the Philippines (8.0%), the United States (7.5%), and Japan (5.6%), respectively.
-
Other canned and prepared/preserved seafood products (excluding fish): The export volume reached 63.8 thousand tons in 2023, valued at USD 668.7 million. This constitutes 9.2% of the total volume and 19.3% of the total value of all canned and prepared/preserved seafood exports. The primary market for these products is Japan, accounting for 38.4% of Thailand's export volume. This is followed by the United States (34.2%), South Korea (5.1%), Australia (3.4%), and Italy (3.2%). Key products within this category include canned and prepared/preserved shrimp, with an export volume of 53.9 thousand tons, representing 84.5% of Thailand's total export of other canned and prepared/preserved seafood (excluding fish). This is followed by canned and prepared/preserved squid (9.5%), shellfish (2.8%), crabs (1.8%), and other products (1.4%).
Situation
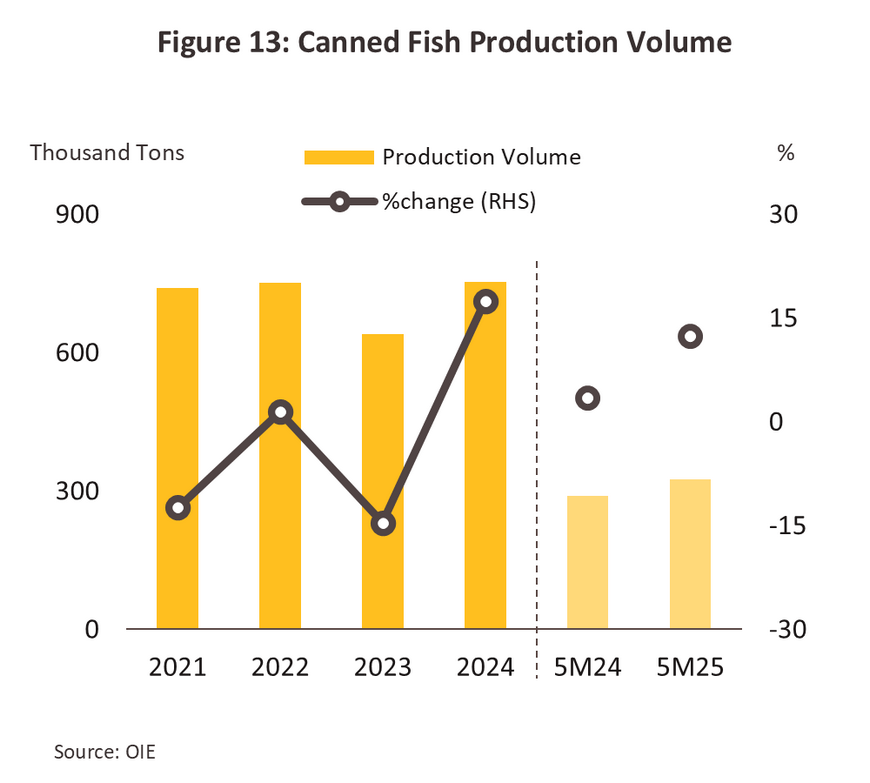
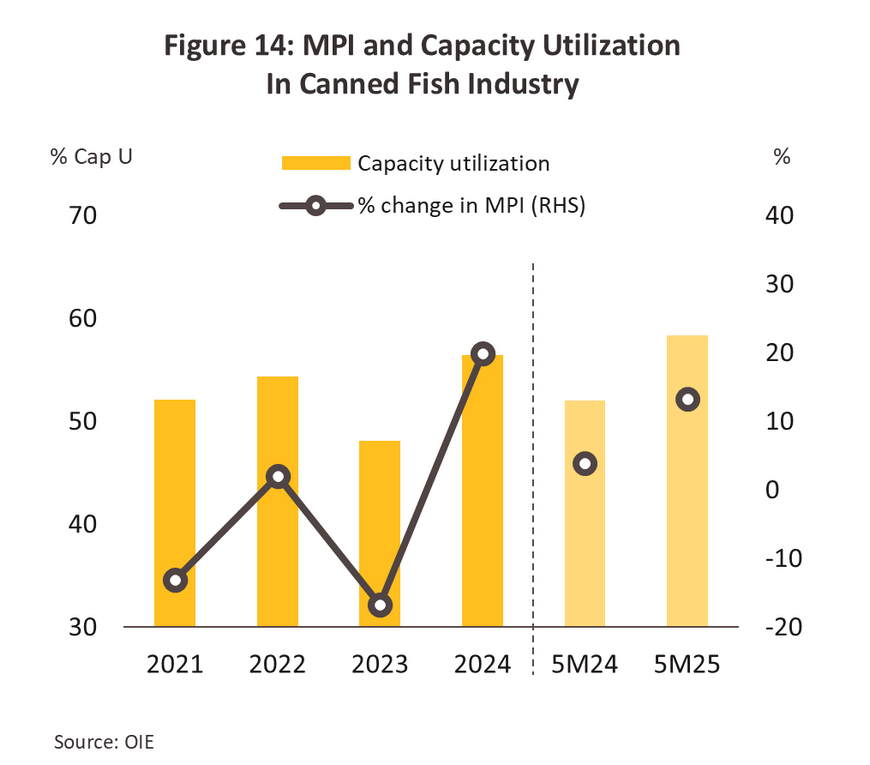
Production volume in 2024 stood at 752.9 thousand tons, an increase of 17.5% (Figure 13). This aligns with the production index for this product group, which rose to 101.9 from 85.0 in 2023, representing a 19.8% expansion. This supported an increase in the capacity utilization rate from 48.1% in 2023 to 56.5% in 2024 (Figure 14). In 5M25, canned fish production volume reached 324.4 thousand tons (+12.3% YoY). Products can be categorized as follows:
-
Production volume of canned tuna reached 630.5 thousand tons, marking a 22.8% increase. This rise was primarily driven by: 1) Increased tuna catch in Thai waters from commercial fishing, totaling 71,734 tons, up by 15.6% compared to 202310/. The species caught included skipjack tuna (33.1%), black skipjack tuna (30.5%), longtail tuna (22.3%), yellowfin tuna (8.4%), and other fish (5.7%), 2) Recovering demand in international markets (exports account for over 90% of production volume). This recovery comes from both major trading partners and emerging markets in the Middle East, as economic activities and purchasing power gradually improve, 3) Demand for raw materials from the pet food industry, which continues to grow both domestically and internationally. This is especially true for the premium pet food segment, which prefers high-quality ingredients like tuna meat, further boosting global demand for canned tuna. This upward trend in canned tuna production continued in 5M25, with volume increasing by 14.2% YoY to 268.7 thousand tons.
-
The production volume of canned sardines was 122.4 thousand tons, a decrease of -4.1%. This decline stemmed from a supply shortage of raw materials, a consequence of historical overfishing from which stocks have yet to fully recover. The El Niño phenomenon exacerbated this, altering sea temperatures and currents, leading to a reduced sardine catch. Additionally, consumers have increasingly shifted towards canned mackerel, partly due to its lower price and denser fish meat. However, in 5M25, canned sardine production saw a 3.9% YoY increase, reaching 55.7 thousand tons. This recovery was a result of improving raw material supply, enabling operators to boost production to meet domestic demand for more affordably priced canned fish, alongside the effect of a lower base in the preceding period.
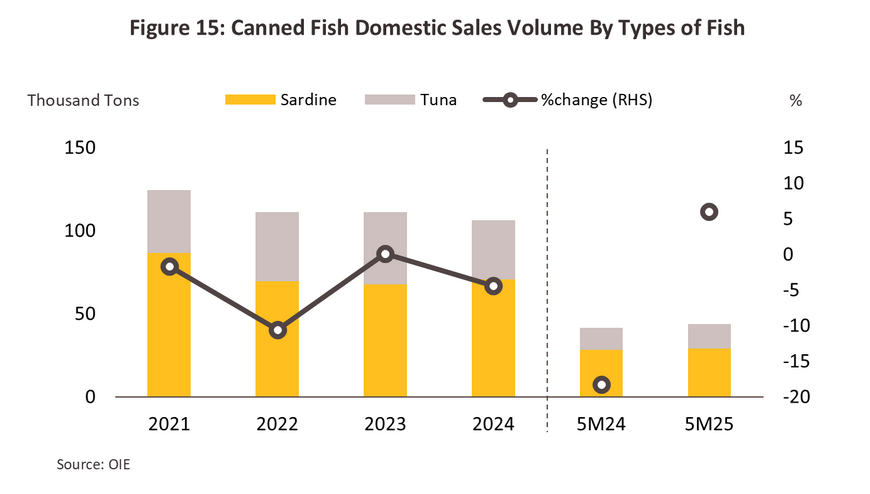
Domestic consumption in 2024 stood at 106.4 thousand tons, a decrease of -4.4%. This can be divided into canned tuna consumption at 35.6 thousand tons, a decrease of -18.5%. This is due to the higher price of canned tuna compared to sardines, leading some consumers to choose cheaper alternative products amidst high living costs, such as sardines, mackerel, or other types of meat. Meanwhile, canned sardine consumption was at 70.8 thousand tons, expanding by 4.8%. In addition to attractive pricing, this growth was partly a result of marketing strategy adjustments by producers, such as product development or packaging redesigns to better meet consumer needs. For 5M25, total domestic canned fish consumption was 43.9 thousand tons (+6.0% YoY) (Figure 15), divided into canned tuna at 14.8 thousand tons (+14.2% YoY) and canned sardines at 29.1 thousand tons (+2.3% YoY). This is attributed to increasing economic uncertainty, some consumers have begun shifting back to more affordable, storable, and protein-rich food options, —such as canned tuna and sardines—as an alternative to dining out.
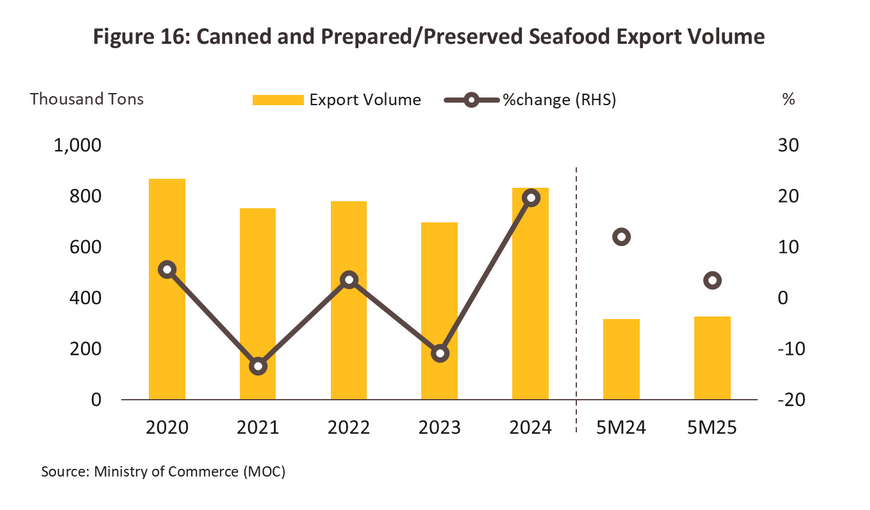
In 2024, Thailand's export volume of canned and prepared/preserved fish and seafood products reached 833 thousand tons (+19.7%), or an equivalent value of USD 3.8 billion (+10.7%). The primary market was the United States, accounting for 20.7% of Thailand's canned and prepared/preserved fish product export volume, followed by Japan (10.5%), Australia (6.3%), Libya (4.9%), and Egypt (4.8%). This growth was mainly driven by the demand for canned tuna and prepared/preserved fish products, as they are essential consumer goods in key export markets. Additionally, the quality and taste of Thai products have gained continuous acceptance. For 5M25, Thailand's export volume of canned and prepared/preserved fish products continued to expand, reaching 327.9 thousand tons (+3.4% YoY). The main market remained the United States, accounting for 22.0% of Thailand's canned and preserved fish product export volume, followed by Japan (10.8%), Libya (6.8%), Australia (6.3%), and Egypt (4.7%) (Figure 16). The main product categories can be divided as follows.
-
Canned and prepared/preserved fish products had an export volume of 771 thousand tons (+22.0%) in 2024, or an equivalent value of USD 3.2 billion (+14.7%). The primary driver was the expansion in export volume of canned tuna products, which remain popular among key trading partners due to their recognized quality and competitive pricing, particularly during a period when consumer purchasing power is only beginning to recover. These factors continued to support Thailand's export volume of canned and prepared/preserved fish products, which reached 304.5 thousand tons (+3.5% YoY) during 5M25. The products can be categorized as follows:
-
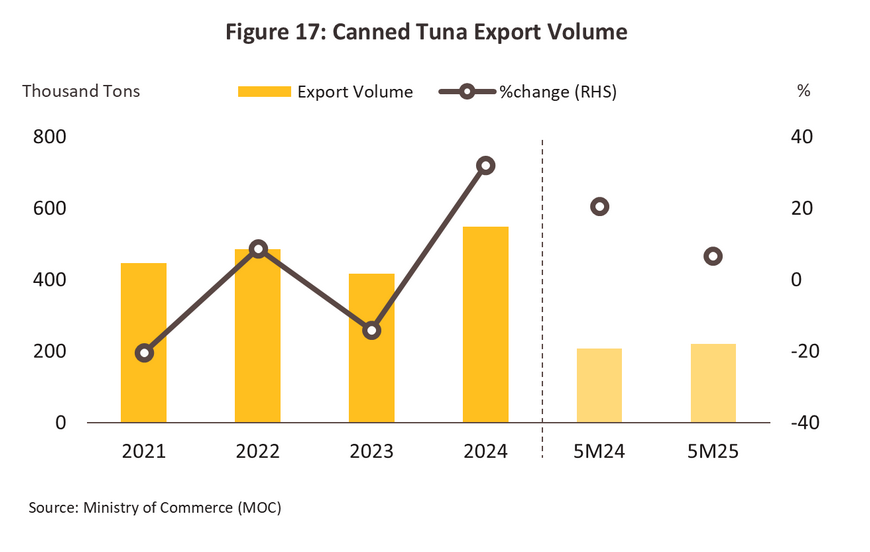
Canned Tuna (accounting for 71.2% of total export volume of canned and prepared/preserved fish products) saw an export volume of 548.7 thousand tons (+32.0%), or an equivalent value of USD 2.3 billion (+21.8%). The export volume expanded well in key partner countries such as the United States (+26.9%) and Australia (+17.7%), reflecting a gradual recovery in purchasing power as pressures from inflation began to ease. Similarly, the export volume to new markets in the Middle East showed good growth. This is partly due to concerns over food security amidst ongoing conflicts and geopolitical uncertainties, leading countries in the region to increase their demand for long-lasting food products, including Israel (+97.2%), the United Arab Emirates (+45.9%), Egypt (+112.9%), and Lebanon (+78.2%). For 5M2025, Thailand's canned tuna export volume remained on a growth trajectory, reaching 220.6 thousand tons (+6.5% YoY) (Figure 17). Notably, export volume from Thailand to the United States, a key market, grew by +19.4% YoY. This was partly driven by front-loaded demand, as buyers stocked up before new US import tariffs took effect. Thai products also benefit from a strong reputation as a producer of high-quality tuna meeting international standards. Additionally, the ability of Thai producers to adapt tastes, packaging, and marketing strategies to align with consumer needs in each market has continuously supported this growth.
-
Canned Sardines (accounting for 7.2% of total export volume of canned and prepared/preserved fish products) had an export volume of 55.7 thousand tons (+0.5%), or a value of USD 142.2 million (-1.4%). Thailand's export volume to its main market, South Africa, which accounts for one-third of Thailand's canned sardine exports, still expanded by +9.3%. Other key trading partners, such as the United States (+8.7%), Cambodia (+11.5%), Namibia (+27.5%), and Australia (+122.2%), also continued to grow. However, the main drag on growth came from the Japanese (-17.2%), Lao (-30.9%), Malaysian (-40.5%), and Philippine (-89.5%) markets, which collectively accounted for 9.3% of total canned sardine exports from Thailand. This was due to consumers in these countries shifting towards canned tuna and some turning to import canned sardines from other countries, particularly China and Morocco, which have cost advantages in both raw materials and labor. For 5M25, Thailand's canned sardine export volume was 22.2 thousand tons (-0.1% YoY). This was primarily dampened by a decrease in overall demand due to economic conditions, including in the key market of South Africa (Figure 18).
-
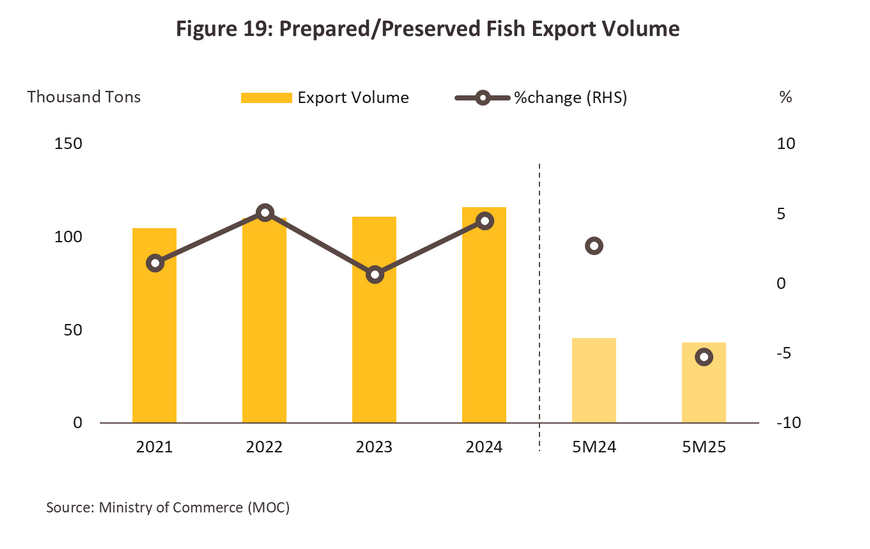
Prepared/preserved fish (accounting for 15.0% of total export volume of canned and prepared/preserved fish products) had an export volume of 115.8 thousand tons (+4.5%), or a value of USD 511.7 million (-1.0%). Key markets such as the United States (+12.5%) continued to expand, as did Cambodia (+22.6%) and China (+22.5%), driven by the recovery of economic activities and the food service sector, supporting lifestyles that demand convenience and speed. However, export volumes to Japan and Australia decreased by -13.8% and -7.1%, respectively. This was due to consumers shifting their interest towards canned tuna, which is high in protein and low in fat, and some turning to imports from other trading partners who have a price advantage due to lower costs than Thailand. For 5M25, Thailand's export volume of prepared/preserved fish was 43.1 thousand tons (-5.3% YoY), following decreases in export volumes to Japan (-3.7% YoY) and the United States (-3.7% YoY) (Figure 19).
-
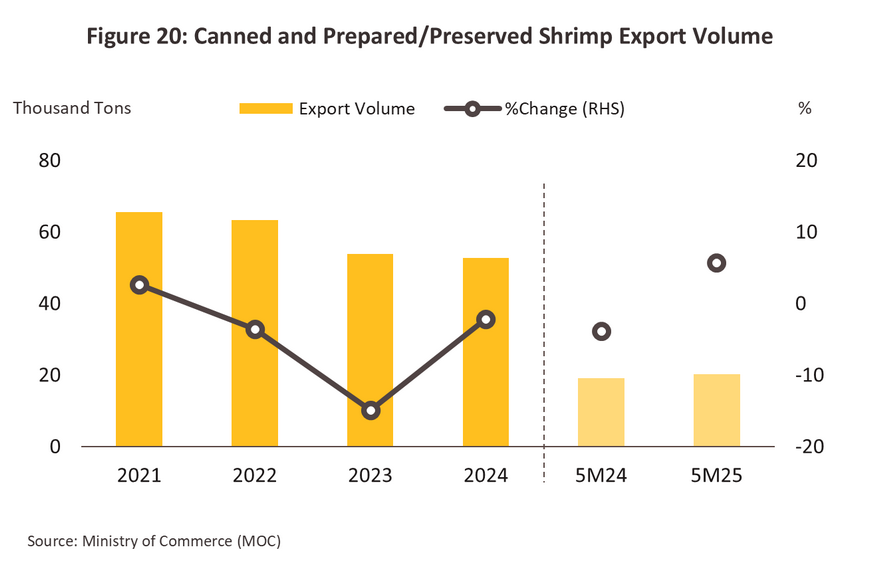
Canned and prepared/preserved other seafood products (excluding fish) had an export volume at 61.7 thousand tons (-3.2%) or valued at USD 626.5 million (-6.3%) in 2024. The primary drag came from the contraction in the export volume of canned and prepared/preserved shrimp products, which are the main export item in this category, accounting for over 85.4% of the total. Exports to key markets, such as Japan (-3.1%) and the United States (-6.7%), continued to contract, due to an increased preference for canned tuna. These two countries together account for over 76% of the export market for this product category. Additionally, the volume of shrimp produced in Thailand has significantly decreased due to disease outbreaks in shrimp farms, leading to production losses for farmers and an inability to supply raw materials to processing plants. For 5M25, Thailand's export volume of canned and prepared/preserved shrimp products was 20.2 thousand tons (+5.6% YoY) (Figure 20). This growth was driven by a rebound in demand from the United States (+15.5% YoY in volume), partly a result of front-loaded demand as buyers stocked up before new US import tariffs came into effect.
Outlook
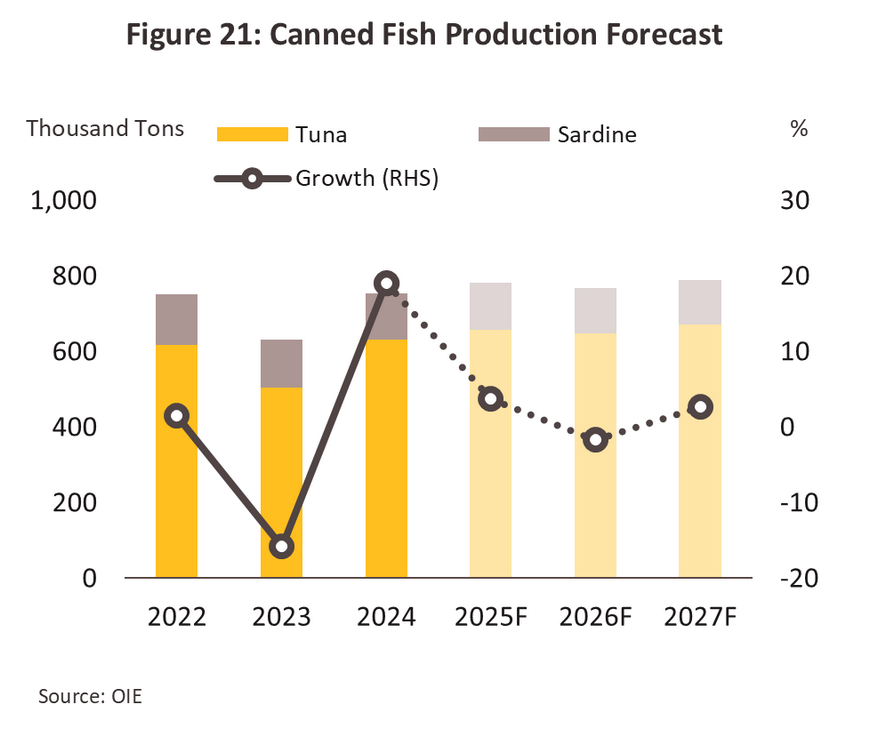
The production volume of canned fish products is projected to show limited increasing in growth, averaging only 1.0-2.0% per year from 2025 to 2027 (Figure 21). This is due to: (1) Direct impacts from US import tariff, as the United States is Thailand's main export market for nearly all products in this industry. (2) Supply constraints stemming from issues such as overfishing and climate conditions, particularly rising sea temperatures, which affect the growth and reproduction of marine life. Additionally, government-imposed catch quotas are leading to a reduction in the volume of fish caught. However, factors that will still support slight growth include: (1) Production to meet increasing demand for food security, which is anticipated to rise due to ongoing geopolitical tensions. Furthermore, uncertain economic conditions are prompting middle-to-lower income consumers in both domestic and export markets to choose affordable and storable food options. (2) Supply-side factors from capacity enhancement and production process efficiency improvements by Thai exporters, combined with greater diversification of raw material sourcing, have helped ensure production continuity and better control over raw material costs. The production volume of canned tuna products is expected to expand by 1.6-2.6% per year, while canned sardine products are projected to contract by -0.8% to -1.8% per year.
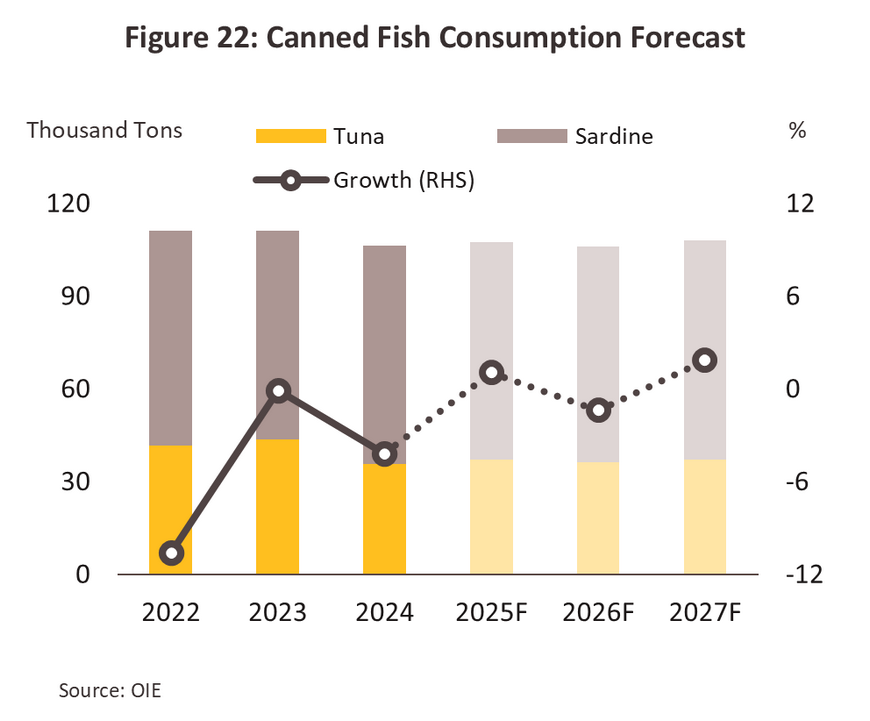
Domestic consumption of canned fish products is expected to remain stable from 2025 to 2027, with an average growth of only 0.0-1.0% per year (Figure 22). This trend is in line with the anticipated weak purchasing power due to economic uncertainties and the slow recovery of the tourism sector. Furthermore, there is competitive pressure from diverse alternative food categories, including fresh food, frozen food, and other ready-to-eat products at attractive prices, providing consumers with more choices, particularly in the canned sardine market which targets lower- to middle-income consumers— a segment expected to be significantly affected. However, factors that will continue to support overall consumption growth include: (1) Demand for easily accessible, cost-effective, and long-lasting low-fat protein sources, which suits today's fast-paced lifestyles. Canned fish is convenient to consume and can be incorporated into various dishes with other ingredients. (2) Development of new product that cater to the specific needs of modern consumer segments, especially health-conscious customers (e.g., low-sodium or low-sugar canned fish) and those prioritizing quality and product variety (e.g., canned fish in new sauce flavors). This, coupled with modern and attractive packaging, helps broaden the customer base. (3) Expansion of distribution channels, driven by the growth of convenience stores, modern retail outlets, and online platforms. Given these factors, domestic consumption of canned tuna products is projected to grow by 0.9-1.9% per year, while canned sardine products are expected to remain stable at -0.5% to 0.5% per year. Although canned tuna is priced higher than canned sardines, it offers more versatility for culinary applications, unlike canned sardines which are mostly in tomato sauce. Additionally, tuna is considered a low-fat protein source that meets the preferences of modern consumers.
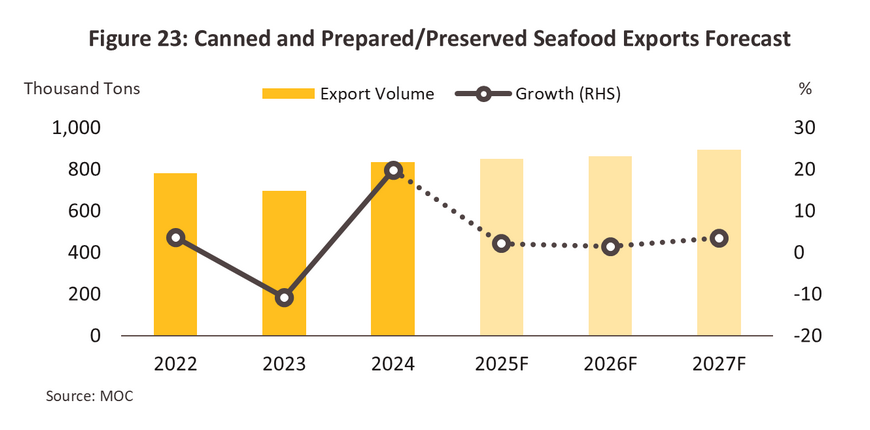
Thailand's export volume of canned and prepared/preserved seafood products is projected to grow by an average of 1.8-2.8% per year from 2025 to 2027 (Figure 23). The main product categories can be broken down as follows:
-
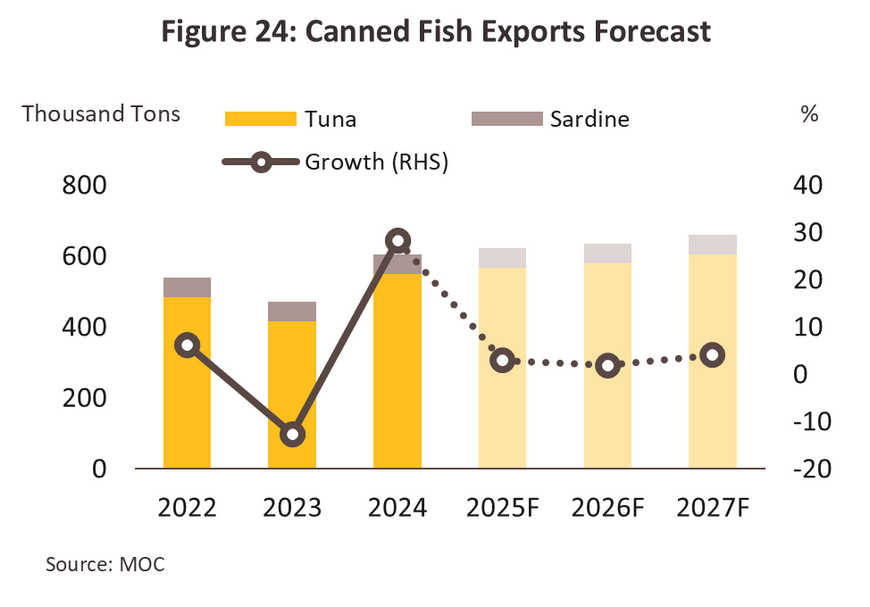
Canned and prepared/preserved fish products are projected to expand by an average of 2.1-3.1% per year from 2025 to 2027 (Figure 24). This growth is anticipated despite pressure from US tariff increases, which may impact exports, especially in the second half of 2025 and 2026, following accelerated inventory build-up in the first half of 2025 before the high US import tariffs take effect. However, several factors continue to support growth: (1) Thailand's advantage in production scale, which keeps the export price of Thai canned tuna competitive compared to some rivals. In 2024, Thailand's average price was USD 4,780/ton, compared to Vietnam and Ecuador at USD 5,360/ton and USD 6,040/ton, respectively. Among the top 10 exporters of canned tuna to the U.S., only Mexico and Indonesia offered lower prices than Thailand—at USD 4,520/ton and USD 4,700/ton, respectively. However, their market shares in the U.S. remain relatively low, at only 7.2% and 4.4%, respectively, compared to Thailand's nearly 50%, (2) continued preference among consumers in some key trading partners of Thailand, such as Australia and Japan, for canned fish as a high-quality, affordable protein source. Meanwhile, demand in emerging markets in the Middle East, Latin America, Africa, and ASEAN countries shows good growth potential, (3) modern consumer behavior, emphasizing convenient, long-shelf-life, and reasonably priced food which continues to drive an increasing global demand for ready-to-eat meals, (4) Thailand's leading production capabilities in manufacturing processes, flavor diversity, quality, and product safety, which are well-recognized globally, particularly for meeting Halal food standards. Given these factors, the export volume of canned tuna products is expected to expand by 2.7-3.7% per year. Canned sardine products are projected to remain stable at -0.5% to 0.5% per year, and prepared/preserved fish products are expected to grow by 0.0-1.0% per year.
-
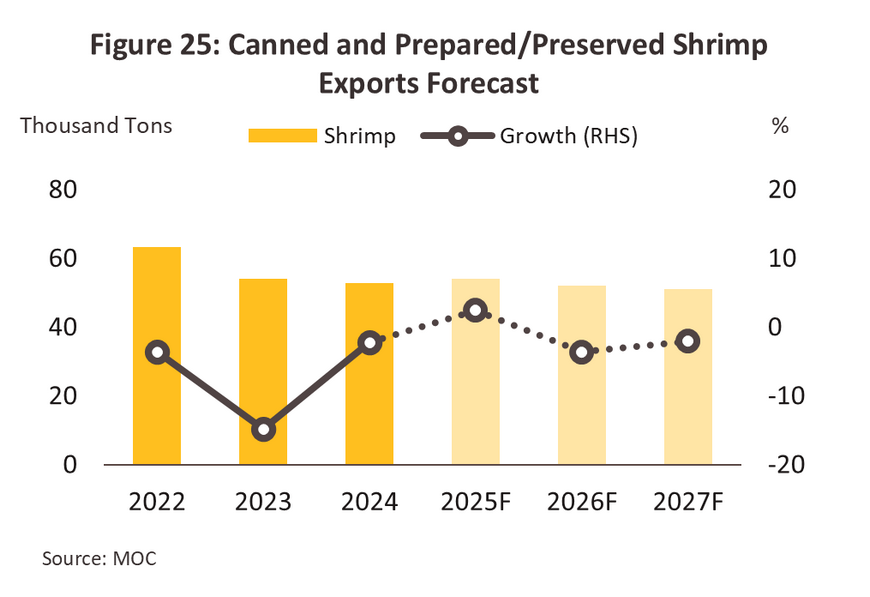
Canned and prepared/preserved other seafood products (excluding fish) are expected to contract by an average of -0.6% to -1.6% per year. The main products are canned and processed/seasoned shrimp, with export volumes also expected to decline by -0.6% to -1.6% per year (Figure 25). This anticipated contraction stems from several factors: (1) Disease outbreaks that have been a persistent problem for several years, affecting Thailand's shrimp industry structure and causing farmers to reduce shrimp farming volumes or permanently cease operations; (2) Intense competition in the global market while Thailand's export competitiveness in shrimp has declined; and (3) Rising shrimp farming costs for Thai farmers, which pressure farmers' profitability and reduce incentives for shrimp farming.
Industry Challenges
- Global economic uncertainty poses challenges for Thailand's export-dependent canned seafood industry, which faces risks from policy changes that could impact purchasing power in trading partner countries, particularly in key markets like the United States. Although Thailand remains a major source of imports, canned tuna continues to be a key protein-based food product with sustained consumer demand, the industry cannot avoid the impact of potential U.S. reciprocal tariff measures. There is a high likelihood that such measures would undermine Thailand's competitiveness in canned seafood products compared to competing countries subject to lower tariffs, particularly among competitors with cost advantages.
- Stricter ESG standards imposed by importing countries, such as compliance with international standards related to sustainable fishing practices (e.g., IUU Fishing), present ongoing challenges. Although the EU has lifted Thailand's "yellow card" status, close monitoring and inspection of operations continue. Issues regarding transparency in marine resource management and unfair labor practices still require continuous improvement. Furthermore, Thailand's continued Tier 2 status in the U.S. Trafficking in Persons Report (TIP Report)11/ indicates that Thailand must undertake additional measures to address these concerns.
- Competitive advantages of rival countries from preferential tariff treatment, such as FTA benefits in the EU market that Vietnam and Ecuador12/ have secured, while Thailand remains in FTA negotiations and has been stripped of GSP13/ privileges since 2015. Additionally, the Ecuador-China Free Trade Agreement, which was concluded and took effect in 2024 (with Ecuador and China being major global shrimp exporters and importers respectively), will allow Ecuador to enjoy tariff-free access to the Chinese market, unlike Thailand. Furthermore, Ecuador can access new production technologies from China that help reduce production costs for canned fish and processed fish products, potentially enhancing Ecuador's cost competitiveness advantage. (At present, Ecuador ranks as the third-largest global exporter of canned and processed fish products, with Thailand ranking second behind China.) These challenging factors may therefore erode Thailand's price competitiveness compared to competitors exporting under FTA privileges and trade agreements available to those rival countries.
1/ HS Code: 1604 and 1605 comprise prepared or preserved products, which are products that have been prepared or preserved and are contained in hermetically sealed containers.
2/ HS Code: 1604
3/ HS Code: 160414
4/ HS Code: 160419
5/ HS Code: 160420
6/ HS Code: 1605
7/ HS Code: 160529
8/ HS Code: 160554
9/ HS Code: 160521
10/ Source: Department of Fishery
11/ The Trafficking in Persons Report (TIP REPORT) is an annual report by the U.S. Department of State on the situation of human trafficking in various countries, classified into four levels: 1) Tier 1, or countries whose governments fully comply with the minimum standards; 2) Tier 2, or countries whose governments are making significant efforts to comply with the minimum standards; 3) Tier 2 Watch List, or countries whose governments are making significant efforts to comply with the minimum standards, but the number of human trafficking victims is very high or significantly increasing, or they cannot provide evidence of increasing efforts to address the problem; and 4) Tier 3, or countries whose governments do not comply with the minimum standards and are not making significant efforts to do so.
12/ Source: European Commission
13/ Thailand’s right has been removed since the country has classified as upper middle-income country by the World Bank. Countries are categorized into one of four groups according to their per capita income (PCI): Low-income countries have a PCI less than USD 1,085 USD, low-middle income countries have a PCI of USD 1,086-4,255, upper-middle income countries have a PCI of USD 4,256-13,205, and upper-income countries have a PCI greater than USD 13,205.


.webp.aspx)