Overall, the domestic ethanol industry is likely to expand further for the period 2019-2021 and average annual growth in demand is expected to run to 2.4-3.2% for these three years, lifting daily consumption to the range of 4.30-4.54 million liters. The sector will be supported by: (i) a forecast increase in demand for gasoline of 2.4-2.9% per year in this time period; and (ii) the already large size of the national vehicle fleet, coupled with the increasing number of new models that can run on fuel mixes with higher ethanol content (i.e. E20 and E85).
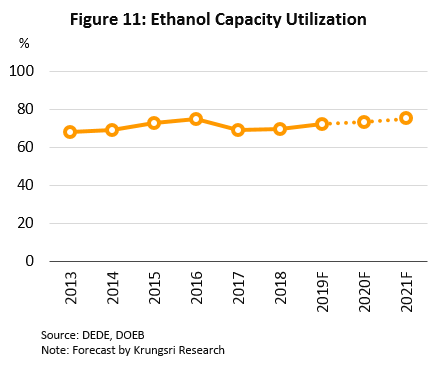
Despite this generally positive forecast for the sector, players will have to contend with an increasingly contested supply of raw materials, especially for those manufacturing ethanol from cassava, together with rising competition from a number of new entrants to the market that are planning to begin production in 2019. The latter development will then increase production capacity for the sector by around 2%. However, demand is expected to increase at a faster rate than production capacity and so the forecast is for capacity utilization to rise to 72-75% in 2019-2021, up from the 69% recorded in 2018.
Overview
Ethanol, or ethyl alcohol, is prepared through the fermentation of starchy and sugary plant matter as well as of cellulose and hemicellulose, yielding a product which is 99.5% pure by volume, to be used as fuel and/or a mixture in fuel for vehicles. Ethanol may be used as a replacement for benzene or used in other industries (e.g. food & beverages, pharmaceuticals). It is most commonly produced from agricultural products such as sugarcane, rice, millet, corn, and cassava.
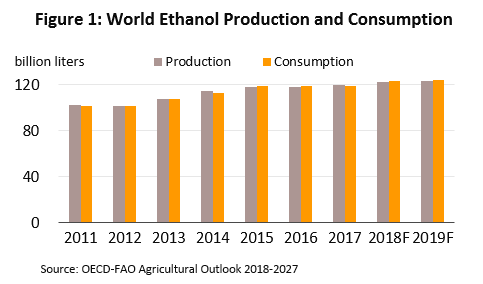
The supply and demand of ethanol is steadily growing worldwide, and in 2018-2019, supply and demand are expected to come to respectively 124 and 123 bn liters, compared with average annual supply and demand in the years 2011 to 2017 of 111.8 and 111.7 bn liters (Figure 1). The United States, Brazil and China are both the world’s biggest producers and consumers of ethanol, collectively accounting for around 80% of world output and consumption (Figure 2), and the most important raw materials from which ethanol is made in these countries are corn and sugarcane.
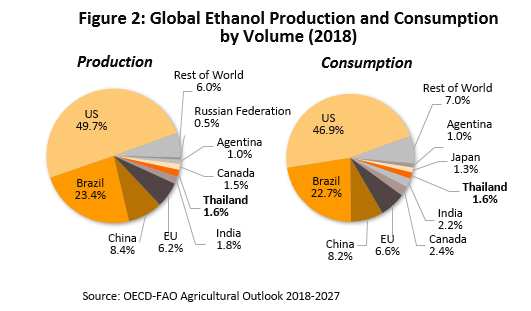
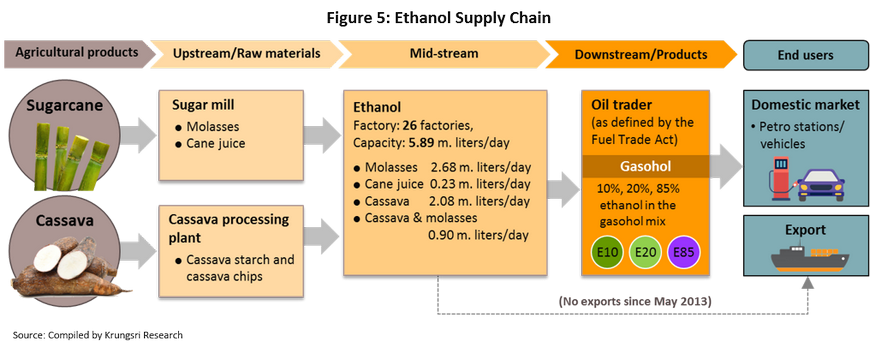
In the world rankings, Thailand sits in 6th place in terms of ethanol production and 7th in terms of consumption. The majority of domestic production of ethanol is mixed with benzene[1] to sell as gasohol. The output of ethanol producers is heavily dependent on demand for liquid fuels on domestic and export markets, together with government policy that exert a strong influence over the sector by specifying the quantity of ethanol that should be mixed with regular fuel. Thus, since 2001, the government has required that regular petrol be mixed with 10% ethanol when sold to the public, and this yields gasohol 91 and 95 (E10). The proportion of ethanol in the gasohol mix was increased in 2008 to 20% to make E20 and to 85% to make E85 with the result that overall consumption of ethanol has increased. However, distribution of ethanol within Thailand is restricted by the government to oil traders (as defined by the Fuel Trade Act) and the use of ethanol in other industries is still restricted since this requires the permission of the Liquor Distillery Organization, Excise Department.
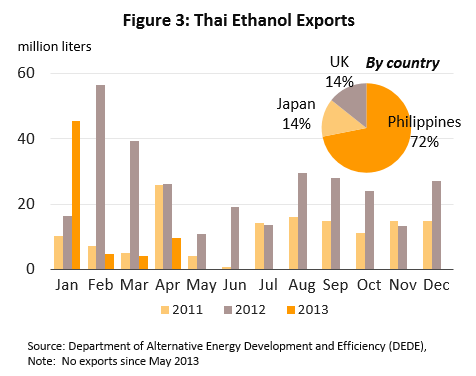
Thailand has exported to the world markets since 2007 with the important markets such as the Philippines, Japan, and the United Kingdom (Figure 3). The export of ethanol also requires a special permit from the Director General of the Excise Department. Later, when the government ceased the sale of benzene 91 from January 1st, 2013, demand for ethanol rose substantially. The authority responded by suspending ethanol export to ensure that there are sufficient supplies for the domestic market and, as a result, there have been no exports of ethanol since May 2013.
At present, Thai ethanol producers use a number of inputs, principally molasses, cassava and cane juice which the industry consumes in the ratio 65:30:5. This data is from 2018 and shows a slight shift in the use of raw materials from 2017’s ratio of 60:35:5; the increasing proportion of molasses that was used as a raw material reflects changing market conditions in 2018, when molasses fell in price and the cost of cassava more than doubled. However, production of ethanol from molasses can take advantage from supply of raw materials as most producers are large-scale players who came from sugar milling business. For ethanol from cassava, on the other hand, inputs may be affected by shortages given competition among several consuming industries or the intervention of the government to provide price support for the benefit of producers. This introduces uncertainties into estimating costs of production and represents a risk to producers.
Domestic ethanol production costs by raw material:
- Production of ethanol from molasses: approximately 60-70% of all costs are for raw materials, 25-35% are accounted for by operating costs, and 5% by fixed costs.
- Production of ethanol from cassava: approximately 55-60% of costs are for raw materials, operating costs account for 35-40%, and 5% are fixed costs. The operating costs for cassava-to-ethanol are higher than those of molasses-to-ethanol since in the former, there is an additional step, namely converting starch to sugar.
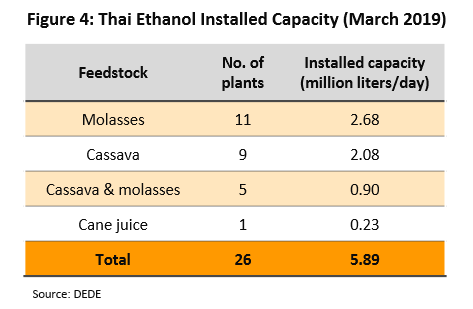
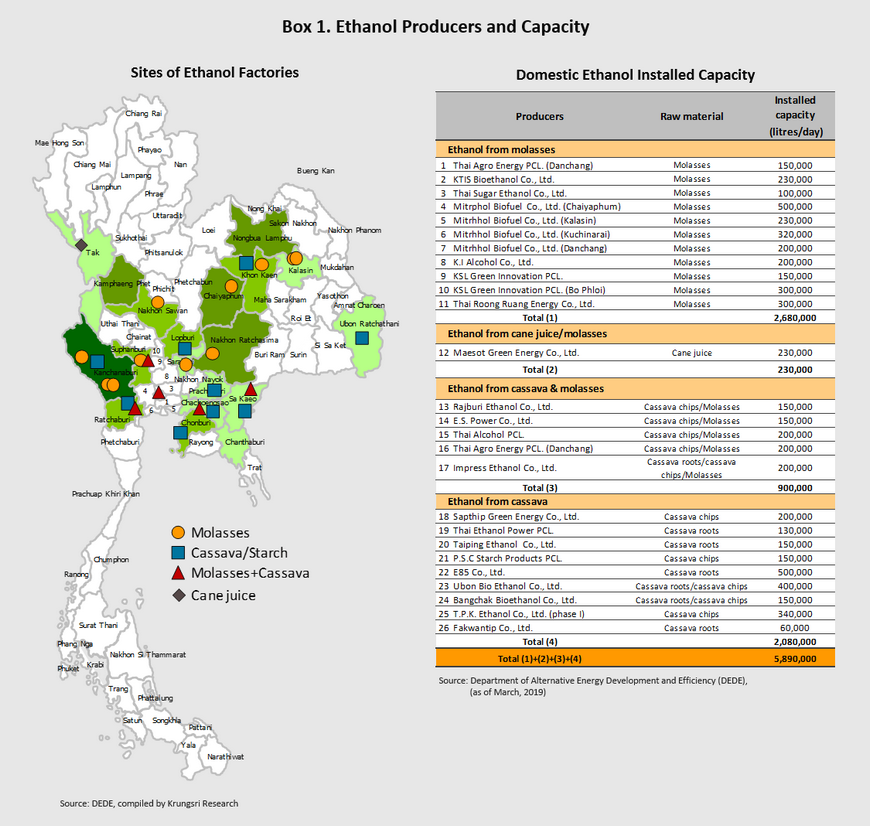
Currently, there are 26 functioning ethanol production facilities in the country, which together have an installed capacity of 5.89 million liters/day (latest data as of March 2019) increasing from 5.79 million liters/day in 2018. Of this daily total, capacity of ethanol production from molasses based contributes 2.68 million liters/day, from cassava 2.08 million liters, from mixed molasses-cassava 0.90 million liters, and from cane juice 0.23 million liters (Figure 4-5). These facilities are grouped in the central and north-eastern regions of the country. The largest of these ethanol plants are extensions of existing businesses, such as sugar and cassava processors (Box 1).
The reference price for ethanol is determined with respect to the real price of ethanol on domestic markets from information gathered by the Excise Department on market exchanges between manufacturers of ethanol and oil traders. It is an average of the price weighted according to the volume distributed of all molasses- and cassava-derived ethanol and is announced on the 1st of every month since January 1st, 2012. Whether producers would make a large or small profit will depend also on the (i) costs of inputs, and (ii) the type of raw materials used (i.e. molasses or cassava), as well as, an added marketing margin of around THB1-2/liter.
Government policy and how this is implemented (following the Alternative Energy Development Plan, or AEDP) is a major factor in determining the direction of the ethanol industry. Government measures to help the sector include those directed at: (i) supporting the increased use of gasohol; (ii) encouraging the development and sale of new vehicles that can run on E85; and (iii) pushing for the sale of biofuels (E20 and E85) on all forecourts. If these policies are pursued with sufficient vigor, they will aid in the development of the ethanol sector over the long term.
Situation
During the past five year, the situation for ethanol producers continued to improve as excess capacity has lessened.
- In the years 2007-2012, the ethanol sector suffered from an over-capacity, with an average utilization rate lower than 50% of total installed capacity. Government policy supporting the sector attracted a considerable amount of investment but at the same time, use of ethanol remained at fairly low levels; vehicles capable of running on gasohol mixes containing a large proportion of ethanol were not common and were not in favor. Meanwhile, support for gasohol consumption was low and reducing the distribution of non-gasohol fuels proceeded only slowly.
- Ethanol industry had improved during 2013-2016, evidenced from the fact overcapacity has been eased. Capacity utilization rate rose markedly to 78% in early 2014 as the government stopped distribution of benzene 91 (which accounted for 41% of all benzene fuels) on January 1st, 2013. Problems were also alleviated thanks to: (i) higher oil prices in 2013-2014; spurring higher demand for gasohol; (ii) an expansion of the vehicle fleet as a result of the first-time car buyers’ scheme; (iii) the development of new vehicles which are able to run on E20 and E85; and (iv) an increase in forecourts selling E20 and E85. Together, these led to an increase in demand for ethanol, consumption of which rose from an average of 3.94 million liters/day in 2017, as compared to 1.4 million liters/day in 2012 (Figure 6).
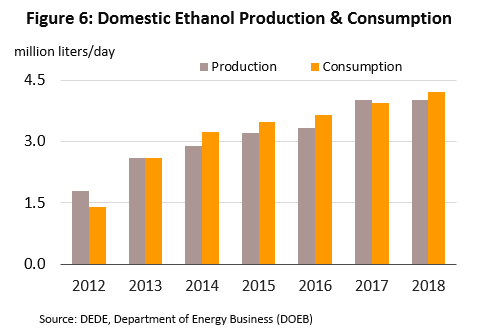
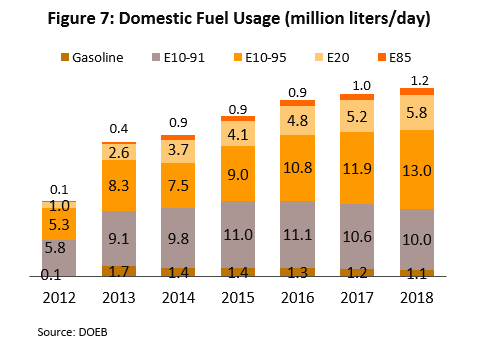
- In 2018, demand for ethanol rose 6.6% YoY to an average daily consumption of 4.20 million liters on rising demand for gasohol. This was driven partly by economic growth and partly by stronger sales of new vehicles that can run on fuel mixes with a higher concentration of biofuels and this then boosted sales of E20 and E85. Thus, for the year, sales of E20 (19% of all gasohol distributed to the domestic market) came to 5.8 million liters per day, up 11.5% YoY, while those of E85 (4.0% of gasohol sales) ran to 1.2 million liters per day, a rise of 13.9% YoY. The vast majority of gasohol (77%) is sold as E10, and sales of this rose at the much lower rate of 1.8% YoY to 23.0 million liters per day (Figure 7).
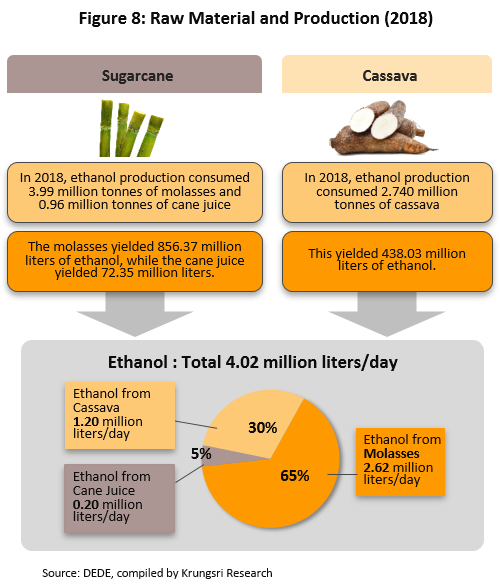
In 2018, daily production averaged 4.02 million liters, which was very close to the 2017 level of 4.01 million liters. In terms of inputs, over the year, the daily output from raw materials comprising molasses, cassava and cane juice came to an average of respectively 2.62 million liters (up 16.5% YoY), 1.20 million liters (down -9.0% YoY) and just 0.20 million liters (up 4.4% YoY), these having ratios of approximately 65:30:5 (Figure 8).
Although demand for ethanol ran ahead of production, stocks came to 135.8 million liters (as of 4Q18) and because of this, at 69%, average capacity utilization for 2018 was close to that of 2017.
Turnover for players manufacturing ethanol from molasses improved in 2018 relative to the figure for 2017. Cassava-based producers suffered from the rising cost of raw materials, despite this, their overall margins remained superior to those of players producing from molasses (Figure 9).
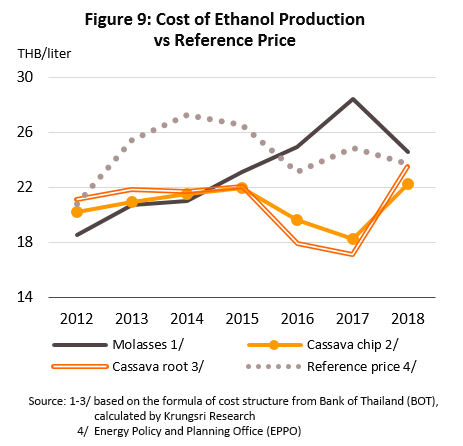
- Manufacturers of ethanol that used molasses as their primary input saw their margins improve relative to those of the year before on a fall in the price of molasses. This was caused by an oversupply to the market, which occurred despite increased demand from both ethanol producers and other industries, including distilleries and suppliers of animal feed. As such, production costs weakened, falling by an average of -8.5% YoY to THB 24.52/liter (calculated on an average price of molasses through 2018 of THB 4.10/kilogram) while ethanol sold for an average price of around THB 25-26/liter (the reference price for ethanol was THB 23.70/liter, but an extra THB 1.5-2.0/liter was added to this for marketing costs). Molasses-based producers thus saw improving business conditions compared to those for 2017, when margins were very narrow, in some cases even turning negative.
- Cassava-based producers of ethanol had to endure shrinking margins through 2018 as the price of their raw materials rose sharply; in 2018, the price of fresh cassava and cassava chip averaged THB 2.38/kilogram and THB 5.44/kilogram, compared to THB 1.40/kilogram and THB 3.93/kilogram in 2017. This dramatic spike was driven by a fall in prices several years earlier that prompted a reduction in the area given over to cassava production and with this, a contraction in supply, while in 2018, demand from a number of industries for cassava also rose, both for household consumption and for use in animal feed. The net effect of this was to push up production costs substantially, and for the year, costs for fresh cassava-based ethanol rose by an average of 37.5% YoY to THB 23.48/liter, whereas those for cassava chip-based ethanol increased at the somewhat lower rate of 21.7% YoY to THB 22.20/liter. Against average sale prices of THB 25-26/liter, operations that produce ethanol from fresh cassava clearly suffered from an acute reduction in margins compared to the previous year.
Outlook
Overall, the forecast for the ethanol sector is likely to expand further, and demand should grow by 2.4-3.2% per year, with total daily output expected to reach 4.30-4.54 million liters within 2019-2021 (Figure 10). This evaluation is based on trends in the consumption of gasohol E20 and E85; in 2018, these two types of fuel represented 23% of all sales of gasohol but over the next 1-2 years, this is expected to rise to 25%. However, because of the greater quantity of ethanol in these two mixes, this will increase the share used to make E20 and E85 to 55% of all end-uses of ethanol, up from 2018’s figure of 49%. The forecast for higher demand for E20 and E85 is based on the following.

- Improving economic growth is expected for 2020 and 2021 and this, together with greater levels of trade and tourism and so greater regional travel and connectivity, will help to increase demand for gasoline[2] by an average of 2.4-2.9% per year over the next 3 years, with consequent impacts on demand for ethanol.
- There is already a large number of vehicles registered in Thailand, and new models that are designed to accept fuel mixes with a high proportion of ethanol (i.e. E20 and E85) are increasingly gaining a foothold in the market.
Strengthening demand for ethanol is attracting investment to the sector to expand production capacity. This is coming both from current operators and from new entrants to the market (in 2019, 1 or 2 new businesses plan to start ethanol production) and the effect of this will be to increase 2019 production capacity by 1.9% to a daily total of 5.9 million liters (up from 5.79 million liters in 2018). However, demand is expected to rise at a faster rate and this will mean that in the period 2019-2021, capacity utilization should average 72-75%, compared to 2018’s rate of 69% (Figure 11).
Producers of ethanol who use cassava as their primary input are forecast to see problems securing a steady supply of inputs and while cassava yields will gradually increase from 2019 onwards, cassava will also be in strong demand by several different industries, including food processing, beverages, and medicines and cosmetics. It is expected that by 2021, demand for cassava for ethanol production will come to 3.5 million tonnes, although only around 3 million tonnes is expected to be available on the market as periodic droughts and infestation by pests eat into supply, leaving businesses with a shortfall in raw materials. Molasses-derived ethanol may be minimally affected toward raw materials as molasses output is likely to increase following sugar production after expansion of cultivation areas. Therefore, molasses price is likely to decrease.
In the coming period, the overall direction of the industry will be strongly affected by the extent of government support, both in terms of backing the use of gasohol and in terms of encouraging manufacturers to develop new models that accept fuels with a high ethanol content. However, new transport technologies that either do not use liquid fuels at all or use only small amounts, such as hybrids and electric vehicles (EVs), are gradually taking on a greater importance in the Thai auto market and this, together with the emergence of alternative modes of travel, such as the new mass transit networks within the Bangkok Metropolitan Region, may have an impact on the use of traditional internal combustion engine (ICE) vehicles and over the long term, this may then lead to a weakening of demand for ethanol.
Krungsri Research’s view:
Over the next three years (2019-2021), the ethanol sector is likely to see steady growth on an expansion in demand. However, the ability of operators to keep income levels steady may be somewhat affected by new production capacity that is gradually coming into play and by risks arising from possible shortages of inputs, and so the forecast is for business performance to be in moderate levels.
- Molasses-based ethanol producers: For this group, income should continue at levels close to those of the previous year since most molasses-to-ethanol production is carried out by players that are part of sugar processing businesses and so these operators tend to have secure supplies of raw materials. The price of molasses which is also forecast to fall in some periods following expected increases in production brought about by new sugar factories coming into operation, leading naturally to a concurrent decline in production costs. Meanwhile, demand for ethanol trends to increase. Margins for molasses-based ethanol producers will therefore tend to improve after a very narrow or negative margin in the past 2-3 years.
- Cassava-based ethanol producers: Income for operators manufacturing ethanol from cassava will increase slowly. Despite benefit from growing market demand, there will be pressure on producers arising from possible intermittent shortages of raw materials and operators will be at risk of competition over the supply of inputs of cassava, both from players in other sectors and from other new, large-scale ethanol producers that are beginning to enter the market. As a consequence, business profits for those manufacturing ethanol from cassava will tend to be stable.
[1] A replacement for octane additives in benzene or Methyl Tertiary Butyl Ether ( MTBE).
[2] Including gasoline and gasohol groups.


.webp.aspx)