2021-2023 THAILAND INDUSTRY OUTLOOK
The Thailand Industry Outlook report evaluates the attractiveness of selected Thai industries to support credit evaluation for the bank’s clients over the next 3 years (2021-2023). The report considers a range of factors that will affect each industry over this timeframe. These include the broad competitive environment (e.g. trends in trade and the global economy, structural changes occurring at global level, and economic outlook for Thailand), as well as sector-specific variables (e.g. industry structure, Thai industrial competitiveness, and ongoing regulatory changes). We look at the players’ ability to cope with uncertainties, generate revenues, and service debt.
Macroeconomic environments
Global economy in 2021-2023: Different pandemic recovery and growth trajectories for major economies
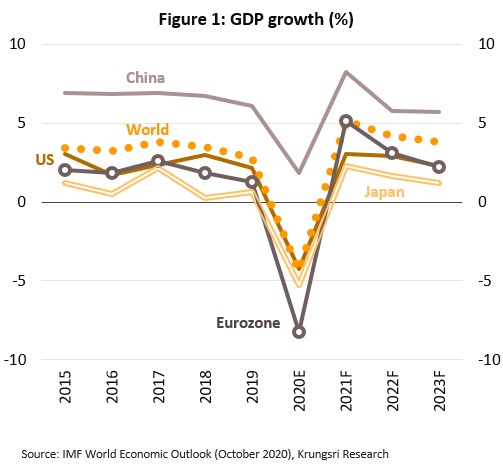
- Over the next three years, the global economy is projected to grow by an annual average of 4.4%. It will recover from the recession in 2020, the worst setback to growth in several decades. Economic activities would continue to rebound gradually, led by manufacturing and exports. With the rollout of vaccination programs this year, lockdowns would be relaxed in many countries possibly by 2Q21, and governments would continue to offer wide-ranging fiscal and monetary support for their respective economies. Growth will also be supported by the development of several COVID-19 vaccines, which are expected to enter mass production in the first half of 2021, followed by mass immunization programs that will accelerate in the latter half of the year. Meanwhile, the election of Mr. Biden as the next American president suggests the US is unlikely to introduce more trade barriers, and with this, at least one obstruction to a recovery in global trade has been removed, and the world economy should return to growth mode.
- Over the next 3 years, the US economy is projected to return to average growth of 2.8% per year, following an estimated 4.3% contraction in 2020. This will be helped by a recovery in domestic demand fed by stronger consumption and investment, which have in turn benefited from government response to the COVID-19 pandemic and efforts to alleviate the impacts on businesses and workers. The US labor market is recovering from earlier lows, with unemployment rate improving to 6.9% in October from 14.7% in April, and unemployment claims falling to 7.3 million at end-October from 25 million at the start of May. This has helped to boost consumer spending; in April, spending was only 82% of pre-pandemic level, but by October this had recovered to 98%. Beyond this, Biden is likely to push through a major fiscal support package to stimulate the economy further and overhaul the US’ trade policy to provide a further fillip to businesses and exports. Meanwhile, the Federal Reserve is indicating it will maintain an accommodative monetary policy through to 2023 and is fully committed to intervening in corporate debt markets. As a result, financial conditions have recently returned to pre-COVID-19 levels considerably faster than the recovery from previous economic crises.
- In the Eurozone, recovery is expected to accelerate with growth reaching 3.5% per year, though this follows a much deeper recession that knocked 8.3% off the bloc’s GDP in 2020. The rebound will be powered by growth in manufacturing and stronger exports to the bloc’s main trade partners, especially the US which is now expected to follow a less confrontational trade policy for its traditional allies. Domestic demand will also benefit from stimulus measures worth EUR1.82trn, comprising: (i) long-term spending by the EU over 2021-2027 worth EUR1.07trn; (ii) EUR750bn from the EU Recovery Fund; and (iii) the temporary Support to mitigate Unemployment Risks in an Emergency (SURE) program, which injected another EUR87.4bn into the region. For its part, the European Central Bank (ECB) is also looking to further relax monetary policy by introducing negative policy rates and/or expanding the Pandemic Emergency (asset) Purchase Programme (PEPP) which has access to EUR1.35trn funds currently.
- In Japan, recovery will be relatively anemic with growth at 1.7% annually, following a 5.3% GDP contraction during the 2020 recession. Growth will be supported by several factors. (i) Exports would expand in line with the recovery in the world economy and global trade. (ii) Household consumption would improve supported by a strong labor market (unemployment rate was just 3% in September), though rising household savings point to a fragile recovery. (iii) Business confidence is strengthening, particularly in the travel and tourism industries (e.g. restaurants) which are the prime beneficiaries of the government’s ‘Go To Travel’ stimulus package. (iv) Investment in digital services will expand over the long-term in response to anticipated labor shortage; this is one of the government’s key initiatives. Along with this, public-sector investment has also been boosted by the postponed 2020 Olympics. (v) Other stimulus measures, including those aimed at alleviating the effects of the pandemic, are supported by a JPY549bn supplementary budget. And like other central banks, the Bank of Japan will likely maintain an accommodative monetary policy in the foreseeable future.
- China is outperforming other major economies and can look forward to average growth of 6.6% per year over the next three years, accelerating from an estimated 1.9% growth in 2020. The country is now reaping the benefits of its rapid and comprehensive measures to control the COVID-19 outbreak. It is recovering faster than most other countries, to the point where even industries that had been severely impacted by the pandemic, such as restaurants and domestic airlines, have returned to pre-pandemic heights. In the coming period, household consumption is expected to be an important driver of the Chinese economy. In fact, this is part of China’s 14th Five Year Plan (2021-2025), which also lays the framework for the structural reform of the economy. This will be achieved through the development of technology and innovation, increasing the efficiency with which factors of production are allocated, protecting the environment, and shifting the center of gravity within the economy from a dependence on export markets to domestic consumption. Also, China’s favor in the scramble to recover is the healthy state of its labor market, coupled with being a frontrunner in the race to develop a COVID-19 vaccine. Its success has enabled the country to roll-out a mass immunization program ahead of other countries. The net effect of all these factors will be a sustainable recovery through the next few years. Although investment is weakening, it is also becoming more balanced with investment in manufacturing rising in line with stronger exports and higher profits, and over a broader timeframe, the government’s long-term plans to raise manufacturing standards and push ahead with technological innovation. This is happening alongside slowing investment in real estate (reflected in falling land prices) and a slack in government spending on infrastructure which has been an important stimulus for the economy but is now becoming less necessary.
Anticipated structural changes in the world economy and the impact on businesses and industries
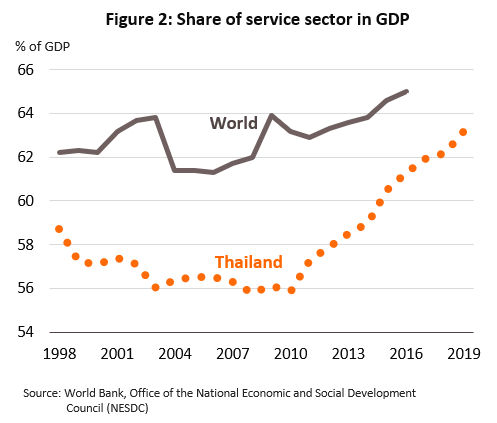
- The global economy is undergoing structural shifts as it transitions from a dependency on manufacturing to becoming increasingly centered on services. So between 2008 and 2017, the share of world GDP attributed to services rose from 62.0% to 65.1%. Although, in advanced economies such as the US, the UK and France, services generate about 75% of GDP, led by ‘modern services’ such as IT, software design and finance. In Thailand, the service sector’s share of GDP has grown from 55.8% in 2008 to 63.2% in 2019. But in the Thai economy, traditional services such as tourism, trade, and hotels & restaurants dominate, and only 14% of national GDP comes from modern services which are largely confined to finance and telecommunications. However, in the next period, this will change. Technological progress will raise importance of modern services within the economy because these will add value to goods and services. For example, design and consultancy services to best utilize technology such as artificial intelligence and big data to boost sales and design new products that better meet consumer needs. Thus, if Thailand wishes to keep up with prevailing trends that are transforming businesses worldwide and secure sustainable, long-term development, it will be essential for the country to meet and overcome the challenges involved in transforming the economy into one that is based on the provision of these modern services.
- At the same time, the global trading environment is more tense and trade barriers are becoming increasingly common. Indeed, the World Trade Organization (WTO) reported that in just one year (October 2018-October 2019), WTO member states have employed 102 measures to control trade worth USD750bn. This is the most barriers reported in 7 years and a 27% increase on the year earlier. To control imports, imposing import tariffs was the most common move followed by import bans, stricter import procedures, and imposing other fees. Exports were most often controlled by imposing export charges, specifying pre-conditions for export and requiring the issue of export licenses, and capping export volumes. The products most affected by these restrictions are minerals, fuel products, machinery, electrical equipment and parts, and precious metals.
The tendency to erect trade barriers is both a threat and an opportunity for Thailand, especially given escalating tensions between the US and China since 2018. Both these countries are important export destinations for Thailand. The US-China trade war has exerted downward pressure on Thai exports, but at the same time, Thailand is presented with an opportunity to benefit from trade diversion to develop its own export sector by replacing exports in the bi-lateral US-China trade vacuum. Thus, in the first 10 months of 2020 (January-October), the value of Thai exports bound for the US rose to 14.8% of total exports from 12.7% in 2019, while exports to China climbed to 12.8% from 11.8%. In addition, Thailand may also benefit from investment diversion as US and Chinese investors seek to circumvent trade barriers by offshoring production facilities. In fact, in 2018 and 2019, applications for investment incentives to the Board of Investment from US and Chinese companies comprised 57% and 52% of total submissions (by value), respectively. However,
this path is not without obstacles and Thailand needs to develop comparative advantages to become a more attractive investment destination than its neighbors, such as Malaysia, Indonesia and Vietnam which unlike Thailand, already have free-trade agreements with Europe as part of their strategies to attract more foreign direct investment.
- Modern technology is rapidly reconfiguring the industrial sector and is creating a major structural transformation. In addition to rising competition, global megatrends will change productivity levels, pushing industry into the Fourth Industrial Revolution. But beyond this, the COVID-19 crisis has revealed weaknesses in prevailing business models, and companies are now rushing to strengthen supply chains and make them more resilient. The major technologies that will determine how industry is transformed over the next 3 years will include the following.
- 5G technology: 5G broadband can offer over 100 times the bandwidth of 4G networks, and 5G systems will support the revolution in manufacturing processes by controlling machinery-functional systems. They can collect and analyze big data resources to automatically adjust raw material and finished goods inventory. Examples of assembly lines that are built around 5G technology include Ericsson’s and Vodafone’s electric microcar production lines in Germany and Bosch’s electrical appliances production facilities in Britain.
- The Internet of Things (IoT): IoT devices are already playing a greater role collecting data from sensors embedded in a wide variety of commonly-found devices, including surgically-implanted heart monitors, smart fridges that monitor expiry dates of food, biochip transponders that check the state of livestock, and sensors in greenhouses to maintain optimum growth conditions. These devices will accelerate competition between suppliers to develop devices that gather and transmit data, and the use of these devices will change fundamental supply chains for manufacturers of parts and equipment in almost all industries, especially medical devices, electrical appliances, and auto assembly.
- Drone: The development of drones (pilotless, remote-controlled flying vehicles) has been closely connected to the development of related technologies including sensors, satellite systems, the IoT and AI. This has allowed drones to be used as labor- or time-saving devices in applications such as surveying land, preliminary visual inspection of an area, and spraying pesticide and applying fertilizer.
- Edge computing: This has evolved as a way of getting around the limitations of cloud computing-based big data analytics, and involves creating real-time links between data on changing consumer demand with production lines or other business operations, allowing systems to respond to customer data without having to pass through a cloud-based data center. Such systems, which emphasize speed, are most often used in applications where organizations need to respond swiftly to changing consumer behavior, in both the industrial and services sectors (e.g., healthcare providers, recreation services, and logistics).
- Artificial intelligence (AI): Industrial applications for AI are increasing. And when used alongside other new technologies, including cloud computing and the IoT, it is increasingly facilitating big data analytics, such as supporting recording and diagnostic systems in hospitals and healthcare facilities, assisting in call-center services, and employed in manufacturing and services industries that are affected by labor shortage. In addition, the deployment of ‘cobots’, where human staff work with robots and automated systems, is also increasing. For example, robots and drones working with farmers in field-based applications. Research by PwC reveals the majority (60-70%) of leading global corporations have developed AI applications for use in their assembly lines. Siemens now uses AI for its engineering quality control tests and to schedule maintenance of machinery. PwC predicts that by 2030, AI will be generating USD15.7trn worth of added-value in the global industrial sector. A survey of the investment plans of leading global companies carried out by Emerton Data (a data science consultancy) reveal 85% of respondents plan to use AI in their production processes.
- Blockchain: The use of distributed ledger technologies in place of centralized systems allows for the sharing of information among users on a network, but because data is password-protected, data-security is maintained. This would facilitate peer-to-peer business transactions, especially those involving digital currencies or assets, as well as the secure storage of large, sensitive datasets, such as medical genome maps, biometric data, or tracking and tracing sources of agricultural products to create systematic information, which will lower costs across the supply chain.
- Quantum computing: The development of computers that exploit the peculiarities of the quantum world, in place of the binary digital computers used currently, will increase both the speed and potential of AI. Quantum computing is now entering the stage where commercial applications are feasible. The market for smart devices that are built on quantum technology is forecast to be worth USD8bn by 2022 (Business insights & lifestyle guides, hivelife.com), mostly involving smart equipment such as driverless vehicles and robotics.
- 3D printing: The use of 3D printing allows for the rapid, low-cost design and production of goods controlled by digital technology. This can be used to better meet rising demand from middle-income consumers for customized products. This will play an increasing role in transforming industrial supply chains and allowing for the reuse and recycling of materials through ‘recycle bots’ in industries including fashion, parts for use in auto assembly and aeronautics, electronic equipment, tools, equipment and spares, and even printing tissue cultures.
- Cultured meat/plant-based meat: It is now possible to manufacture meat products from cow, chicken, pig and tuna stem cells. Meanwhile, meat-like products produced from plant-based ingredients are increasingly similar to meat in terms of taste and texture. These products have advantages over traditional meats, including smaller environmental impact, quality, absence of hormone and antibiotic residues, a healthier nutrient profile, less negative health impact than consuming conventional meats, and is a sustainable food supply in the event of food shortages resulting from outbreak of diseases in livestock or natural disasters. The products can also help to meet changing consumer patterns arising from an aging society and rising interest in personal health and wellness.
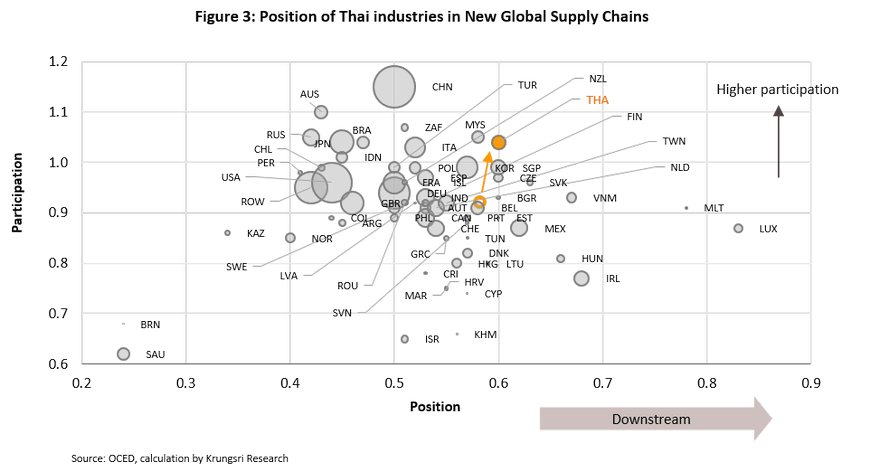
- Global value chains are being transformed by the after-effects of the COVID-19 pandemic. The pandemic had brought industrial supply chains almost to a halt in the first few months, but this has since incentivized corporations to identify some of the complexity in their supply chains and reduce the distance that separates them from their suppliers. This is being achieved by spreading production over several countries in the same region, and locate them near sources of supply. This process is leading to the creation of shorter, more diversified and more regionalized supply chains. In light of this, Krungsri Research projects that in five years, parts of Thai industry will be more deeply embedded in global value chains. Industries that will benefit from greater linkages to supply chains would be in downstream positions where Thailand has competitive advantages, including the production of food & beverage production, and computer & electronic products. However, upstream industries, especially agriculture and mineral extraction, risk seeing a weaker participation in global value chains.
Thai economy in 2021-2023: Recovery will be buoyed by the export sector and government stimulus measures
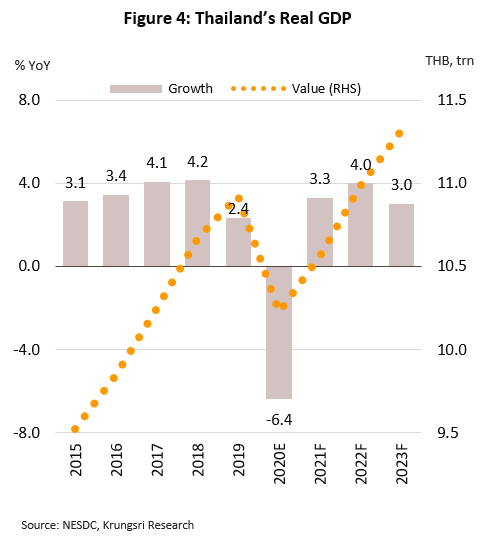
The Thai economy is projected to expand by an average of 3.4% annually over the next 3 years. Factors supporting economic growth in the coming period will include the following. (i) The latest wave of COVID-19 cases in the country is expected to be contained by 2Q21 given quick measures, experience from handling the first wave, and the availability of vaccines. This means the government should be able to relax pandemic control measures then, allowing the economy to return to near-normal and boosting sentiment in private-sector businesses. (ii) Business operations and consumer behavior have adapted rapidly to changing circumstances, with a surge in numbers working from home and online shopping. (iii) The export sector will rebound premised on a cyclical recovery in the economy and improving global trade, helped by easing of lockdown measures and rollout of extensive stimulus packages in major economies that lean heavily on both fiscal and monetary levers. (iv) Thailand is beginning to relax travel restrictions, and now permits entry for selected persons, including film crew, trade show participants, high-income earners, and those with ‘Special Tourist Visas’ (STVs). International travel should also pick-up gradually, possibly from the second half of 2021. The mass COVID-19 vaccination programs worldwide will encourage international tourism and tourist arrivals in Thailand should recover. (v) Government efforts to kickstart the economy will help to sustain greater levels of spending. They include measures to stimulate consumption and reduce cost of living, accelerated disbursement of the annual budget, an emergency decree allowing the government to borrow THB1trn to counter the impacts of the coronavirus disease, and using state enterprise funds to invest in infrastructure projects. Other measures include offering soft loans and financial assistance to businesses affected by the pandemic, through the Bank of Thailand (BOT) and the Thai Credit Guarantee Corporation’s Portfolio Guarantee Scheme.
Accelerating public-sector investment in infrastructure will underpin recovery of the overall business and industrial sectors
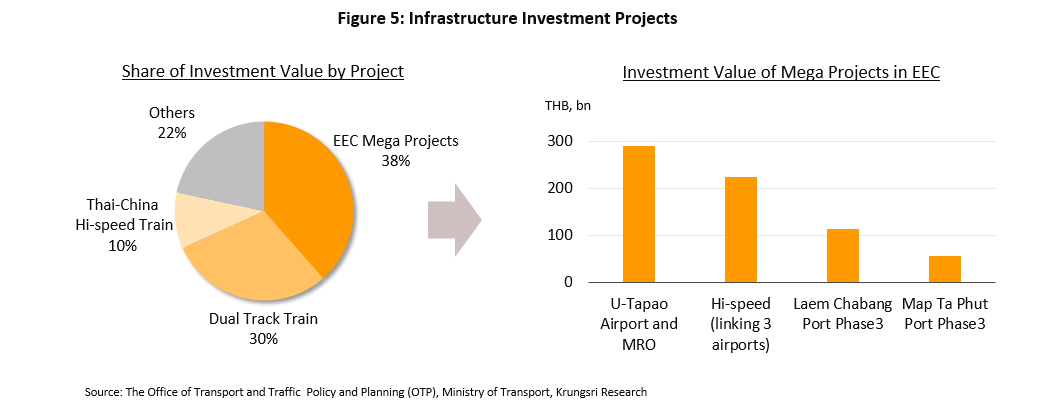
Government investment in infrastructure projects, especially in megaprojects, will be a major driver of growth in business and industry over the next several years. The latest Transportation and Communications Action Plan, published in 2018, forms part of the 20-year Strategic Plan for Communications and Transport (2017-2036) and calls for a total of THB1.77trn investment in infrastructure projects. The planned development of rail networks will involve a large number of projects that will start in 2021. The most significant will be the Den Chai-Chiang Khong and Ban Phai-Nakhon Phanom dual-track railways, the Thai-China high-speed rail, and the MRT Orange Line extension. Linking different parts of the country to the wider region will make the transport network significantly more comprehensive. The Eastern Economic Corridor also plays a strategic role in attracting and supporting many other large-scale investment projects, and these are now beginning to move into the construction phase, including the Suvarnabhumi-U Tapao high-speed rail, phase 3 of the development of Map Ta Phut and Laem Chabang ports, and the upgrade of U Tapao Airport, which will have a combined value of over THB60bn in 2021 (from a total combined value throughout the projects of THB680bn). The government has also agreed to upgrade and extend other projects, including developing Laem Chabang Port to connect the EEC to the south of Thailand and the country’s neighbors, thus helping to establish the country as an ASEAN transportation hub. This will lead to investment to develop and construct new transportation networks, for example, a dry port which should be completed by 2023-2024. Pushing through policies to accelerate the extension of this multimodal transport network, which will deepen regional communication and connections, will also help to pull in additional investment from manufacturing industries, especially those that are dependent on high-technology (e.g., auto parts and assembly, digital electronics, and healthcare), and from other parts of the economy such as real estate, retail and construction.
Business Environment
Structural problems are capping the competitiveness of Thai industry
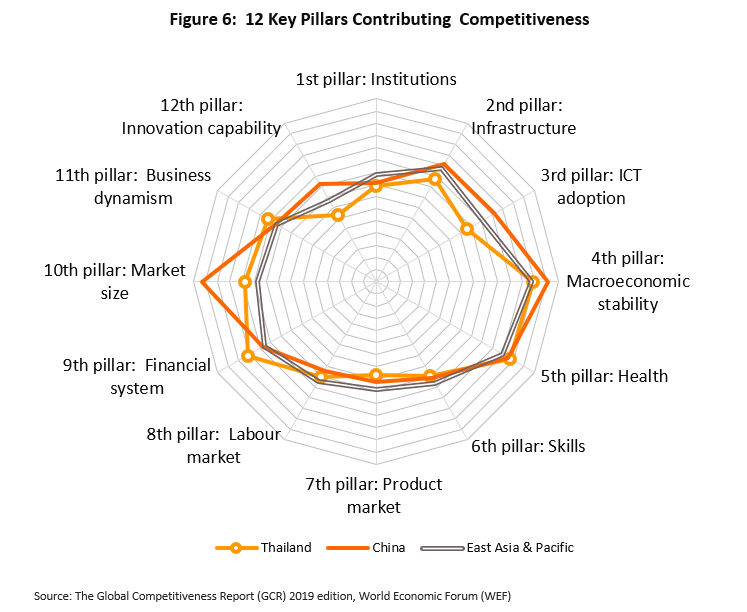
The WEF’s 2019 Global Competitiveness Index reveals Thailand’s score for overall competitiveness improved to 68.1 from 67.5 in 2018, but the improvement lags behind that of other countries. Thailand’s rating out of 141 nations slipped from 38th to 40th. Thailand’s overall competitiveness improved because of macroeconomic stability, the economy is balanced, the financial sector is strong, and the population has almost universal access to high-quality healthcare. But Thailand needs to develop its regulatory environment, reduce bureaucracy, encourage the development of lifelong learning skills so the workforce can continuously up- and reskill, and encourage competition through diversification of production and distribution, and reduce risk of markets becoming monopolies.
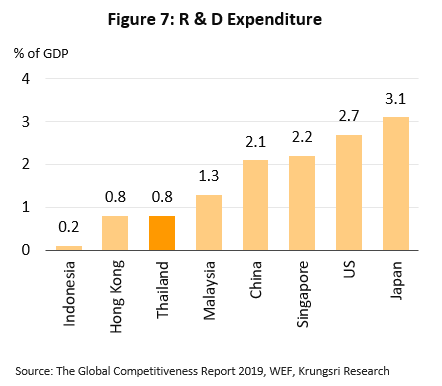
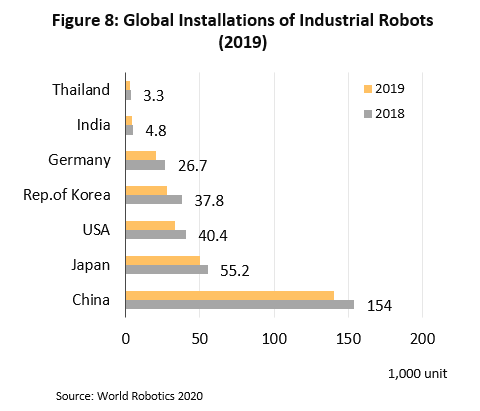
Other areas where Thailand needs to reform urgently include developing a comprehensive infrastructure and network of rail and seaport services, assuring labor rights, building skills in innovation and technology (including developing, and then finding applications for innovations, and raising awareness of the importance of cybersecurity), and increasing the level of research & development. With regard to the latter, Thailand scored only 33.6 out of 100, trailing behind regional competitors such as China (79.5), India (57.1) and Malaysia (44.0), partly because expenditure on research & development accounts for only 0.8% of Thai GDP. Thailand also faces ongoing labor shortage. Although the country imports robotics systems for industrial applications to cut costs and raise standards, Thailand remains a ‘technology user’. Hence, it falls behind countries such as Japan, the US and China, which are a ‘technology investor’ and continuously invest in the development of robotics and other technologies to use themselves. Because of this, Thailand is only able to deploy robotic systems in certain industries, such as auto assembly, electronics, machinery and metals, plastics and food processing. Hence, the Thai export sector is still largely dependent on finding markets for products that are assembled with low levels of technology. Unfortunately, effecting the kind of structural reforms necessary to overcome these obstacles and to fully-transform Thai industry along the lines of the 4th Industrial Revolution will be a long process. The factors outlined above will weigh on the export sector, reduce competitiveness and escalate the risk of the country losing market share.
Regulatory reforms and the impact on industry
Stability
- There have been measures and changes in the real estate market (enforced since 2020) to reduce speculative pressure, improve efficiency of land allocation, and reduce uncertainty over the future value of mortgage collaterals.
- Greater regulation of mortgage loans with the introduction of new loan-to-value (LTV) rules. (i) For first homes valued at less than THB10mn, banks can offer 100% LTV ratio, with possibility to increase to 110% with a ‘top-up’. (ii) For first homes valued at over THB10mn, borrowers must make minimum 10% down payment. (iii) For second and subsequent homes, if there is a loan still outstanding on the first property or if the property is valued at over THB10mn, the maximum mortgage (loan for the property plus any ‘top-up’) will be relative to the collateral value, as specified in the regulations. These rules came into force in April 2019, with changes to the rules affecting first homes effective January 2020.
- The Land and Building Tax Act was effective in January 2020. This could increase real estate developers’ tax burden if they have a large backlog of unsold stock, especially unsold condominiums held for longer than 3 years because they will now attract a land tax.
- Government has reformed financial regulations to protect consumers, reduce the impact of the COVID-19 crisis, and to prepare the industry for greater competition.
- Increasing consumer protection. This is achieved by: (i) changing how interest is calculated and rules for fee collection when loans are paid-off early; (ii) changing interest charge for defaults by SME and individual borrowers, and splitting them into a series of payments (with effect from January 8, 2020); and (iii) extending regulation to cover services provided by specialized financial institutions (SFIs), asset management companies (AMCs), and nano-finance operations (with effect from September 4, 2020).
- Policies to reduce the impact of the COVID-19 crisis. These include aid to SME and individual debtors, a debt consolidation program for individual borrowers, a preventative debt restructuring program (January 1, 2020-December 31, 2021), and reducing statutory contributions by Thai banks to the Financial Institutions Development Fund (FIDF) from 0.46% to 0.23% of deposits for two years, starting April 2020.
- Authorities are also preparing the financial system for anticipated changes. They introduced new regulations to govern personal digital loans and the use of alternative data to support applications for the same (from September 15, 2020), drafting the Payment Systems Roadmap (2019-2021) which pushes for the use of digital systems as the primary payment channel, and enforcing new rules on peer-to-peer lending platforms (from July 2020).
Health
- The imposition of a sugar tax on non-alcoholic drinks with rates calibrated to sugar content should help to increase consumer awareness about the health impact of excessive sugar consumption. The tax rates are being ratcheted up in 4 stages: September 16, 2017-September 30, 2019, October 1, 2019-September 30, 2021, October 1, 2021-September 30, 2023, and October 1, 2023 onwards. In response to the steadily rising excise duties, prices may rise, demand may weaken, and manufacturers may start to produce low-sugar or health drinks.
Energy and the environment
- Reform of the energy sector is directed by the revised 2018 Power Development Plan for 2020-2037. The plan places a strong emphasis on alternative energy and supports the development of generating facilities powered by biomass, bio-gas and waste. The plan also opens the market for energy to competition in the supply of rooftop solar energy, help balance supply from alternative sources, and promotes investment in energy storage. Given this, investments in these energy sources will increase from 2021 onwards.
- Reform of energy sector regulations
- The LNG market has been liberalized. In the past, only a small number of operators were allowed to enter the market. Now, private-sector players are permitted to supply and transport LNG. As such, domestic prices for natural gas may fall.
- The crude reserves that refiners and traders are required to maintain have been lowered to 4% of total volume distributed, from the earlier requirement of 6% reserve ratio. This policy will run from May 1, 2020-June 30, 2021. After that, it will rise to 5%. This will reduce stockholding costs for operators.
- Extending expiry of subsidies for E20 and E85 gasohol and B10 and B20 diesel from 2022 to 2024. This will help to ease the COVID-19 impact on ethanol and palm oil producers. The pandemic has reduced in demand for transport fuel.
- Pushing back plans to address air pollution, especially PM2.5 particles. Authorities had pushed back plans to tighten regulations on exhaust emissions, and moving to Euro 5 and then Euro 6 standards. There will be introduced in 2024 and 2025, instead of 2021 and 2022, because the stricter standards will raise production costs for manufacturers as they will need to develop new engines and exhaust systems.
- Introducing new energy-efficient building regulations. The Building Energy Code (BEC) will cover the design and construction of new buildings in 9 categories: hospitals, schools and universities, offices, condominiums, conference centers, theaters and cinemas, hotels, service centers, and department stores and shopping centers. From 2021, the code will apply to new buildings with a footprint of 10,000 sq.m. or more. From 2022, this will be extended to those over 5,000 sq.m., and from 2023 to those larger than 2,000 sq.m. This will increase costs for design and construction materials for new buildings, and for retrofitting older buildings.
Trade
- Successful conclusion of negotiations for the Regional Comprehensive Economic Partnership (RCEP)*/ agreement on November 14, 2020. This will be followed by ratification by the signatories in the second half of 2021, and enforcement. The agreement is aimed at reducing duties on 99% of the goods traded between member states. This is expected to increase trade between Thailand and RCEP signatories (prior to the agreement, it comprised 55.8% of the total value of Thai exports). For Thailand, this will present a clear opportunity for manufacturers of autos and auto parts, plastic nurdles and plastic products, chemicals, rubber and rubber products, and electronics and parts for electronic appliances, as well as the fishing industry. The RCEP may also benefit Thailand by encouraging investors from non-ASEAN countries to invest in production facilities or business centers in Thailand, as well as trigger the growth of supporting industries.
- Since January 1, 2021, the UK has reduced or suspended tariffs on imports from countries with which the UK does not have a free-trade agreement and which have not been granted GSP status. (i) For goods that were subject to tariffs of up to 2.5%, imports are now tariff-free. This covers imports of gemstones and jewelry, air conditioners, and automatic data processing equipment. (ii) Goods for which tariffs were set at no more than 20% will see tariffs cut to a maximum of 2.5%, covering auto parts and equipment and glasses. (iii) Where tariffs were 20-50%, they are now reduced to no more than 5%, which will affect imports of processed fish products and vehicles weighing up to 5 tonnes. (v) Tariffs of over 50% (e.g. for tobacco products) will be cut to a maximum of 10%. These changes are naturally expected to benefit exports of Thai goods in these product categories.
- Since April 25, 2020, the US has rescinded GSP status for imports of Thai ceramics in 473 product categories, including tiles, sanitaryware, insulators, souvenirs and decorations, tableware and crockery. This will increase the cost of exports to the US, which with a 10% share (in 2019) is Thailand’s second most important export market for ceramic products. Japan accounts for 40% market share, making it Thailand’s largest market.
- Revision to the ASEAN Trade in Services Agreement (ATISA) is intended to fully liberalize trade in services from 2021. Compared to the 128 categories of services covered by the earlier ASEAN Framework Agreement on Services (AFAS), the ATISA extends trade liberalization to 155 areas. Under the agreement, signatory nations - without exception – must automatically grant foreign businesses most favored nation status. This could increase investment in Thailand’s services sector.
- The Trade Competition Commission is preparing to announce guidelines for operators of digital food delivery services. They are aimed at ensuring that delivery businesses operate fairly and there is free competition. The announcement is pending publication in the Royal Gazette, which means enforcement will start in 2021.
Other measures
- The annual THB40/room fee levied on hotels is suspended from July 1, 2020-June 30, 2022. This would reduce the financial burden on hotels because they have been badly hit by the pandemic.
- The Thai Industrial Standards Institute will include retread tires a controlled item, which will affect tires used in large vehicles, including passenger vehicles with more than 9 seats, trucks and articulated vehicles. It is hoped that this will improve the quality of retreads, making them safer and reduce accident rate. The regulations will be enforced in 2021.
- Review or repeal duplicate/outdated laws and regulations (the ‘guillotine’ process). This includes regulations governing visas and work permits for non-Thais. If successful, this will help businesses in industries troubled by labor shortage.
Krungsri Research believes the measures described above represent both an opportunity and a challenge to the Thai economy. But the changing global economic and social context means modernizing the country’s regulatory framework is an undertaking that cannot be avoided. Indeed, if successfully pursued, this process will help to lay the foundation for a business environment that will support long-term, sustainable, commercial and industrial growth.
AGRICULTURE
Rice
Situation in 2020
- Paddy outputs dropped 25.0% YoY in 9M20 following the worst drought in 40 years. The Rice Price Index surged 8.6% YoY led by higher prices for white and glutinous rice that were driven by (i) insufficient output to meet domestic demand, especially glutinous rice, and (ii) some exporters stopped sending shipments overseas as they stockpiled food in response to the pandemic. Overall, the income index for rice farmers fell 19.0% YoY, largely due to lower yields.
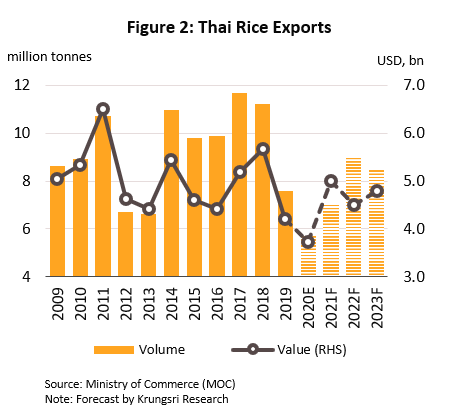
- Exports crashed 31.9% YoY to 4.0 mn tonnes in 9M20, bringing in USD2.70bn proceeds (-15.3% YoY). This was partly supported by much higher prices for Thai rice (e.g. Hom Mali, Glutinous and White) relative to rice from Vietnam, India and Pakistan. China, an major market for Thailand, also cut imports to run down domestic stock.
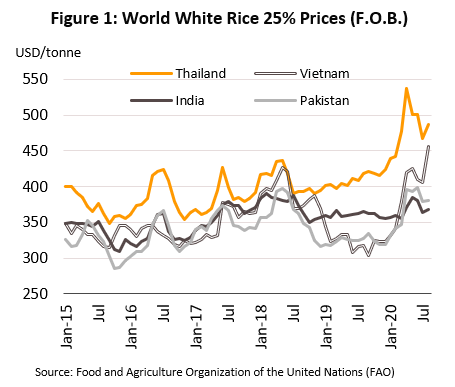
- In 4Q20, (when 80% of paddy has been harvested), output should rebound due to (i) higher rainfall, and (ii) high prices, expansion in cultivated area, and more plantings. For full-year 2020, paddy output is projected to rise by 6.5% to 30 mn tonnes. But exports will drop 25.0% to 5.69 mn tonnes because of weaker price competitiveness. Although prices of Thai rice have dropped since, they remain higher than rice from other countries because exporters had bought stock when prices were elevated.
Outlook for 2021-2023
- Annual output is expected to rise by 1.0-3.0% to 30-32 mn tonnes of paddy or 20-21 mn tonnes of milled rice. This would be driven by more favorable weather, which will boost yields especially for in-season rice (in 2021-2022, La Niña condition should help farmers). Farmers will also likely expand planted area and/or increase number of plantings because (i) although prices are falling, they remain above production costs, and (ii) they are incentivized by government measures to expand operations, including income guarantee, crop insurance, help with planting schedules, and soft loans to slow the release of new harvest.
- Players will continue to face challenges, including domestic and international price competition and high cost of Thai rice, though the impact will vary across different segments of the industry.
- Exporters: Exports will return to growth as competitiveness improves when domestic prices fall and current stock is sold off. But exporters will need to shoulder the costs of purchases made in 2019-2020 when Thai rice was more expensive.
- Millers: Businesses face higher risks because they will have to contend with uncertain weather and large excess supply. Large/integrated operations which can control costs will have an advantage, while SMEs may face problems with liquidity or securing paddy supply.
- Silos: Revenue will remain depressed due to large excess capacity. Operators will need to cut prices and seek alternative markets.
Rubber
Situation in 2020
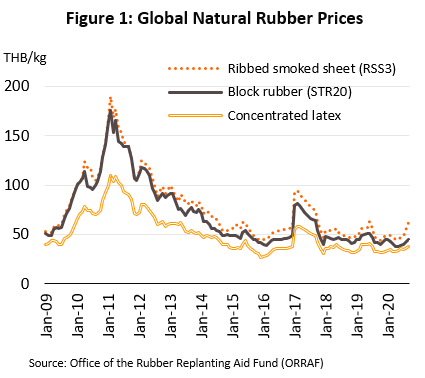
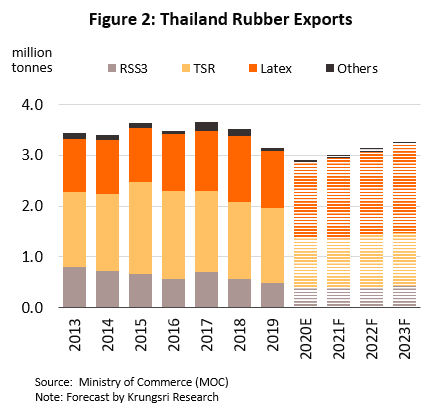
- In 9M20, natural rubber output slipped 2.4% YoY due to outbreak of leaf fall disease and a shortage of migrant labor. Hence, output of upstream rubber products (ribbed smoked sheet, block rubber and concentrated latex) also shrank, albeit also due to weak demand. Exports (80% of output) fell 21.4% YoY to 1.9 mn tonnes with lower volumes to most markets. The COVID-19 crisis has dampened demand from downstream industries. Thus, exports of RSS and TSR tumbled 25.9% and 37.4% YoY, respectively. However, exports of latex rose 3.3% YoY mainly due to stronger demand from surgical gloves producers in Malaysia. Export prices slid 6.5% YoY, in tandem with lower crude prices, causing export proceeds to plummet 26.4% YoY to USD2.4bn However, government support helped to keep domestic demand similar to 2019.
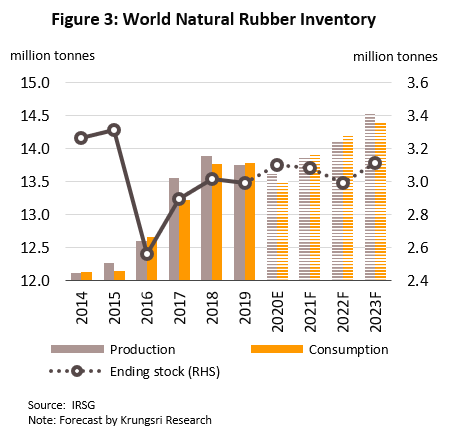
- Rubber tapping activity has been affected by heavy rains, which means output will continue to slide in 4Q20. Hence, 2020 output is projected to drop 1.5% to 4.7 mn tonnes. Exports will remain depressed in 4Q20, and for 2020, it will shrink 16.0-17.0% following a 10.7% drop in 2019, due to weak demand and competition from the CLMV countries. Export prices will fall by 3.0-4.0% on lower crude prices (along with lower prices for oil-based synthetic rubber, a substitute good). As such, overall export value would drop by 19.0-20.0% to USD3.3bn However, domestic demand will rise by 1.0-2.0% thanks to higher government consumption and stronger 2H20 purchases by downstream industries as the economy recovered.
Outlook for 2021-2023
- Output will rise by 3.0-4.0% annually, led by: (i) earlier expansion in planted area; (ii) better climate; (iii) serious outbreak of leaf fall disease in other producing countries will benefit Thai rubber producers and raise prices; and (iv) incentives offered to farmers to expand plantations, such as income guarantee scheme.
- Domestic demand will rise by 4.0-5.0% per year premised on the economic recovery, progress in government infrastructure projects, growth of downstream industries (especially tire and latex gloves), and government support for the industry. Exports will also return to growth, rising by 3.0-4.0% annually driven by stronger demand from downstream industries, again led by manufacturers of tires and surgical gloves. Thailand will also benefit from smaller output in other rubber-producing countries. In Indonesia and Malaysia, this will be due to outbreak of leaf fall disease and labor shortage, and in Vietnam it will be due to severe storms. However, the outlook will vary across product groups.
- RSS and TSR: Exports will rise by only 1.0-3.0% and 1.0-2.0%, respectively, due to competition from traditional producers (Indonesia, Malaysia and Vietnam) and from new entrants to the market (Cambodia, Lao PDR and Myanmar).
- Latex: Exports will grow by 5.0-7.0% p.a. on stronger demand from producers of latex gloves and other latex-based medical products, especially in Malaysia, the most important market.
Cassava
Situation in 2020
- In 9M20, the drought and outbreak of cassava mosaic disease reduced cassava output by 12.3% YoY. But demand was mixed across different product groups.
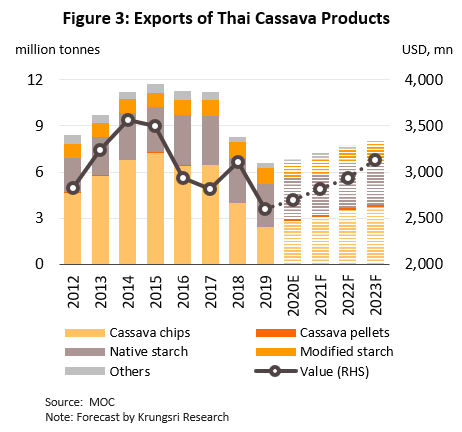
- Exports of cassava chips and cassava pellets jumped 21.8% and 43.9%, respectively, due to greater demand for use in the production of alcohol, especially in China (Thailand’s major market). In China, cassava is an alternative to corn feedstock now that prices have escalated as stocks have dwindled.
- Exports of native and modified cassava starch dipped 6.6% YoY as demand from Indonesia, Taiwan and Japan softened. Export prices also dropped 3.0% YoY due to lower prices for cassava, weak demand, and greater price competition. Total export proceeds from cassava starch slid 9.4% YoY in the period.
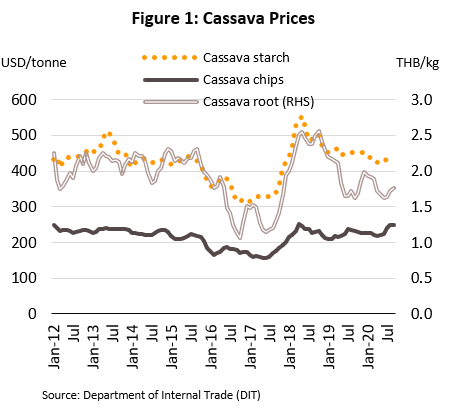
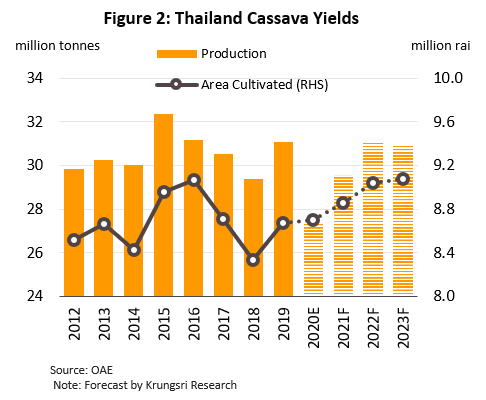
- In 4Q20, the situation will be similar. So for 2020, cassava output should total 27.4 mn tonnes, falling 12%, compared to 5.8% growth in 2019. Domestic sales will rise by 1.9% (vs +13.1% in 2019) on stronger demand from the Food & Beverage (F&B) industry and for use in power generation. Ongoing disease outbreak means that in 2020, exports of cassava chips and pellets will jump 19.0-20.0% by volume and 20.0-21.0% by value. But weak orders from downstream industries overseas will reduce exports of native and modified cassava starch) by 4.0-6.0% by volume and 6.0-8.0% by value, with native tapioca cassava starch the hardest hit.
Outlook for 2021-2023
- Output should rise by 4.0-5.0% p.a. on higher rainfall and government aid and incentives for farmers to extend cultivated area, especially the income guarantee scheme. Domestic demand will grow by 2.5-3.5% annually led by rising demand from downstream industries, especially F&B, and from ethanol producers. Exports of cassava products will also grow by 4.0-6.0% per year, but it will vary by product group.
- Cassava chips: Export volume will rise by 8.0-10.0% per year driven by: (i) expansion into new markets in Asia, including Vietnam, the Philippines, India and Singapore, which would offset a slower Chinese market; (ii) stronger demand for cassava for use in the manufacture of alcohol; and (iii) following COVID-19, a desire to build stockpiles and ensure greater food security.
- Cassava pellets: Exports will reach 10,000-40,000 tonnes, though demand might be fickle.
- Native tapioca starch: Exports will rise by 1.0-2.0% per year on stronger demand from the F&B industry and alcohol and ethanol producers. But there will be stronger competition from similarly-priced starches produced from other crops (e.g. corn and potato).
- Modified tapioca starch: Exports should rise by 3-5% p.a. thanks to greater demand from downstream industries including cosmetics, food and pharmaceuticals.
Sugar
Situation in 2020
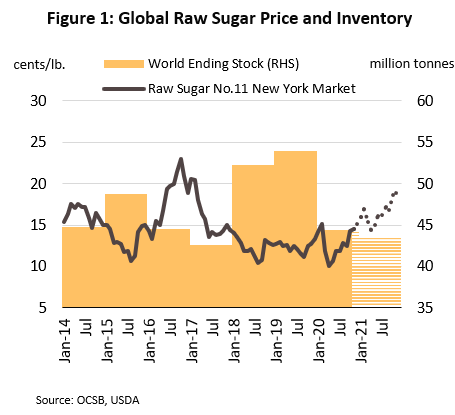
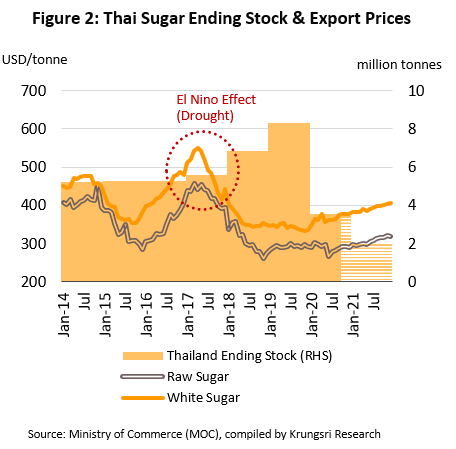
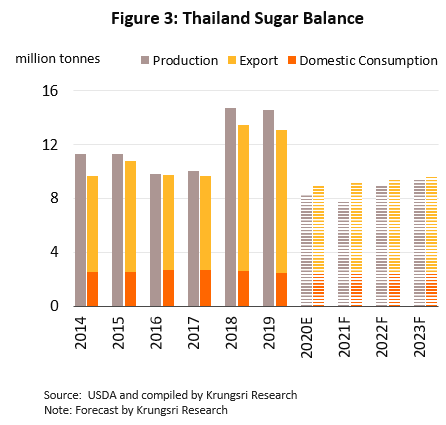
- In 9M20 (annual grinding season), sugarcane output crashed 48.9% YoY because of severe drought and low prices which had encouraged farmers to switch to more profitable crops. This caused sugar output to tumble 41.3% YoY. Likewise, weaker global demand triggered by the pandemic and drought-induced shortages also reduced exports by 33.0% YoY to 5.2 million tonnes. Weak demand from the F&B industry also weakened export prices for raw sugar, which slipped 1.3% YoY. Prices were also hurt by Brazilian producers’ move to switch from producing ethanol (due to lower oil prices) to manufacturing sugar. Overall, export value of sugar fell 30.4% YoY to USD1.6bn
- In 4Q20, output is expected to drop again despite stronger rainfall. For full-year 2020, output is forecast to drop by 43% on: (i) smaller sugarcane cultivated area; and (ii) slow growth or complete death of cane that has been harvested and allowed to regrow. The low cane and sugar output will disrupt supply. So for 2020, exports will fall by 37-38% by volume and 35-36% by value, compared to 11.3% and 3.0% growth in 2019, respectively. Following a 3.2% drop in 2019, slowing demand from the F&B industry will reduce domestic demand by 3.0-4.0% in 2020. Meanwhile, domestic sugarcane and export sugar prices should jump as world stocks shrink and global prices rise.
Outlook for 2021-2023
- Conditions will improve over the next 3 years.
- Supply: The emergence of La Niña means rainfall and reservoir levels should improve, especially in the major sugarcane growing areas in the northeast. Sugarcane output is forecast to rise to 85-93 million tonnes/year (up 7.0-8.0% p.a.), which would translate into 8-10 million tonnes of sugar (up 6.0-7.0% p.a.).
- Demand: Exports of sugar will rise by 7.0% to 7-8 million tonnes/year thanks to recovery in overseas markets. Domestic demand should grow by 2.0-3.0% to 2.5-2.6 million tonnes/year on (i) economic recovery, especially in the F&B industry, and (ii) government support for sugarcane growers and the sugar industry, e.g., offering aid for purchases of production materials and mandating the mixing of ethanol in gasohol.
- The industry will also face several challenges, including: (i) rising production in Brazil (the world’s biggest producer) as the country switches from ethanol to sugar production, which could lead to a supply glut and higher stock levels; (ii) hikes in sugar tax and a greater concern for public health; and (iii) uncertainty over the regulatory environment as the government attempts to align relevant legislations with WTO requirements. Specifically, the government is revising the Sugarcane and Sugar Act, broadening the coverage from only sugar production to include power generation and production of bioplastics and ethanol. They are also reviewing rules for floating sugar price and maintaining reserve sugar stock.
Oil Palm
Situation in 2020
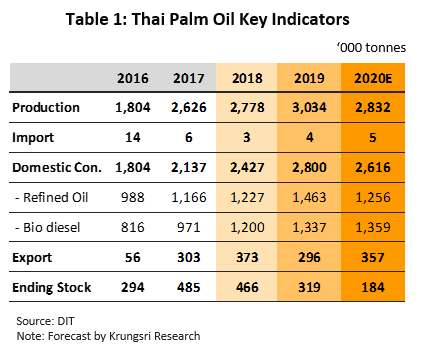
- Oil palm output dropped 1.5% YoY in 9M20 on (i) low rainfall in 1H20, (ii) lack of care for oil palm trees, and (iii) labor shortage that affected harvest. As a result, crude palm oil (CPO) output plunged 13.4% YoY, even as domestic demand grew especially for biodiesel following the directive to move from B7 to B10. The latter caused CPO stock to be run down and pushed up prices of fresh fruit bunches (FFB) and CPO to THB4.0/kilo (+66.3% YoY) and THB25.8/kilo (+54.6% YoY), respectively. Exports of palm oil products weakened, sliding 30.7% YoY to 0.24 mn tonnes and generating USD167.9mn (-11.7% YoY). CPO exports tumbled 28.7% YoY to 0.18 mn tonnes, while that for refined palm oil fell 38.7% YoY to 0.055 mn tonnes. This was because India (75% market share of CPO exports) switched to importing from Malaysia and Indonesia since (i) duties were reduced for CPO from these two countries, (ii) Thai CPO prices are higher than competitors’, and (iii) the pandemic had reduce downstream demand.
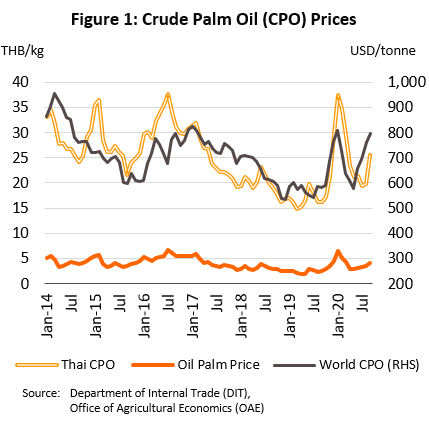
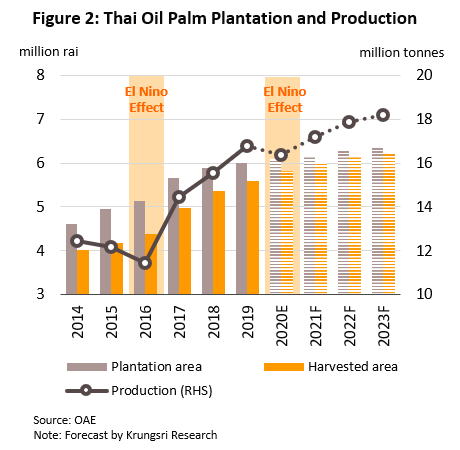
- In 4Q20, output will continue to decline, while demand will rise especially in export markets. Domestic demand will be boosted by the move to use CPO to generate electricity and higher biodiesel component in commercial diesel sales. Overall, 2020 FFB output is estimated to drop by 2.5% yoy to 16.4 mn tonnes, while export of palm oil products should rise by 3.0-6.0% led by improving orders from India and government measures to encourage the export of over 0.3 mn tonnes of CPO. This would reduce CPO stock to 0.18 mn tonnes by year-end, below the optimal level of 0.20-0.25 mn tonnes. This could lift price of FFB to THB4.5/kilo from THB2.7/kilo (+65.0%) and CPO to THB28.6/kilo from THB18.2/kilo (+57.0%). Export prices would also rise by 24.0-25.0% and lift total export value by 25.0-30.0%.
Outlook for 2021-2023
- FFB output should rise by 3.0-4.0% annually, premised on (i) an expansion in cultivated area, (ii) age profile with trees now entering the most productive phase their lifecycle, (iii) better climate, and (iv) government income guarantee scheme and other incentives. Domestic demand for CPO will rise by 2.0-3.0% per year, thanks to government support to encourage higher consumption (biodiesel, pure refined palm oil, and input for downstream industries) and policies to stabilize prices. However, players will face conditions particular to their segment.
- Oil palm growers will have to manage price fluctuations. Although profit margins would rise given farmers will try to keep prices above production costs of THB3.01/kilo, growers could see prices hovering at THB3.5-5.5/kilo.
- Crude palm oil millers will see weaker earnings, especially independent mills that are not integrated in the broader supply chain. CPO demand will rise but this is dependent on short-term government intervention (e.g., use CPO for power generation, measures to promote palm oil exports, and international trade policies) to align demand with future supply in the market.
Chilled, Frozen and Processed Chicken
Situation in 2020
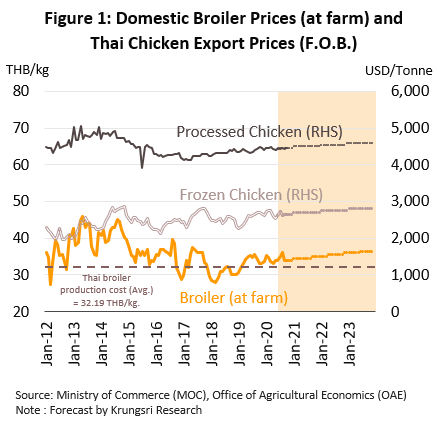
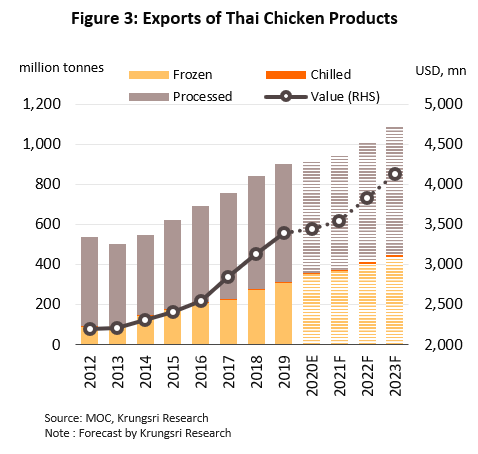
- Output of chilled, frozen and processed chicken grew 1.4% YoY in 9M20 on solid overseas demand. Exports reached 0.66 mn tonnes and brought in USD2.5bn proceeds, similar to 2019. Exports to Japan (Thailand’s most important market) soared, benefiting from the JTEPA and AJCEP FTAs. But shipments to the EU (Thailand’s second biggest market) tumbled following more stringent food safety checks to test for salmonella in imported chicken products. Domestic demand slowed following the national lockdown.
- For 2020, output of chicken products should increase by 3.1%.
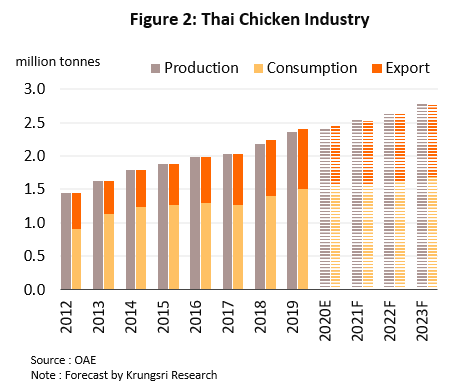
- Output will increase by 1.1% to 1.58bn broilers, supplying 2.42 mn tonnes of chicken meat (up 2.3% yoy).
- Domestic demand for chicken products will rise by 2.0-3.0%, slowing down from 7.7% growth in 2019, because of weaker purchasing power and temporary halting of most economic activity in 1H20. The latter had substantially reduced demand from restaurants and fast-food outlets. However, the reopening of most business sectors in 2H20 helped chicken consumption to rebound.
- Exports of chicken will inch up 0.5-1.5%, boosted by the slowdown or closure of chicken-processing plants in some countries (due to COVID-19) and by outbreaks of bird flu in major producing countries and African swine fever in China. This, and high standards of Thai processors, have encouraged some buyers to switch to Thai suppliers.
- Farmgate prices for chicken will average THB34.0-34.5/kg, up from THB 33.7/kg in 2019, on stronger demand.
Outlook for 2021-2023
- Business conditions will improve for the chicken processing industry, with output rising and demand, both domestic and export, strengthening in line with the economic recovery.
- Domestic chicken production should rise by 4.0-5.0% per year to 1.66-1.82bn broilers, or 2.54-2.79 mn tonnes of meat. Farmers will be incentivized by higher prices (possibly THB34.5-36.5/kg) backed by stronger domestic and export demand.
- Domestic demand will grow by 2.5-3.5% p.a. as the economy rebounds and the Food & Beverage industry recovers.
- Exports of chicken products will rise by 5.0-7.0% p.a, boosted by: (i) stronger global demand; (ii) supply disruption in major chicken-producing and exporting countries caused by outbreaks of bird flu and African Swine Fever; and (iii) the signing of FTAs between Thailand and its trade partners will give Thai exporters a comparative advantage.
- Nonetheless, chicken meat producers could face higher production costs due to higher prices for soy- and corn-based feed. This would pressure earnings but they will remain healthy.
Canned Fish
Situation in 2020
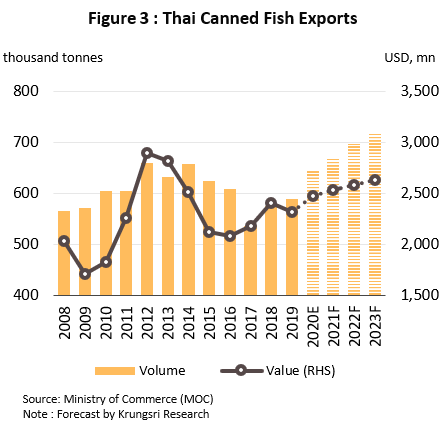
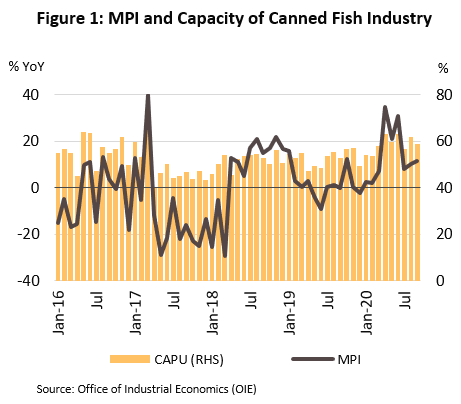
- In 9M20, the canned fish industry recorded strong growth, with overall output rising 11.6% YoY. Output of canned tuna rose 15.6% YoY because the COVID-19 pandemic had prompted consumers to stock more canned food. This had affected both the domestic market (up 19.7% YoY) and international sales which rose 10.8% YoY to 0.48 mn tonnes, generating USD1.87bn receipts (up 8.6% YoY). Shipments to North America saw the strongest growth (+33.9% YoY), led by exports to the US where importers switched from major competitors in the Philippines and Ecuador to sourcing from Thai suppliers. Demand was also strong in markets in Asia, South America and Africa. Thai exporters benefited from the country’s solid record in biosecurity and FTAs that Thailand signed with 18 countries.
- Export prices softened, falling back 2.1% YoY for canned tuna and sardines amid competition from the Philippines, Indonesia, Vietnam and ACP countries (Africa, Caribbean and the Pacific).
- Demand for canned fish should continue to rise in the rest of 2020. Strong orders from domestic and international markets are encouraging players to ramp up production capacity. We estimate output will rise by 12.0-15.0% in 2020, compared to only +1.4% in 2019. Exports should increase by 8.0-9.0%, but weaker prices in international markets means export value will rise by a smaller magnitude of 6.0-7.0% to USD2.06bn.
Outlook for 2021-2023
- The canned fish industry will continue to grow, with output forecast to rise by 5.0-6.0% per year. This would be supported by stronger demand especially in export markets. Players will benefit from: (i) expansion of Thailand’s market share during the COVID-19 crisis because of the country’s relatively high biosecurity standards; (ii) stronger overseas demand as the global economy and world trade recover; and (iii) greater investment in research & development to expand product range and produce more value-added products. Overall, exports are projected to rise by 3.0-5.0% p.a. by volume and 2.0-3.0% p.a. by value.
- However, there are still challenges for the industry. These include insufficient fish stock, labor shortage, and more trade barriers, especially non-tariff barriers (promote sustainable fishing, labor rights) which could reduce profitability, especially for SMEs.
ENERGY & UTILITIES
Power Generation
Situation in 2020
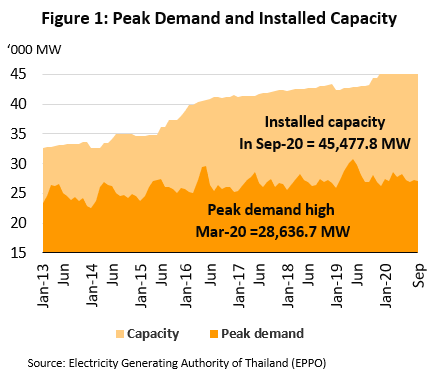
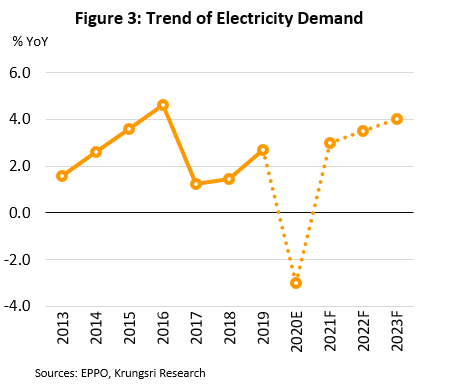
- Demand for electricity slipped 3.1% YoY in 9M20. Due to COVID-19 and the broad-based contraction in the economy, demand from business and industry (66.5% of total demand) fell by 10.4% and 6.3% YoY, respectively. However, work-from-home activity increase household power consumption, which rose 9.5% YoY. Overall, peak demand reached 28,636.7 MW, down from the historic high of 30,853.2 MW in 2019.
- Electricity generation also fell in 9M20, by 2.1% YoY. Generation by EGAT (33.8% of total) rose 4.6% YoY. But output from the private sector differed; supply from IPPs (Independent Power Producers which accounted for 22.4% of total electricity output) fell 17.3% YoY, while supply from SPPs (Small Power Producers, 25.6% share) fell 1.2% YoY. But, supply from VSPPs (Very Small Power Producers, 5.6% share) rose at a slower pace of 1.2% YoY.
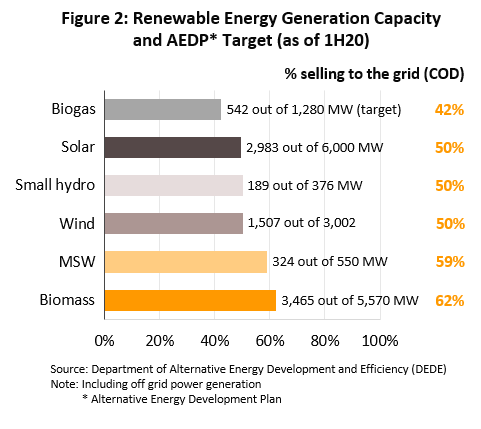
- In 1H20, installed renewables capacity selling to the grid reached 9,010.5 MW[1], up 0.9% from 2019, as SPPs and VSPPs continued to supply power as specified in their contracts. Waste-to-energy capacity grew 3.1%, biogas generating capacity rose 2.3%, while biomass generation capacity increased by 1.6%.
- For the rest of 2020, the reopening of most business sectors means demand from business and industry will rebound. We estimate demand would shrink by 3.0% in 2020 vs +2.7% in 2019.
Outlook for 2021-2023
- Players will see improving business conditions. Domestic demand is forecast to rise by 3.0-4.0% annually[2], in line with the economic recovery. Attractive investment incentives for the industry under the Power Development Plan (PDP) will support greater investment and larger capacity in the three categories below:
- IPPs will see competitive bidding for new supply contracts in the next 3-5 years. In 2021-2022, players will start to bid for 700 MW of new generation capacity annually. This will replace 8,300 MW of natural gas-powered capacity in the western region which contracts will expire soon and the plants would be offline over 2025-2027. Some IPP’s are also investing in power plants overseas, such as Indonesia, the Philippines, Lao PDR, China and Myanmar.
- SPPs are likely to expand installed capacity and build new power plants, especially natural gas cogeneration plants which contracts will expire soon. In addition, SPP hybrid firms (i.e., plants that run on a mix of renewables) will benefit from higher government feed-in tariff of THB3.69/unit (vs THB3.66/unit in 2019). This support will be maintained over the next 20 years.
- For VSPPs, investment should pick up from 2021, especially in rooftop solar capacity and biomass, biogas and waste-to-energy generation capacity. Supply from these remain below target, so they offer an investment opportunity. And, such plants are also competitive on costs and inputs. The government will buy more wind-generated power in 2022-2024 when EGAT complete the installation of high-voltage lines to wind farms in the northeast and south of the country to the national grid.
Oil Refineries
Situation in 2020
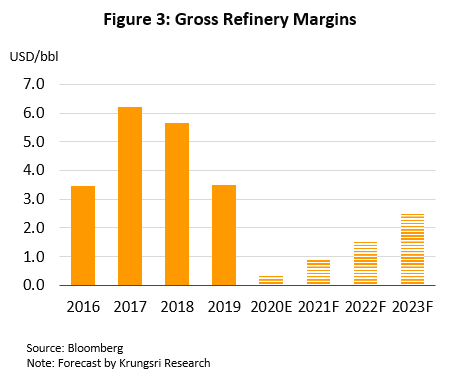
- In 9M20, global demand for oil tumbled 9.9 mn bpd as the COVID-19 pandemic had severely disrupted the global economy. At the same time, OPEC+ throttled supply by only 5.6 mn bpd. These caused Dubai Crude to crash 34.8% YoY to USD41.6/barrel (from USD63.8), and gross refinery margins (GRMs) to plummet to an average of only USD0.3/barrel from USD4.3 in 9M19.
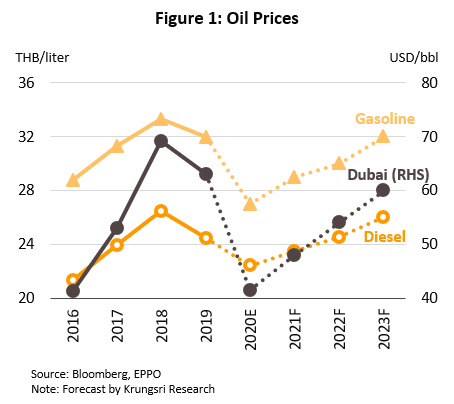
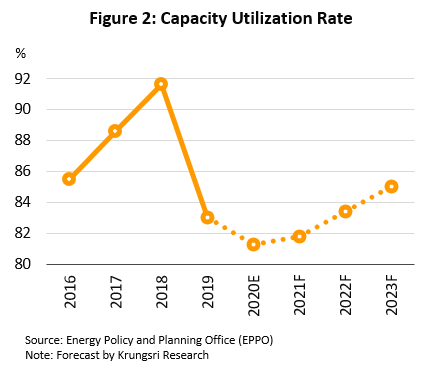
- Thai refineries’ earnings slumped along with GRM and a 12.4% YoY fall in 9M20 domestic demand for refinery products. Pump prices for gasoline and diesel also fell sharply to THB25.4 and THB20.2, respectively, from THB32.1 and THB24.5 per liter average in 9M19. Capacity utilization also slipped to 81%.
- In 4Q20, the reopening of most business sectors and return to near-normal economic activity suggest better prospects for refineries. For full-year 2020, we estimate the following:
- Dubai Crude price will drop to USD41.5/barrel average in 2020 from USD63.2 in 2019, and Singapore GRM will average only USD0.4/barrel compared to USD3.48 in 2019.
- Demand for refinery products would drop 11.6% in 2020 compared to +2.0% in 2019. Pump prices for gasoline and diesel are forecast to slip to THB27.0 and THB22.4 per liter from THB32.0 and THB24.5 in 2019. Capacity utilization will also slide to 81% from 83% as some refineries had closed for maintenance for longer than expected in 1H20.
Outlook for 2021-2023
- Dubai Crude price will bounce back. The world economy is projected to return to a growth trajectory next year, which would increase demand for oil. This is projected to lift prices to average of USD48 per barrel in 2021, USD54 in 2022, and USD60 in 2023. The market will be buoyed by stronger demand for petroleum products (except aviation fuel because of ongoing travel restrictions), which will widen Singapore GRM to USD0.9-2.5/barrel.
- Domestic pump prices will also rebound. Over the next three years, gasoline price is projected to climb to an average of THB30.0, THB31.5 and THB33.0 per liter, and diesel to THB23.5, THB24.5 and THB26.0 per liter.
- Thai refineries’ earning will recover on stronger domestic demand and wider GRM. The market will be boosted by average 3.0-4.0% average annual increase in the number of vehicles on the road, which would lift demand by 2.8-3.3% annually. No new production facilities are scheduled to come online over the next 3 years, so capacity utilization should continue to average 82-85%.
Ethanol
Situation in 2020
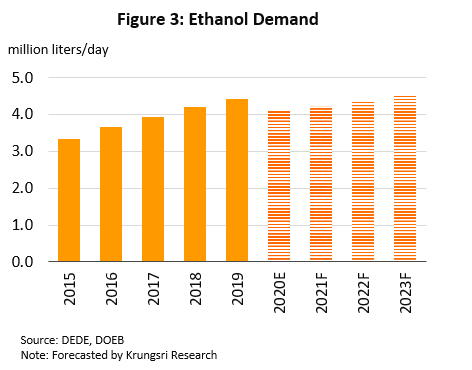
- In 8M20, demand for ethanol fell 9.8% YoY to an average of 3.98 mn liters/day due to global travel restrictions and slower sales of gasohol during lockdown. For the rest of 2020, the reopening of most business sectors government efforts to stimulate tourism will help demand to recover. However, average daily demand will only average 4.13 mn liters, 6.4% below 2019 average.
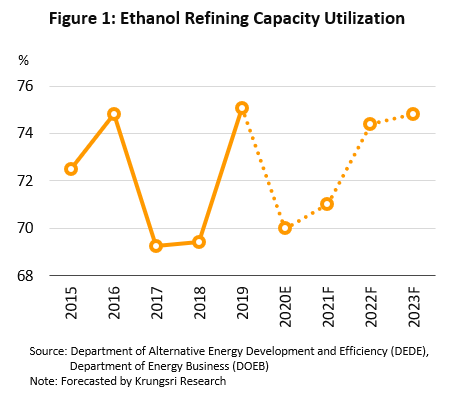
- In the same period, ethanol output fell 8.4% YoY to 4.11 mn liters/day. Of this, 2.59 mn liters were produced daily from molasses, 1.31 mn liters from cassava, and 0.21 mn liters from sugarcane. Overall capacity utilization averaged 69% (down from 76% in 8M19) but for full-year 2020 it should inch up to 70%. But this would still be lower than 75% in 2019.
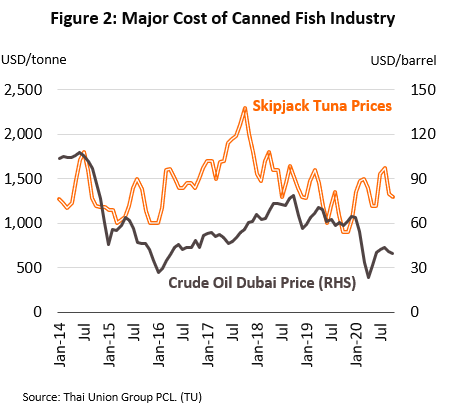
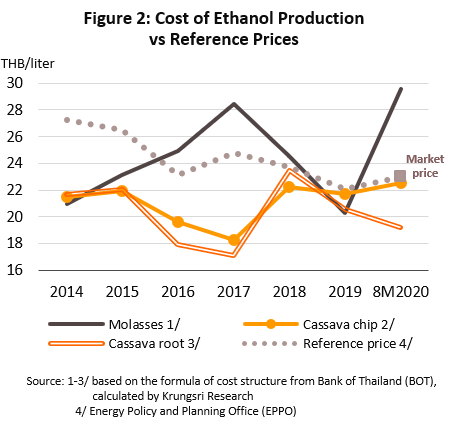
- Manufacturers of ethanol which use cassava root feedstock saw wide margins, but profitability dropped for those who use cassava chips. Although cost of cassava root has dropped by 6.8% YoY, price for cassava chips fell only 1.2% YoY, leaving production costs at THB19.15 and THB21.45 per liter, respectively. However, those who use molasses were pressured by escalating global prices for sugar which pushed up production cost by 38.7% YoY to THB28.16/liter against selling prices of THB24-25 (reference price plus marketing margin of THB1-2/liter).
Outlook for 2021-2023
- Over the next 3 years, demand for ethanol is forecast to rise by 2.3-3.5% per year to 4.3-4.5 mn liters/day. This would be driven by an anticipated rise in sales of E20, from 20% to 30% of total gasohol sales. This is premised on the following:
- The government will encourage use of E20 gasohol (20% ethanol) in place of E10 (10% ethanol) to help the cassava and sugar industries.
- Demand for transport fuel1/ is expected to increase by 3.0% annually as the economy recovers and the national vehicle fleet expands.
- Competition within the industry is manageable and there is no known capacity coming online in 2021-2022. However, capacity could rise in 2023 as Nakhon Sawan Biocomplex starts commercial operations. Given this, over the next 3 years, capacity utilization would average 74-79%.
Biodiesel
Situation in 2020
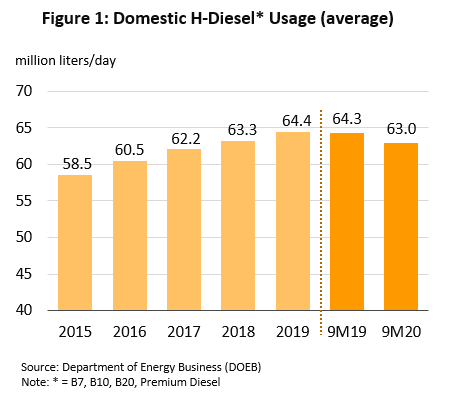
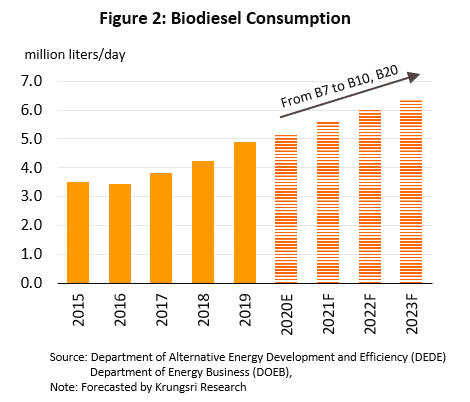
- Domestic consumption of biodiesel (to blend with petrodiesel) rose 7.0% YoY to an average of 5.1 mn liters/day in 9M20. For full-year 2020, demand should reach 5.2mn liters/day, 0.25mn liters more than 2019 daily average. This would be driven by the move to B10 from B7 (i.e., increase biodiesel content from 7% to 10%).
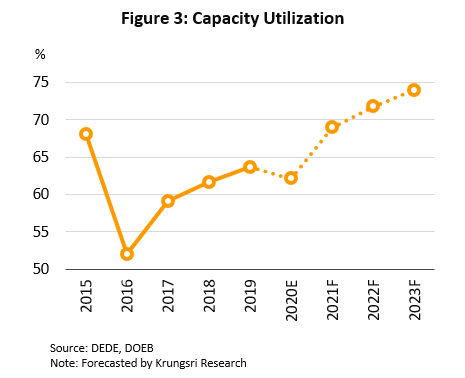
- Biodiesel production rose 1.5% YoY to an average of 5.0 mn liters/day in 9M20. This was largely due to a sharp drop in output during the most severe phase of the lockdown (March-April). Production capacity grew 6.0% YoY to 8.3 mn liters/day, so for full-year 2020, capacity utilization would slip to 62% from 64% in 2019.
- Biodiesel reference price (price at which producers sell to oil traders) jumped 44.5% YoY to THB 29.7/kilogram. The drought had reduced palm oil yields and caused prices of CPO and palm stearin to surge 53.1% and 54.1% YoY to THB25.6 and THB26.2 per kilogram, respectively. Meanwhile, biodiesel-CPO spread for widened to THB4.1/kilogram in 9M20 from THB3.8 average in 2019.
Outlook for 2021-2023
- The biodiesel industry will continue to grow, with demand forecast to rise by 6-9% p.a. to 5.6-6.4 mn liters/day. This outlook is supported by the following:
- There will be new demand from higher biodiesel content in B10 (additional 1.0-1.5 mn liters of daily demand by 2023) and the government will use the Fuel Fund to subsidize prices for B20.
- The number of diesel-powered vehicles registered in Thailand is expected to increase by 4.5-5.0% per year, which will increase demand for diesel products by 5.0% p.a.[1]
- Recovery from the COVID-19 crisis and a rebound in the economy, especially in the transport sector, coupled with greater regional economic connectivity within ASEAN, will boost demand for commercial vehicles.
- Capacity utilization would also rise to 68-74% p.a. on expectations demand will grow more rapidly than production capacity, although new capacity will start to come online after 2021.
PETROCHEMICALS
Petrochemicals
Situation in 2020
- In 10M20, world demand for petrochemical products shrank due to the COVID-19-induced global recession. This pulled down prices and squeezed spreads for most upstream and downstream products, with the exception of some olefins for which spreads widened with greater demand for use in manufacturing packaging and medical goods.
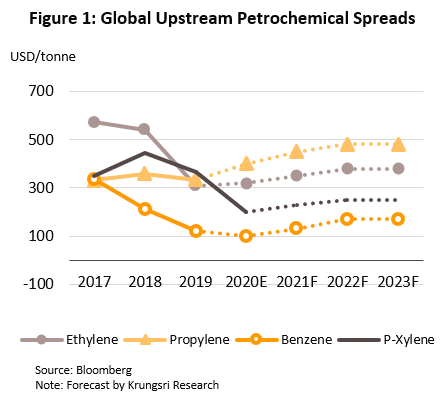
- Naphtha prices averaged USD376.1/tonne, down 27.0% YoY on lower crude prices. Prices should average USD380/tonne in 2020.
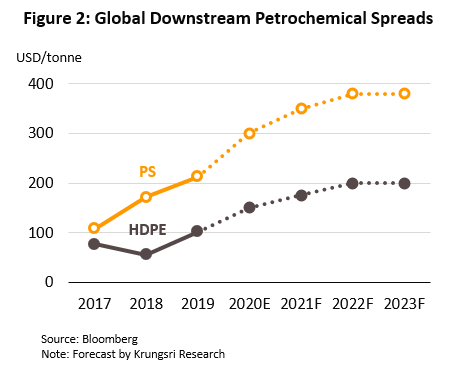
- Upstream petrochemicals: Spreads for ethylene averaged USD290.7/tonne, down from USD331.1 in 10M19, while that for benzene averaged USD103.8 compared to USD123.3 a year earlier. For 2020, spreads are forecast to average USD320 and USD100/tonne, respectively.
- Downstream petrochemicals: Polyethylene (PE) spreads averaged USD147.3/tonne, up from USD99.9 in 10M20, and polystyrene (PS) spreads rose to USD292.1 from USD213.2. For 2020, PE and PS spreads are expected to average USD150 and USD300 per tonne, respectively.
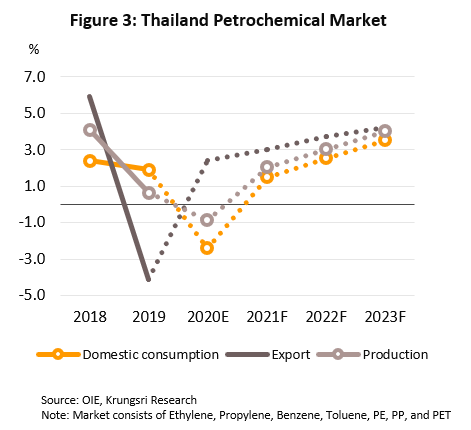
- Domestic demand for petrochemicals fell 3.3% YoY in 10M20, declining for most categories as downstream demand contracted sharply with the lockdown. For the rest of 2020, the situation should improve with a rebound in industrial activity, and for the year, demand is forecast to slip by 2.4%.
- Prices for upstream and downstream goods will weaken in 2020. This will pressure operators’ revenues because the majority operate across the supply chain. However, prices for aromatics will fall faster and take longer to recover than olefins.
2021-2023 Outlook
- A recovery in the global economy will lift demand, and in turn, prices and spreads.
- Prices for naphtha will rise to USD 420-480/tonne driven by: (i) higher crude prices; and (ii) opening of new petrochemical facilities and a South Korean plant resuming production (that uses naphtha as input).
- Ethylene spreads will widen to USD350-380/tonne, but new production capacity coming onstream in 2021 and high inventory levels in China will keep benzene spreads at USD130-170/tonne.
- Spreads for polyethylene will widen but new capacities in China and Southeast Asia will cap these at USD175-200/tonne. Polystyrene spreads would rise to USD350-380/tonne.
- Stronger spreads for main products will boost operators’ earnings, while higher demand for plastic resins by downstream industries, including auto parts & assembly, construction and medical supplies, is expected to raise domestic and export demand by 1.5-3.5% and 3.0-4.2% p.a., respectively.
CHEMICAL
Pharmaceuticals
Situation in 2020
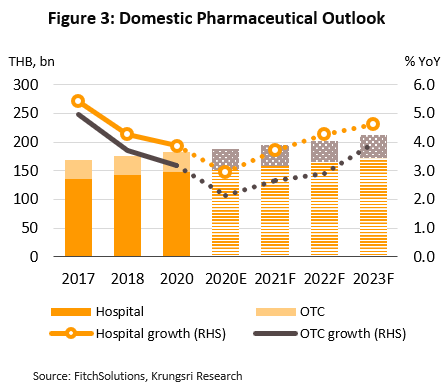
- The Thai pharmaceuticals industry is focused on downstream production, generally generic drugs made from imported active ingredients. About 90% is sold in the domestic market. This year, fears of contracting COVID-19 and social distancing measures had reduced visits to hospitals (main distribution channel) by both Thai and foreign patients. This had dampened demand. For full-year 2020, growth should reach 2.0-3.0%.
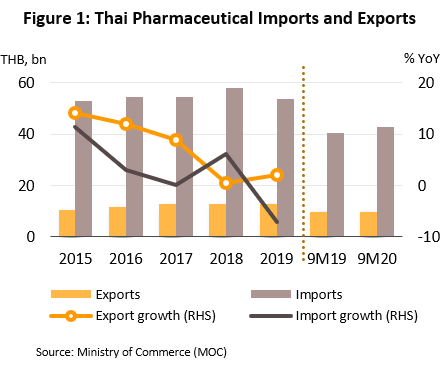
- In 9M20, the value of the domestic pharma market[1] rose 1.6% YoY following the COVID-19 pandemic and greater demand for analgesics, anti-inflammatories and anti-fever medications. However, the value of exports slipped 0.4% YoY to THB9.8bn, with exports to the Philippines, Lao PDR, Hong Kong, Malaysia and Singapore (combined 24.3% of exports by value) contracting 11.0% YoY, though combined exports to Vietnam, Myanmar and Japan (61.3% of exports) rose by 5.2% YoY.
- Production[1] grew 6.8% YoY by volume, led by a rise in the output of pills and capsules (analgesics, anti-inflammatories and fever medications). Imports edged down 2.7% YoY by volume but rose 6.1% YoY by value to THB43bn. Imports (by value) from Germany (14% of imports of pharmaceuticals) and India (8.6% of imports) rose by 3.9% and 9.9% YoY, respectively, but this was mainly due to price hikes. By volume, imports from these countries fell. However, those from China (2.8% of imports) rose in both volume (+19.7% YoY) and value (+11.5% YoY), most of this being for active ingredients for use in the production of generic analgesics and anti-fever medications.
Outlook for 2021-2023
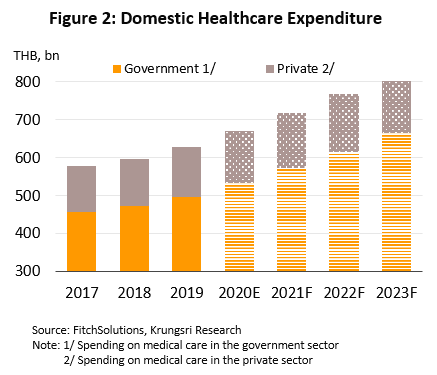
- The value of the domestic market is forecast to grow by 3.5-4.5% annually. This would be led by stronger demand, resulting from: (i) more incidence of ill-health, especially chronic non-communicable conditions (NCDs) that need to be treated with expensive imported medicines, and an aging Thai society; (ii) extension of the government health insurance scheme across the population, which has led to rising expenditure on medicines; (iii) after a sharp drop in 2020, foreign patients will start to return to Thai hospitals; and (iv) following the COVID-19 pandemic, there are rising concerns over personal health. Exports will also strengthen, especially to ASEAN region where there is more confidence in Thai-made pharmaceuticals following Thailand’s admission to the GMP PIC/S scheme[2].
- But competition could also intensify on: (i) greater imports of low-cost Chinese and Indian medicines; (ii) entry of new (especially overseas) players to the domestic market, e.g., Japanese corporations which will produce in Thailand for export back to their home country to penetrate the CLMV market; and (iii) Thai businesses in other economic sector expanding into pharmaceuticals. Production costs will also rise due to: (i) the need to upgrade facilities to meet GMP-PIC/S standards; and (ii) higher prices for imported medicines and active ingredients because of the inflationary effect of COVID-19 on chemical inputs.
Chemical Fertilizers
Situation in 2020
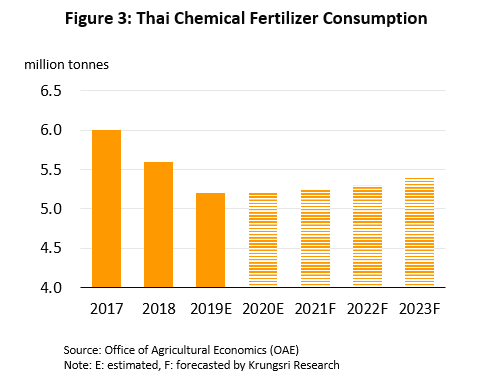
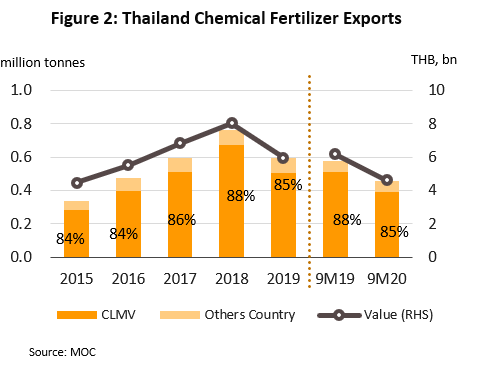
- In 9M20, demand for fertilizer for use in fertilizer-intensive commercial crops (e.g., oil palm, rubber and off-season rice) remained steady as heavy rain in 3Q20 allowed more planting. For all of 2020, demand is expected to reach 5.0-5.2 million tonnes, close to that in 2019.
- In 9M20, imports of straight fertilizer (65.5% of total fertilizer imports by volume) and mixed fertilizer (34.5% of imports) rose 3.0% YoY to 4.3 million tonnes valued at THB38bn (-10.5% YoY). This higher imports was driven by heavier rainfall in 3Q20 which led to more extensive cultivation, which required the use of more fertilizer (+37.4% YoY in the quarter). Rising prices for many agricultural products also stoked greater demand. Hence, following a 3.2% drop in 2019, fertilizer imports is forecast to rise by 2.0-3.0% to 5.3 million tonnes in 2020.
- Retail prices for fertilizer[1] also weakened in 9M20. Price for urea (used on rice and most other crops) fell 5.1% YoY in line with prices on world markets which have been affected by COVID-19. Hence, earnings for manufacturers and distributors should weaken in 2020.
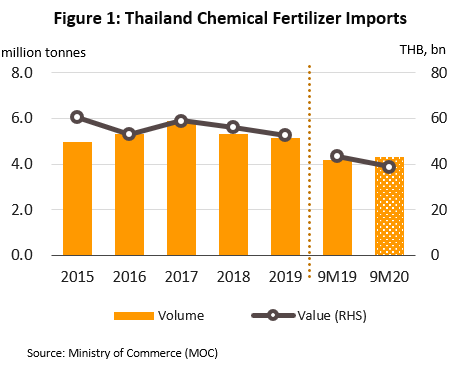
Outlook for 2021-2023
- Demand for fertilizer is forecast to grow by an average of 2.0-3.0% per year to 5.2-5.4 million tonnes. The incremental demand would be driven by higher prices for agricultural goods and an expected expansion in cultivated area: (i) crops that require heavy fertilizer application, including rice, corn for animal feed and cassava, account for a combined 60% of total fertilizer demand; and (ii) crops with high per unit application rates, including oil palm and rubber.
- Operators will try to build additional revenue streams and strengthen their business by expanding marketing and distribution channels. They include selling greater value-added products (e.g., by offering custom fertilizer mix) and increasing exports to neighboring countries. However, there are several challenges, including rising interest in organic farming and the use of bio-fertilizers, which could reduce demand in the future.
AUTOMOTIVE & PARTS
Automobiles
Situation in 2020
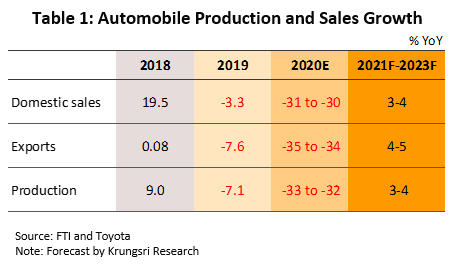
- Domestic auto output fell 38.8% YoY to 960,000 units in 9M20 because the global supply chain had been disruption by COVID-19. The pandemic also caused domestic sales to drop by 29.8% YoY to 0.53 million units as consumers cut unnecessary expenditure, lenders tightened new credit approvals, and the lockdown business closures and drought (upcountry) reduced spending power. Exports also struggled, with sales falling 36.5% to 0.52 million units and value by 32.3% YoY to USD9.38bn. Shipments to major overseas markets suffered, including to the Philippines (-48.3% YoY), Vietnam (-48.0% YoY) and Australia (-30.9% YoY). However, exports to Japan and China bucked the trend, rising by 141.8% and 51.7% YoY, respectively.
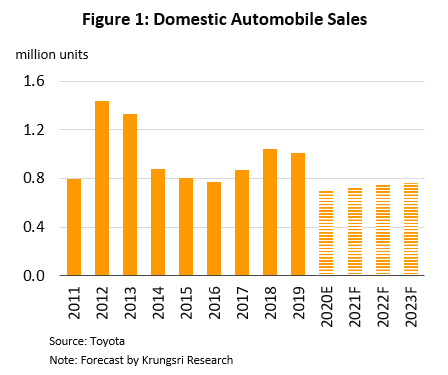
- For the rest of 2020, output and sales should drop by a smaller magnitude as supply chains are gradually restored, and domestic and export markets come back to life. As such, for 2020, output is expected to fall by 32-33% to 1.35-1.37 million units. Domestic sales will drop by 30-31% to 0.70-0.71 million units and exports will fall by 34-35% to 0.69-0.70 million units.
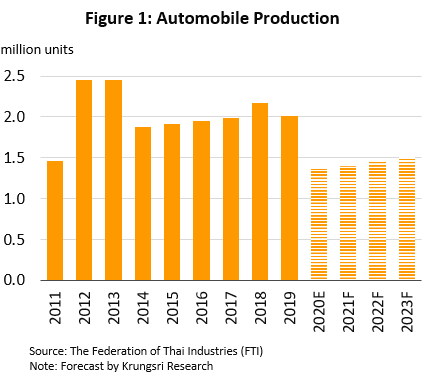
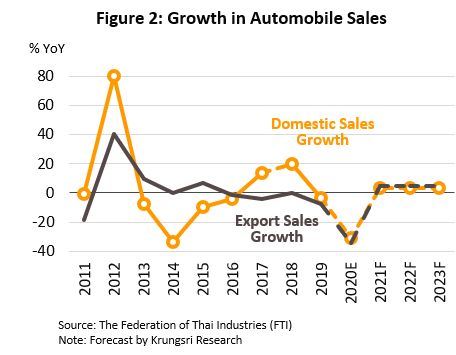
2021-2023 Outlook
- Industry output is forecast to rise by 3.0-4.0% annually over the next 3 years. This would be supported by the following:
- Domestic sales will rise by an average of 3.0-4.0% per year, premised on a brighter economic outlook. The would be strong demand for commercial vehicles with accelerating construction activity, online sales, and expansion in the logistics sector. Manufacturers also plan to stimulate the market with a steady stream of new models and offering both internal combustion engines (ICE) and electric vehicles (EVs). However, sales (demand) would be capped by a slow economic recovery which would limit growth in consumer spending, high levels of household debt, and a still-tight lending environment.
- Exports should recover at a faster rate of 4.0-5.0% per year as economies in overseas markets rebound. Exports to ASEAN will also be helped by the Free Trade Area and Mutual Recognition Agreement that cover safety tests for autos & parts; it removes the need to test goods moving between signatory countries. However, there is lingering uncertainty over US-China trade relations and the Philippines (a major export market for Thai auto makers) might hike duties on vehicles imported from Thailand in retaliation for Thailand taking a case to WTO against the Philippines for allegedly under-declaring the value of cigarette exports. The rising popularity of EVs worldwide could also have an impact on Thai auto exports, most of which are ICE vehicles.
- Dealerships of New Vehicles
Situation in 2020
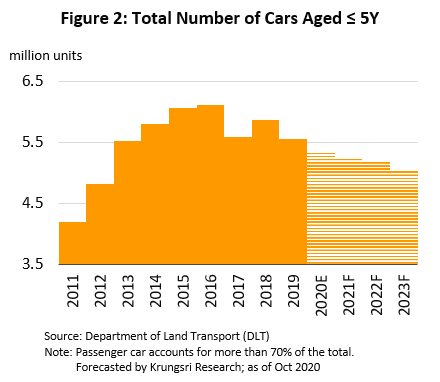
- Domestic sales fell 29.8% YoY to 0.53 million vehicles in 9M20 because of the pandemic-induced temporary shutdown of most economic activity. This had stoked greater price competition as players looked to sell inventory. Revenues from services and sale of spare parts also fell following a 3.1% drop in the number of vehicles (to 5.2 million) on the road that are under 5 years old.
- In 4Q20, business conditions will remain depressed. For full-year 2020, distributors’ revenues will fall sharply due to weak consumer spending power and tight credit conditions. In 2020, sales of new vehicles will drop by 30-31% (to 0.70-0.71 million units). Revenue from services and parts will also fall by 4% relative to 2019, with an equivalent drop in the proportion of national vehicle fleet that is 5 years old or newer.
2021-2023 Outlook
- Overall revenue growth will be limited, with receipts from new vehicle sales rising by only 3.0-4.0% per year. Revenues from service centers and sale of spares is projected to weaken with fewer cars on the road that are less than 5 years old. Although older cars or those with higher mileage will require more servicing, many owners prefer to use general mechanics because they are normally cheaper. Margins will also be pressured by auto makers by: (i) requiring dealers to invest in upgrading showrooms and service centers; and (ii) greater online sales activity, which may increase competition between distributors.
Situation in 2020
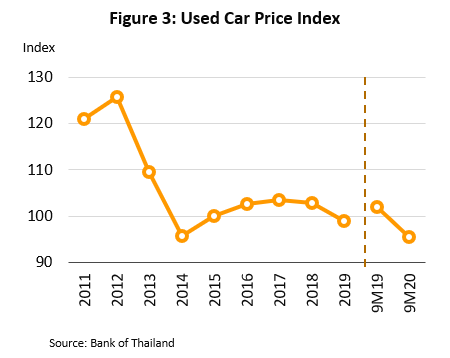
- Conditions were sluggish in 9M20, as reflected in the 6.5% YoY drop in the Index of Used Car Prices. This was caused by slow sales, which encouraged sellers to cut costs (e.g., interest and maintenance) by selling inventory units. To do this quickly, they have to compete on price. Prices also fell because the First-Car Program had induced an exceptionally large supply of used cars in 2018-2020, and there will be more used (repossessed) vehicles for sale during the 2020 recession.
- The market for used vehicles should recover slightly in 4Q20. For full-year 2020, total unit sales would rise slightly. The drop in prices of used vehicles has attracted more buyers to the market, especially individuals who want to avoid using public transportation, or who need a vehicle for work but cannot afford a new car. Sales are also helped by dealers actively conducting marketing campaigns and building up consumer confidence by raising the standard of their goods, providing checks and quality guarantee to buyers, and expanding their online marketing and sales channels.
2021-2023 Outlook
- Sales is projected to grow in line with a recovery in consumer spending power. Prices will rise because the supply of used vehicles bought under the First-Car Buyer Scheme has peaked in 2017-2019 and will start to drop. New entrants to the industry (from overseas, as well as auto makers) will also stoke competition and threaten players’ margins, most of which are SMEs.
Motorcycles
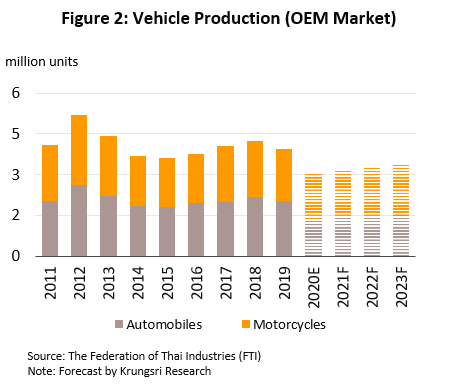
Situation in 2020
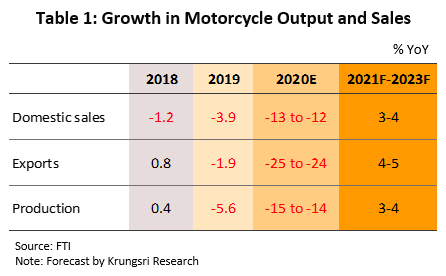
- Motorcycle output dropped by 23.5% YoY in 9M20 to 1.11 million units. Domestic sales (80% of the market) also fell but at a slower rate of 13.7% YoY (to 1.15 million units) as the weak economy and drought ate into spending power of the core markets (non-farm laborers and farmers). Exports fell 14.0% YoY to 0.23 million units, largely due to the COVID-19 impact and on both the global economy and Thailand’s main export markets. However, by value, exports jumped 17.9% YoY to USD1.39bn led by stronger shipments pricier ‘big bikes’. By individual markets, nearly 70% of export proceeds were derived from China, Japan and the EU, which saw increases of 137.3%, 44.2% and 27.0%, respectively.
- Sales will drop by a smaller magnitude as economic activity improves gradually. However, still-high household debt will weigh on demand because the target market is low- and middle-income earners. Exports will also be hit by the second wave impact on consumer purchasing power in several countries. For full-year 2020, we estimate output will drop by 14.0-15.0%, domestic distribution will contract by 12.0-13.0% and exports by 24.0-25.0%.
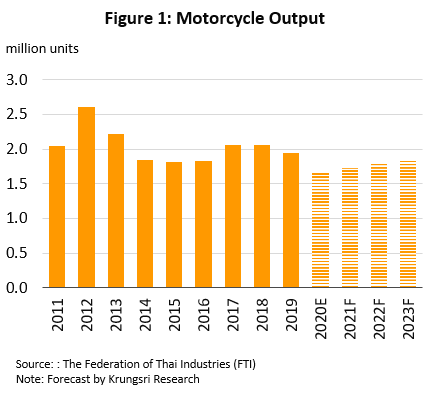
2021-2023 Outlook
- Domestic sales should rise by 3.0-4.0% annually, as the economy recovers. Sales will also be supported by the Royal Enfield factory (originally a British brand but now Indian) in Thailand that will start producing for the Thai market from mid-2021. Exports will also rebound, rising by 4.0-5.0% annually as economies overseas recover. However, this will also be helped by the Thailand-based Harley Davidson factory which is assembling motorcycles for export. The US-China trade conflict also present opportunities for Thai exporters. Hence, we estimate overall output will grow by 3.0-4.0% per year over the next 3 years.
-
- Dealerships of Motorcycles
Situation in 2020
- In 9M20, revenues fell along with slower domestic unit sales. Receipts from services and sale of spares rose, likely due to with the increasing number of motorcycles in Thailand (currently 21 million), as well as greater demand for repairs to extend the life of older machines because of weaker income prospects.
- Revenue from sales of new motorcycles will improve slightly in 4Q20, thanks to abating drought conditions and rising farm incomes. Receipts from repairs of older motorcycles should also continue to rise.
2021-2023 Outlook
- The domestic market is expected to remain weak, which will limit revenue growth for distributors. However, receipts from service centers and repairs should continue to surge given the large number of motorcycles, as well as older motorcycles, on the road. The core market for motorcycles are farmers and non-farm laborers who are typically low- and middle-income earners. They have been hardest hit by the pandemic, so players will be exposed to the risk of some loans becoming NPLs. The exception would be distributors of ‘big bikes’ because these are generally bought by high-income earners, who are less sensitive to changes in health of the economy.
Auto parts
Situation in 2020
- Auto parts manufacturers’ output contracted sharply in 9M20, as reflected in the 29.2% YoY slide in the industry’s Manufacturing Production Index. The drop was significant in the original equipment manufacturer (OEM) segment, which was hit by the 38.8% YoY drop in auto output (to 0.96 million units) and 23.5% YoY drop in motorcycle output (to 1.11 million units). But, the replacement equipment manufacturer (REM) segment strengthened with a larger national vehicle fleet (Table 1). Exports of auto parts also worsened, slipping 18.5% YoY to USD12.6bn. Falls were recorded in major export markets, including ASEAN zone (-26.7% YoY), Japan (-21.1% YoY), EU (-11.5% YoY) and the US (-0.41% YoY); these four markets account for a combined 62% of the total value of auto parts exports. However, the ongoing US-China trade conflict led to larger shipment of auto parts to China (+9.6% YoY) and Hong Kong (+20.8% YoY); these two markets comprise 8% of exports.
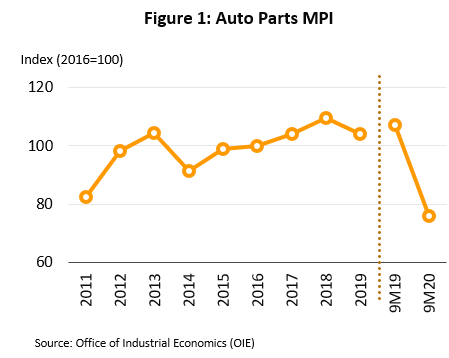
- For the last quarter of 2020, the recover in auto and motorcycle assembly industry will slow the decline in auto parts output. But in 2020, the OEM market is still expected to contract by 32.0-33.0% for the auto market and by 14.0-15.0% for the motorcycle market. On the other hand, the REM market will continue to grow with greater demand for repairs as vehicles age and mileage rise. The economic uncertainty will also support demand for REM parts to extend the life of older vehicles on the road[1]. Overall, these trends will shrink the domestic market for auto parts, and export markets will also weaken as overseas economies continue to struggle to recover.
2021-2023 Outlook
- Over the next 3 years, the supply of and demand for auto parts will see weak growth. Output of new autos will rise slowly, which will limit any expansion in the OEM market. On the flipside, the REM market will continue to be buoyed by the rising number and aging vehicles registered in Thailand; especially, those bought under the First-Car Buyer Scheme will be 8-9 years old in 2021 and will need to replace or repair major, high-value parts such as engine and drivetrain. Exports will also grow, but also at anemic rates, determined by global trends in new vehicle sales. Euromonitor projects growth at 9.2% in 2021 but this would slow to 5.4% in 2022 and only 1.8% in 2023. However, the extended US-China trade conflict could create opportunities for Thai manufacturers to sell more auto parts to the US, China and Hong Kong.
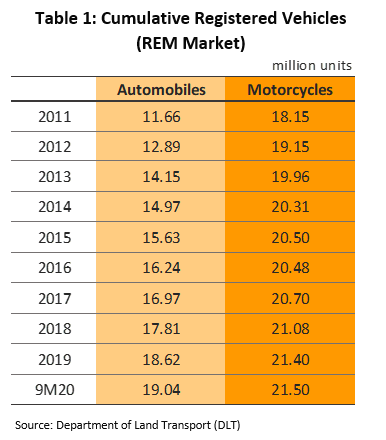
ELECTRONICS & ELECTRICAL APPLIANCES
Electronics
Situation in 2020
- In 9M20, output of HDDs edged down, reflected by a 2.0% YoY drop in the industry’s Manufacturing Production Index (MPI). This was in line with the 1.6% YoY drop in global sales of PCs, most of which still use HDDs. In 1Q20, the lockdown in China triggered the temporary shutdown of production lines and caused exports to crash by 59.8% YoY. Orders shifted from China to Thailand, lifting Thai orders by 23.5% YoY, but China had quickly brought the outbreak under control and production has returned to normal. Hence, Thai exports also dropped back to regular levels. For 9M20, these factors led export value to rise by only 1.3% YoY.
- Production and export of HDDs will continue to weaken in the rest of 2020. This is due to a still-weak global economy and falling sales of PCs. The latter is forecast to drop by 9.8% in 2020, but sales of notebooks are expected to rise by 15.8% (IDC, September 2020) as more employees work from home and educational classes move online. However, notebooks are increasingly being equipped with solid state drives (SSDs), not HDDs. Hence, for full-year 2020, HDD output and exports would drop by 1.0-2.0% YoY
.
2021-2023 Outlook
- HDD output will expand slightly over the next 3 years, and exports value would rise by 2.0-3.0% per year. This would be mostly driven by rising demand for large-capacity HDDs for use in cloud computing and data centers. There has been surge in big data services because the COVID-19 crisis is driving demand for cloud-based services[1] that allow users to work and/or study anywhere. However, the market will suffer from the uncertainty in US-China trade relations and long-term trend to replace HDDs with SSDs. The IDC (September 2020) sees the global PC market shrinking by 2.0-4.0% annually over 2021-2023.
- Integrated Circuits (IC)
Situation in 2020
- In 9M20, the MPI for ICs slipped 0.9% YoY, while IC export value dropped by 7.1% YoY to UD 5.20bn. This contrasted with the global semiconductor supply, which expanded by 5.8% YoY. This was because COVID-19 had disrupted the supply chain,, which robbed the industry of inputs from several countries, including China and South Korea. National lockdowns in export markets also affected production and transportation.
- Both output and exports of ICs will remain weak in 4Q20 on as COVID-19 continue to hurt the world economy and there is still uncertainty over US-China trade relations. The latter has had mixed impact on the electronics industry, and while some players have benefitted from trade diversion to Thailand, some have lost out because of the positions in supply chains linked to both countries. In 2019, Thailand’s major electronics export markets were Hong Kong, China and the US, with market shares at 24%, 10% and 7%, respectively. For full-year 2020, IC output and export value is projected to shrink by 4.0-5.0%.
2021-2023 Outlook
- ICs export value will move in step with production, with both rising by an average of 3.0-4.0% p.a. Growth will be supported by an estimated 6.2% increase in the global supply of semiconductors in 2021 (WSTS, May 2020). And in developed economies, by the rapid rollout of 5G networks (Gartner, July 2020), for which investment is forecast to rise by 19% in 2021. This will create a launch pad for the growth of Internet of Things, which will increase demand for ICs.
Electrical Appliances
Situation in 2020
- Output of electrical appliances dropped by 9.0% YoY to 35.39 million units in 9M20, with domestic consumption slipping 7.6% YoY to 11.15 million units as a result of the COVID-19-induced recession and subsequent weakening of consumer spending power. Sales fell for most product groups, notably washing machines (-12.0% YoY) and rice cookers (-3.8% YoY), in line with a weaker housing market. However, warmer temperatures and greater work-from-home activity pushed up sales of cooling devices. Sales of refrigerators rose 5.2% YoY, and air conditioners 1.9% YoY. In the same period, export value dipped 7.0% YoY to USD17.1bn. Washing machines racking the largest drop (-13.2% YoY) largely because the US has restricted imports of Thai washing machines, and its market share had been shrinking since February 2018. In 2017, the US accounted for 33% of the value of all exports of washing machines, but in 9M20 it shrank to 14%.
- For the rest of the year, both the domestic and export markets should start to improve, along with a recovery of the domestic and global economies. On this note, we estimate domestic sales volume and export value would contract by 3.0-4.0% and 4.0-5.0%, respectively, in 2020.
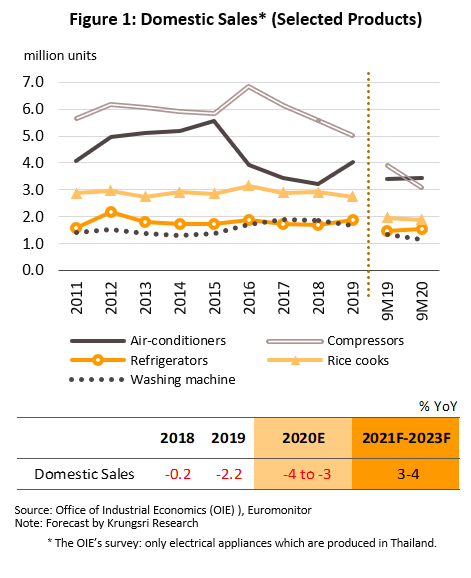
2021-2023 Outlook
- Over the next 3 years, domestic sales volume of electrical appliances is forecast to rise by 3.0-4.0% per year, along with a recovery in the economy and real estate market. Specifically, climate change and rising temperatures will increase demand for air conditioners. The market will also be boosted by the release of new devices that employ Internet of Things (IoT), regular sales promotions by distributors, and rising online sales platforms which gives users wider access to product information to make purchase decisions.
- Exports will also grow in the coming period, but a slightly slower rate of 2.0-3.0% per year. Generally low ownership of electrical appliances in much of Asia suggests there is ample room for sales to grow across the region. The extended US-China trade war wis an an opportunity for Thai manufacturers to increase shipments to the US to replace goods from China. They could include air conditioners, refrigerators, cookers and microwaves.
OTHER INDUSTRIES
Medical Devices
Situation in 2020
- Thailand is the leader in the medical devices market in ASEAN. The bulk of the industry’s exports are single-use devices, although most exporters are foreign operations that use Thailand as a production base to export back to their home country (e.g., Japan, the US and France). In 2020, the value of goods distributed domestically is estimated to grow by 3.0%, down from 5.5% in 2019. Exports contracted by 1.3% in 2019, but are projected to jump 35-40% in 2020 because COVID-19 has triggered higher demand for disposable medical supplies.
- In 9M20, exports jumped 40.1% YoY to THB112bn led by rapid growth especially in Japan and China markets. There was stronger demand for all product categories, with sales growing 42.6% YoY for single-use devices (89.9% of exports by value), 15.5% YoY for durable medical devices (8.5% of exports), and 69.1% YoY for reagents & test kits (1.6% of exports).
- 9M20 imports also rose, by 17.1% YoY to THB61bn. Again, this was seen across all products. Imports grew 16.2% YoY for durable medical devices (42.2% of imports by value), 38.1% for single-use devices (38.1% of imports), and 40.6% YoY for reagents & test kits (19.7% of imports).
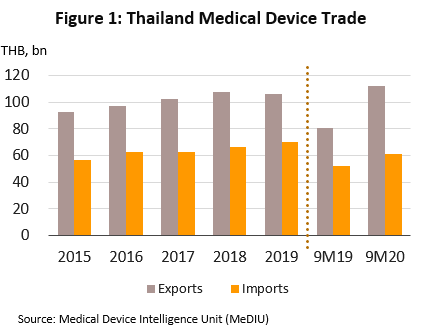
- The industry’s Manufacturing Production Index (MPI) fell 17.4% YoY in 9M20. This reflected the impact of the lockdown in April and May which had hurt output, especially high-value durable goods. However, production of disposable goods (e.g., facemasks, surgical gloves and diagnostic sets) surged to meet much stronger demand from domestic and international markets. Manufacturers also benefitted from short-term investment support introduced to address the COVID-19 crisis.
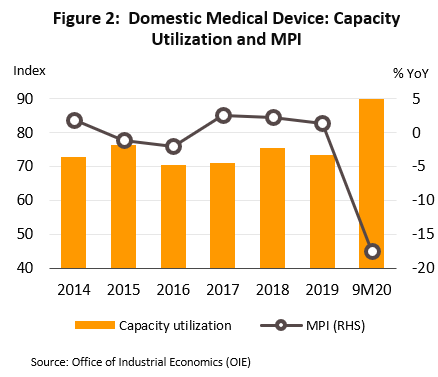
2021-2023 Outlook
- The medical devices market will see steady growth, and the value of domestic sales and exports will grow by 7.5% and 4.2% per year, respectively. This outlook is supported by: (i) rising number of people with ill-health, especially heart disease, stroke, cancer, and diabetes, and an aging society, which will increase demand for modern diagnostic equipment and more advanced technology; (ii) investment by private-sector hospitals to expand existing facilities and open new branches, which means they need to buy more medical equipment; and (iii) incentives to encourage companies to invest in the manufacture of medical equipment.
- Investments will continue to flow into the industry from overseas players, supported by the BOI investment promotion schemes and waiving of customs duties on imports of parts and materials for R&D. In addition to feeding the continued growth of the industry, rising investment will also stoke competition, especially for SMEs, which comprise the majority of players in the sector. In 1H20, the BOI received 18 applications for investment support from foreign players, with a combined value of THB1.45bn.
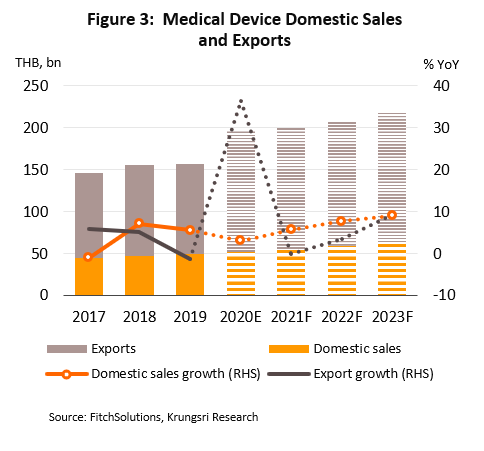
CONSTRUCTION & CONSTRUCTION MATERIALS
Construction Contractors
Situation in 2020
- In 9M20, public construction spending rose 5.6% YoY to THB607.5bn led by greater investment in ongoing megaprojects including extensions to Bangkok’s metro system on the Eastern Orange Line (Cultural Center-Minburi), Pink Line (Khae Rai-Minburi), and Yellow Line (Lat Phrao-Samrong), and the dual-track railway. However, private construction spending slipped 2.9% to THB431.0bn as developers held back residential projects due to weaker purchasing power and tighter credit conditions. Construction of new commercial and industrial properties also slowed with worsening trade and private investment.
- In 4Q20, public construction spending will continue to rise, led by ongoing work on Bangkok’s metro system and the dual-track railway. Funding is also going to local projects across the country, e.g., 2,000 projects to repair and upgrade regional roads. For private construction spending, developers tried to sell off inventory units, which means investment remained sluggish. Hence, applications for construction permits for residential, commercial and industrial property fell by 39.2%, 60.9% and 48.2% YoY in 8M20, respectively. For full-year 2020, total construction spending is forecast to grow by only 1.5% to THB1.32trn, comprising THB765.2bn from the public sector and THB556.2bn from the private sector.
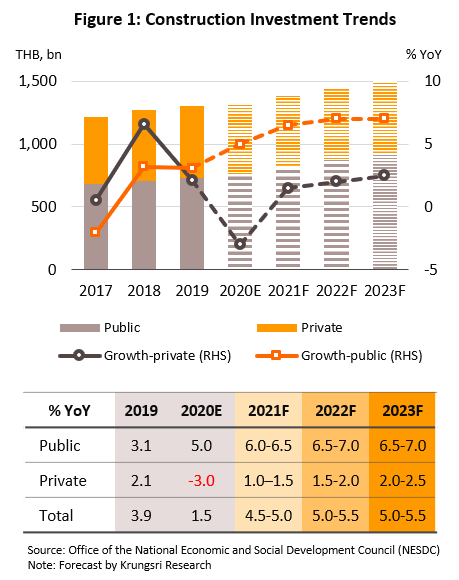
2021-2023 Outlook
- Total construction spending is expected to grow by 4.5-5.0% in 2021 and by 5.0-5.5% in 2022-2023. This would be mainly driven by government spending on megaprojects, especially those connected to EEC, which would pull in more private-sector investment.
- Public construction spending is projected to grow by 6.0-6.5% in 2021 and by 6.5-7.0% in 2022-2023. This would be supported by megaprojects in the EEC from 2021, and include the following: (i) Phase 1 (Suvarnabhumi-U Taphao) of the high-speed rail link to connect three major airports (Don Muang-Suvarnabhumi-U Taphao); (ii) Phase 3 of Map Ta Phut and Laem Chabang Port development, scheduled for construction once land reclamation work is complete; and (iii) construction of a new passenger terminal at U Taphao. Projects in other areas include the Bangkok-Nakhon Ratchasima high-speed rail line, the BTS Western Orange Line (Bang Khun Non-Cultural Center), Southern Purple Line (Tao Poon-Rat Buruna), and extensions to the dual-track railway and Bangkok metro system.
- Private construction spending will return to 1.0-1.5% growth in 2021, 1.5-2.0% in 2022, and 2.0-2.5% in 2023, This would be supported by: (i) crowding-in effect of strong public-sector spending (ii) greater demand for factories and industrial space in the EEC, with the Rojana Nong Yai Estate in Chonburi and EGCO Estate in Rayong slated for construction in 2021; and (iii) an uptick in construction of residential property, especially low-rise units in Bangkok suburbs to accommodate real demand.
- Construction contractors will adapt by cutting costs and dropping prices to compete for public- and private-sector contracts. Large players with greater negotiating power will have an advantage. SMEs will largely depend on their ability to sub-contract for larger companies, which could make their earnings uncertain.
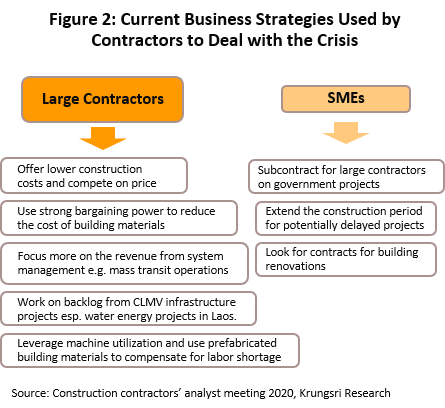
Construction Materials
Situation in 2020
- In 9M20, output and domestic sales of construction materials fell almost across the board. Demand was depressed by the sudden economic slump and 10.3% YoY contraction in private-sector investment (real estate performed badly). This reduced sales of ceramic tiles and sanitary wares by 5.0% and 14.4% YoY, respectively. Sales of construction steel also fell 15.9% YoY, but sales of cement rose slightly on greater demand from the public sector. In 4Q20, the sluggish real estate market will continue to weigh on demand, but there will be more orders for materials for use in public-sector construction projects. For full-year 2020, domestic sales will drop YoY.
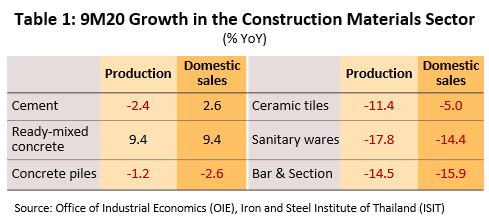
- Exports also struggled in 9M20 because of COVID-19 impact and the subsequent sharp contraction in the world economy. Cement exports fell 8.7% YoY to 10.0 mn tonnes, generating THB13bn (-17.3% YoY), with weaker shipments to the main markets Bangladesh (-31.8% YoY) and Cambodia (-32.2% YoY). Exports of steel bars and section crashed 41.2% YoY, with drops recorded across the major markets of Lao PDR, Indonesia and Singapore. For imports, that for steel bars and sections slumped 38.0% YoY to THB4.0bn (-48.8% YoY). Cement imports fell 21.7% YoY to 760,000 tonnes valued at THB1.4bn (-24.8% YoY). However, operators worked hard to run down stock, and hence, imports of sanitary wares bucked the trend and grew 5.5% YoY to 29,000 tonnes, although import value, fell 9.1% YoY to THB1.0bn. For full-year 2020, exports would continue to slide, but imports, especially ceramic tiles from China, will pick up.
- The Construction Materials Price Index (CPMI) slipped 2.4% YoY in 9M20. The sharpest drops were recorded in steel and steel products (-12.1% YoY) due to weak prices in world markets because of a severe supply glut. In 4Q20, prices are unlikely to rise significantly. So for all of 2020, the CPMI will lose ground from 2019 level.
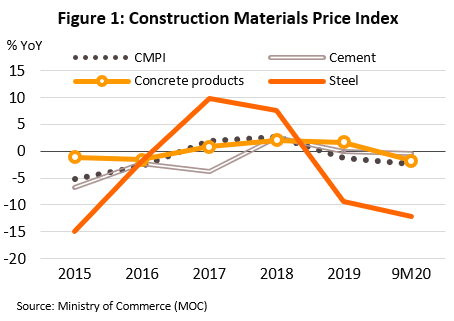
2021-2023 Outlook
- Domestic market: Demand is projected to rebound, driven by the following:
- Government spending on construction will grow 6.0-7.0% p.a., backed by both ongoing and new projects, including the Don Muang-Suvarnabhumi-U Taphao high-speed rail link, and extensions to the Red and Southern Purple (Tao Poon-Rat Burana) lines.
- Private-sector construction spending will rise by 1.5-2.0% per year, driven by (i) more real estate projects, including new housing estates, rental office space, hotels, and shopping centers, and (ii) progress in the EEC project, which will increase demand for factories and industrial estates.
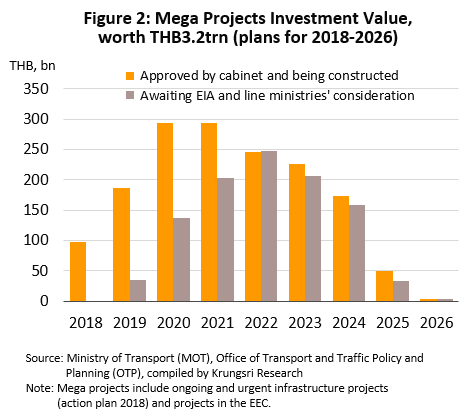
- Exports should grow slightly as the CLM countries continue to invest in infrastructure. However, Siam Cement Group and Siam City Cement have set up factories in neighboring countries; that would reduce exports from Thailand but group profits will not be affected.
- Prices: This should rise slightly, especially for cement and concrete products which will see stronger demand for use in government infrastructure projects. However, prices of steel bars and section could remain depressed due to the supply glut continues to hurt world markets.
- Manufacturers: Revenues are projected to rise. Manufacturers of basic products (i.e., cement and construction steel) will benefit from an uptick in private and public sector projects. Producers of ready-mixed concrete and concrete products will also see an improvement with a rebounding in the real-estate sector and a 5.0% annual increase in the number of new developments. However, manufacturers of ceramic tiles and sanitary wares will face greater competition from imports of relatively cheaper goods from China and Vietnam.
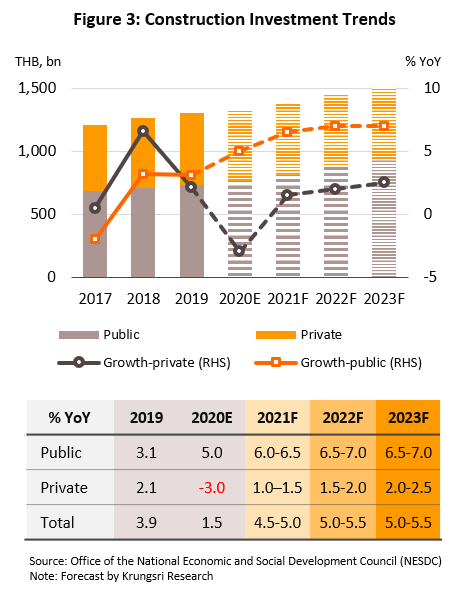
- Traders:
- Modern trade operators will enjoy a recovery in sales, as consumers increasingly prefer to shop at retail outlets that offer a comprehensive range of products. Many modern traders have also expanded their revenue sources by offering home installation and repair services to customers. Some companies, such as HomePro and Global House, also have plans to build long-term revenue streams by expanding overseas.
- Traditional distributors of construction materials will continue to face depressed conditions. (i) For wholesalers, revenues will remain flat or decline. The pandemic has adversely affected liquidity for many, and players are now struggling to bounce back. This segment also relies on sales to low-income customers, many of whose income have been hurt by the COVID-19 crisis. Wholesalers also face competition from modern trade outlets and manufacturers that distribute directly to construction companies. (ii) Traditional retailers are usually small operations (there are many) and usually have financial limitations, which restricts the range of products they can offer. This segment also has to deal with rising competition from modern retail operations, so players will need to adjust their business models.
Steel
Situation in 2020
- In 9M20, demand for hot-rolled coil HRC, the most important flat steel product, fell 24.2% YoY to 3.7 mn tonnes. The pandemic had forced downstream customers – especially the auto industry - to cancel orders. The auto industry saw sharp drops in output, domestic sales and exports. For the rest of the year, demand from the most important industries (auto assembly and electrical appliances) will recover slightly. But for full-year 2020, demand for HRC will shrink by 12.0-13.0% to 5.7 mn tonnes.
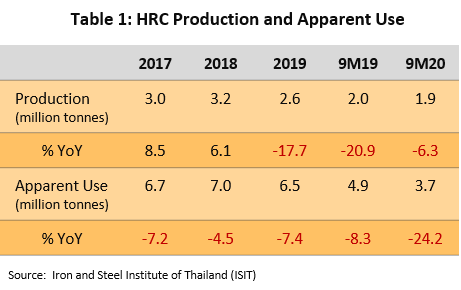
- Export volume jumped 41.2% YoY in 9M20. Exports of HR sheet (less than 3 mm thick) surged 148.1% YoY on strong orders from Morocco and Myanmar (74% and 14% of the market, respectively). Import volume (mostly from Japan and Vietnam) shrank 34.6% YoY, because the weak economy had hurt auto assembly and electrical appliances industries. And because Thailand does not impose anti-dumping measures on hot-dipped galvanized products, imports of these products rose 26.7% YoY and cheaper goods flooded the market.
- In the same period, HRC output slipped 6.3% YoY to 1.9 mn tonnes driven by weak domestic demand and export markets, and local manufacturers were hurt by cheaper imports from China and Vietnam. For full-year 2020, HRC output is expected to decline by 8.0-9.0%.
- Prices for HRC dropped 11.8% YoY in 9M20 due to weaker prices on world markets and falling domestic demand. For the year, prices will be lower than in 2019.
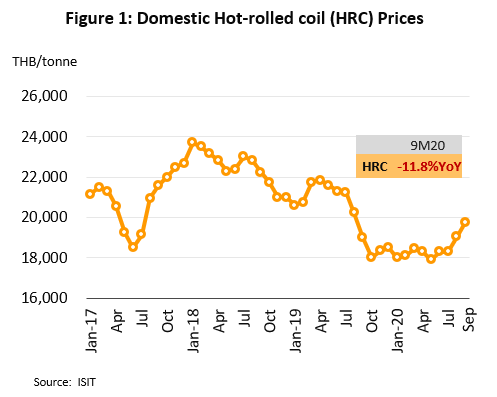
2021-2023 Outlook
- Following the slump in 2020, demand for HRC will recover to about 6.3 mn tonnes per year. This would be led by orders from the auto assembly and electrical appliances industries, which would rebound along with a recovering economy and improving consumer spending power.
- But HRC output will continue to decline because Thailand lacks an upstream steel industry, which means production costs are higher than for imported alternatives, especially from China where manufacturers have been investing in the production of better-quality, low-cost goods.
- Prices for Thai HRC are expected to remain low due to a combination of weak global prices (because of the supply glut which originated from China), and slower growth of domestic demand.
Situation in 2020
- Demand for steel bars and section (most important long steel products) also worsened in 9M20, falling 15.9% YoY to 2.8 mn tonnes. This was due to slowing demand from the construction sector (largest consumer), where total private-sector investment slipped 10.3% YoY in 9M20. For the rest of 2020, demand would continue to soften with a still-sluggish construction sector, although this will be partly offset by a pick-up in public-sector construction given efforts to accelerate budget disbursements. For 2020, demand for steel bars and sections is forecast to drop 16.0% to 3.7mn tonnes.
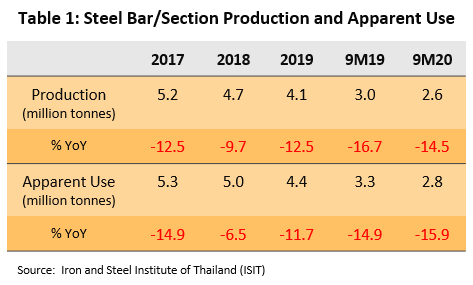
- Export volume of bars and sections tumbled 41.2% YoY in 9M20 as economies faltered in the main export markets of Lao PDR, Indonesia and Myanmar. Import volume also crashed, falling 34.4% YoY due to weak demand from the domestic construction sector. Imports from China (Thailand’s biggest supplier at 38% of imports by volume) fell by 29.4%, while imports from Japan (second largest supplier) tumbled 47.8% YoY.
- Output fell 14.5% YoY in 9M20 on weak demand from the construction sector. For full year 2020, output is expected to fall by 16.0-18.0%.
- Prices for steel bars fell 13.8% YoY in 9M20 due to weak prices on global exchanges and softer demand. In 4Q20, prices should inch up with an up-tick in orders from the construction industry. But for full-year 2020, prices will remain below 2019 levels.
2021-2023 Outlook
- Demand should rise by 4.0-5.0% to 3.9-4.2 mn tonnes per year with accelerating investment in government-backed infrastructure projects, especially initial works such as laying foundation and building piers to elevate metro lines. However, the high number of unsold properties will weigh on demand from the real estate sector, which is projected to improve relatively slowly.
- Output is forecast to increase by 2.0-3.0% per year, supported by works on government construction projects and the ‘Thai First’ initiative to source construction steel from Thai producers for infrastructure work carried out for the government or state enterprises. Public-private partnership (PPP) projects are exempted. Nevertheless, Thai manufacturers will still have to address the strong competition from low-cost imports.
- Prices for steel bars and section will stay low as the supply glut continues to trouble, and projected slow recovery in private-sector housing construction.
REAL ESTATE
Housing in BMR
Situation in 2020
- In 1H20, the housing market in the Bangkok Metropolitan Region[1] was badly hurt by the COVID-19 pandemic. New housing supply in the market plunged 49.3% YoY to 27,307 units. Instead, developers switched to selling inventory units through several means, including offering steeper-than-normal discounts, renting out the units instead of selling them, and offering 1-2 years of free accommodation. Pre-sales also suffered, slipping 46.2% YoY to 25,629 units.
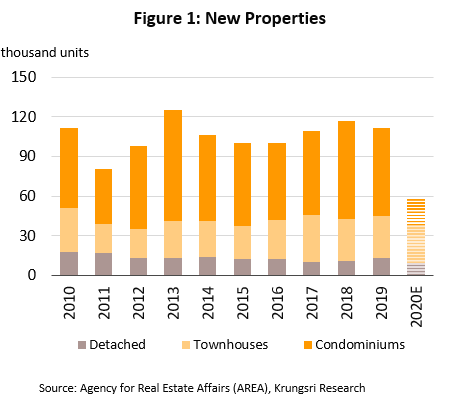
- In 2H20, the extremely weak domestic economy and high household debt reduced buyers’ purchasing power further, and the market continued to soften. For full-year 2020, conditions in the housing market will worsen. This can be attributed to: (i) the economic slump hurting domestic consumer spending power; (ii) the global recession limiting purchasing power of overseas buyers; (iii) stricter LTV rules capping demand for second homes; and (iv) still-significant oversupply of properties in many areas. These factors combined to discourage buyers from entering the market as well as undermine investor confidence. In 2020, new housing supply in the market is expected to tumble 48.0% to a 10-year low, and developers switch from condominium projects to focus more on low-rise developments. Overall, 2020 sales are forecast to fall by 35.0% from 2019 level (which had fallen by 16.8%) as developers postpone new projects to see how the economic situation develops.
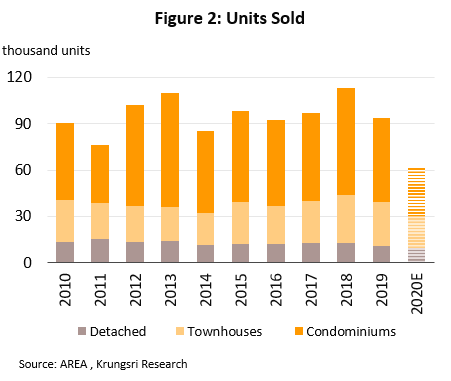
- The Housing Price Index[2] rose for all segment in 1H20. At 6.0%, condominiums saw the largest rise, followed by townhouses (+5.6%) and detached houses (+5.5%). This was mainly because most new projects were for properties aimed at upper-middle and high-income earners or were located near new mass transit lines where land costs are higher, pushing up overall prices.
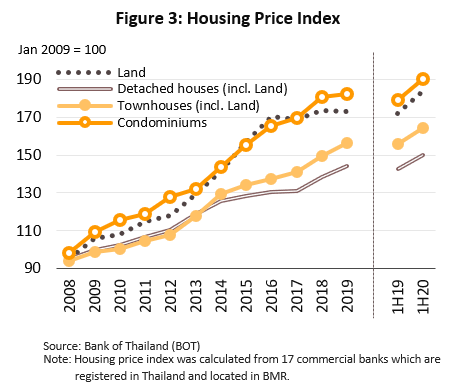
2021-2023 Outlook
- Over the next 3 years, the housing market in the BMR will rebound along with a recovering economy, acceleration of government-funded megaprojects, and greater demand from expatriates investing or working in Thailand. However, the severe supply glut will continue to dampen the market and cap growth.
- New housing supply coming to market should rise by 5.0% per year, compared to 10.0% p.a. average growth over the last 10 years. Developers will also continue to adjust development portfolios, shifting towards low-rise housing to preserve profit margins and meet real demand. For large developers, revenues should continue to grow, but for SMEs competition will intensify in both sales and access to development land, which prices will rise as supply dwindles.
- Low-rise housing (detached housing and townhouses): The COVID-19 impact and the ‘new normal’ have forced many individuals to spend more time working from home. This has raised demand for low-rise housing. In addition, with the expansion of the mass transit and road networks and investment in new shopping centers and mixed-use projects, suburban living is becoming more desirable. Low-rise projects are also more attractive to investors because they can be built and sold in phases, land for suburban low-rise developments is cheaper than land in central Bangkok, and the condominium sales continue to be hurt by the supply glut more than low-rise housing.
- Condominiums: Demand should improve in some parts of the BMR, especially in the CBD and along some mass transit lines. Also, most condominiums are developed by large, well-established operators that are skilled in project management, marketing and securing working capital. However, despite a drop in new supply in 2020, the market in some locations continue to be affected by excess supply of properties, including more remote, less desirable areas near the MRT Purple Line (Bang Sue-Bang Yai) and MRT Blue Line (Hua Lamphong-Bang Khae).
- Competition will rise across the industry, from both Thai and foreign developers. This will encourage more joint-venture projects between Thai and foreign developers. And to expand business activity and reduce risks, they will invest in a wider range of real estate projects, especially mixed-use developments[3].
- Other factors affecting the market will include: (i) the scarring effects of COVID-19 on the economy; (ii) high and rising household debt levels; (iii) changing buyers’ preference in the post-pandemic environment, for example, there is rising demand for larger, low-rise housing in the suburbs; and (iv) the impact of the Land and Building Tax Act[4]. The latter may encourage an increase in land transfers since tax will be collected on undeveloped land held for longer than 3 years from the date of enforcement.
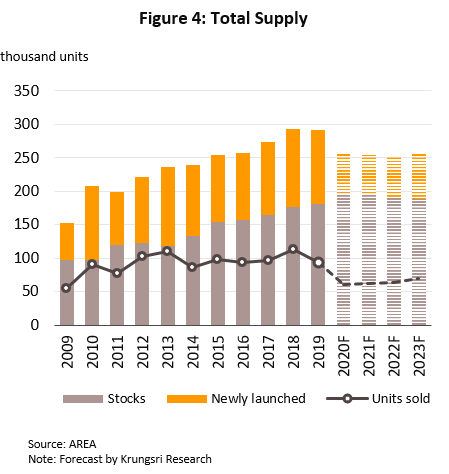
Housing in Upcountry (major six provinces)
Situation in 2020
- In 1H20, the housing market in the 6 major provinces[1] was depressed. The number of new low-rise projects coming to market fell by 32.3% YoY and new condominium projects tumbled 45.8% YoY as developers postponed new projects because of the pandemic-induced drop in purchasing power, weak provincial economies, and high levels of unsold housing stock.
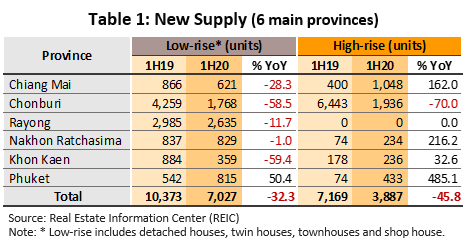
- Transfers in the 6 provinces fell in 1H20, but not evenly. (i) Transfer of title deeds for condominiums dropped 25.7% YoY with declines seen in all provinces, except Nakhon Ratchasima where transfers surged because the market there is driven by domestic demand. (ii) Transfers of low-rise properties fell 9.5% YoY, with sharpest drops recorded in Phuket and Chonburi. They rose slightly in Chiang Mai and Khon Kaen, in the former buoyed by stronger sales of detached and semi-detached houses, while the market in Khon Kaen is independent from tourist-driven demand.
- In 2H20, the market will remain sluggish due to weak consumer purchasing power, and large supply of unsold stock which in 1H20 was close to 79,000 units (51,707 low-rise units and 27,102 condominium units). Developers also continue to postpone new projects. So for full-year 2020, the persistent weak economy and COVID-19 impact will continue to hurt sales and cap supply of new properties.
2021-2023 Outlook
Demand for residential property will recover. Markets in Chonburi and Rayong are expected to rebound first because of encouraging progress in government infrastructure projects, especially in the EEC (Chonburi, Rayong and Chachoengsao) where greater urban development and regional connectivity will stimulate the market.
- Low-rise housing: Demand will return along with a recovering economy. Supply will tighten, as indicated by the Leading Indicator for Supply (applications for construction permits fell 10% YoY in 1H20, most strongly in Chiang Mai, Chonburi and Phuket), which will reduce inventory units. Large developers have a branding advantage, which will make marketing easier. SMEs may have cost advantages since many develop projects on land they own. However, SMEs also tend to target low- and middle-income earners, who are projected to see a slow recovery in spending power and for whom credit is more difficult to obtain.
- High-rise housing (condominiums): Recovery will be slower than for low-rise housing. Although the stock of new, unsold properties will decline (in 1H20, the number of construction permits issued for condominiums fell by 61% YoY), supply will continue to rise in Rayong and Phuket where developers are anticipating future increases in demand stoked by growth in industry and tourism.
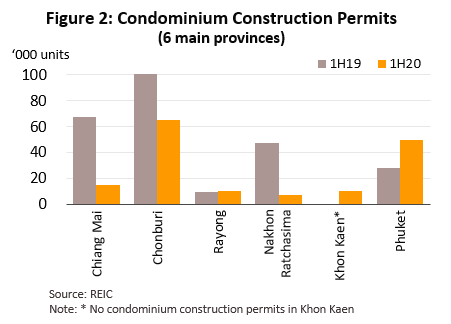
Commercial Buildings in BMR
Situation in 2020
- In 1H20, 260,000 sq.m. of new office space became available in the BMR, mostly outside the CBD, bringing total supply to 9.1 million sq.m. (up 2.4% YoY). However, as more people work from home, new demand fell to only 41,500 sq.m. and total occupied space fell by 1.5% YoY to 8.3 million sq.m.
- In 2H20, supply continued to expand but demand remains weak because of the pandemic impact and recession, which pushed some tenants into insolvency and others to review their rental needs. For full-year 2020, occupancy rate should drop to 92% from 93% in 2019. Rental growth will slow to 3.0%. It will remain positive because while some tenants have asked for discounts or extended tenancies with rates unchanged, most of the new supply was grade-A properties and this lifted average rates.
2021-2023 Outlook
- Over the next 3 years, business conditions should improve along with the economy. As the COVID-19 impact abates and conditions return to normal, demand for rental office space will rise. This will also be helped by crowding-in effects of government spending on infrastructure projects. In addition, Thailand enjoys several advantages over other ASEAN countries, including: (i) its geographical location – being in the center of the region makes it a natural hub for connecting trade and investment; (ii) attractive rental rates; (iii) tax benefits for companies setting up regional operating headquarters (ROHs) in the country; and (iv) tax incentives offered to businesses in target industries. However, a total of 1 million sq.m. of new space will come into the market over the next 3 years, which will push down occupancy rate to 86-90%. This would give tenants more bargaining power and slow down rental growth.
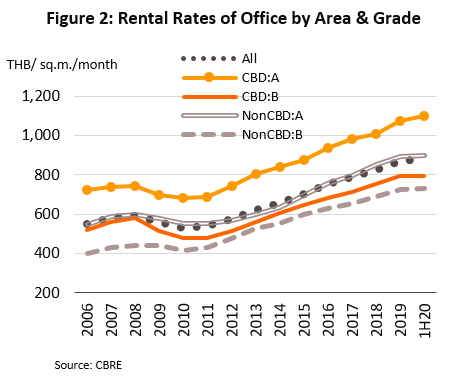
- Owners of rental office properties in the CBD will continue to see healthy rental revenue, especially for grade-A properties where there is limited supply, and so rents and occupancy rates would be relatively higher. On the other hand, owners of properties outside the CBD and in more suburban parts of the BMR will see slower or no increase in rental revenues. Developers in these segments, including small office buildings built for their own use with some area rented out and small- to mid-size commercial buildings, will see stiffer competition because of low barriers to entry given the lower investment value.
- Competition will rise because or growing divergence between steadily rising supply and softening demand. The latter would being attributed to the sudden growth in working from home since the COVID-19 pandemic started. This have prompted businesses to rethink their office space requirement, and could lead to lower demand for rental office space in the coming period. In addition, by 2025, the completion of several large mixed-use[1] buildings will result in around 500,000 sq.m. of new space becoming available[2], which will add competitive pressure in the industry.
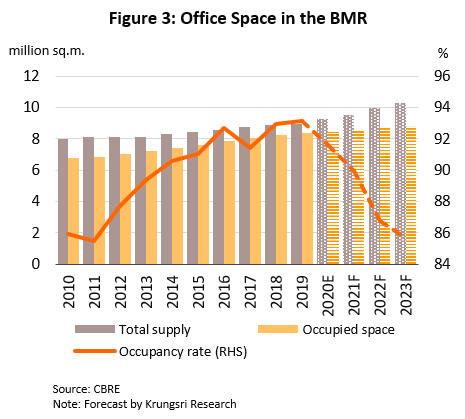
Situation in 2020
- In 1H20, the pandemic resulted in only 60,200 sq.m. of new commercial space coming into the BMR, the smallest expansion in in the first half of many years. This took cumulative total retail space[1] in the BMR to 6.4 million sq.m., up 2.9% YoY. But, demand rose by 4.8% YoY to 6.1 million sq.m., and this discrepancy lifted occupancy rate from 94.8% at the end of 2019 to 95.8% in 1H20. This stronger demand was partly due to the pandemic impact on landlords, who used pricing strategies to encourage tenants not to relinquish their leases.
- In 2H20, some tenants might have experienced liquidity problems or been forced out of business. Those which managed to shift to online sales could have reduced their physical presence in retail shopping areas. Hence, occupancy rate will soften. In addition, real estate operators are proceeding with plans to develop new shopping space, and another 112,000 sq.m. will be added to the market. This would take the 2020 total to 6.5 million sq.m. (up 3.0%) even as the COVID-19 impact on the economy and tourist arrivals means demand for retail space will continue to slide.
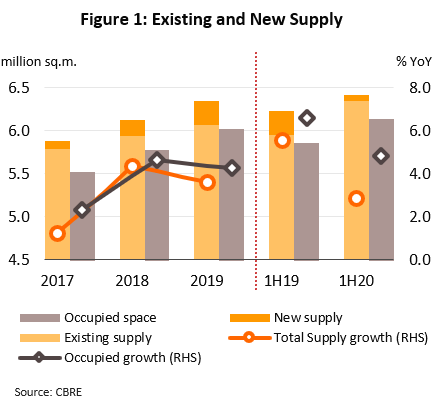
2021-2023 Outlook
- Owners of rental retail space will see improving revenue along with a recovery in private-sector consumption and progress the build-out of new infrastructure. The latter would help to stimulate greater investment in the retail sector. Over the next 3 years, demand is forecast to rise by 1.0-2.0% per year, while new supply should total 300,000 sq.m. This would bring down occupancy rate to 89-90%, but despite this, average rental rates should rise especially for downtown commercial units.
- Enclosed malls: Rental revenues should rise. Although supply will grow steadily to meet future demand, there is limited room for expansion in central areas. Therefore, players are likely to respond to changing consumer lifestyles by investing in modernization programs, which will lead to slightly higher rents.
- Community malls: Revenues would remain flat. With supply and demand remaining unchanged, occupancy rates will not move significantly.
- Supporting malls: Revenues will remain close to 2020 levels, but occupancy rates will edge down with an increase in new supply.
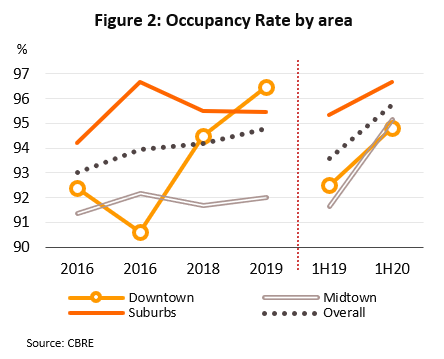
- Competition would intensify with a rising number of mixed-use developments[2] being completed in the near future. By 2025, these would be a footprint of over 1 million sq.m., which will increase the supply of retail space. At the same time, growth in e-commerce will eat into demand, so operators could see weaker occupancy rates and rents, which would reduce profit margins.
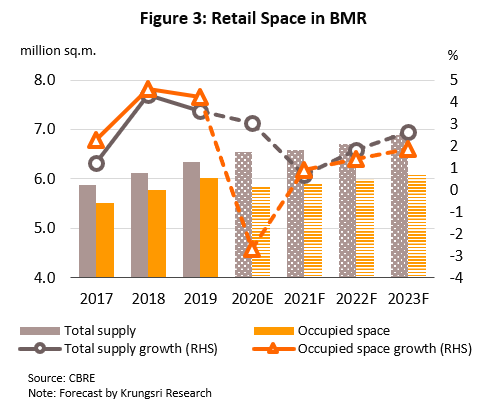
Industrial Estate
Situation in 2020
- In 1H20, land sales and leases in industrial estates plummeted 33.3% YoY to 759 rai, comprising 706 rai in the eastern region (-31% YoY), 42 rai in the BMR (-6.7% YoY), and 11 rai in the central region (-80% YoY). Industrial and factory building construction permits saw similar declines, falling 39.9% YoY because of the COVID-19 impact and national lockdown.
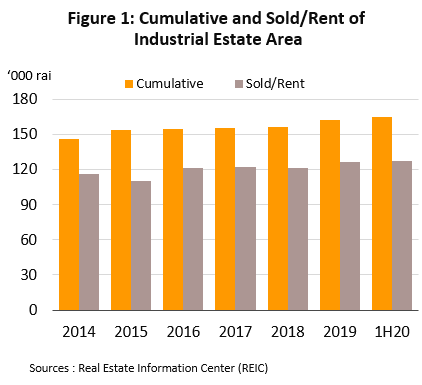
- Supply side: Two new industrial estates opened in 1H20: (i) The 1,322-rai Pinthong Industrial Estate 6 in Chonburi is aimed at meeting demand from investors in the new S-curve industries; and (ii) the 1,392-rai World Food Valley Industrial Estate in Ang Thong is Thailand’s and ASEAN’s first comprehensive center for innovation in the food technology industry. As a result, nationwide cumulative industrial estate area (in 17 provinces) reached 165,000 rai. They are overwhelmingly concentrated in the eastern region, which contains 75.4% of total industrial estates by area. Currently, 77% of all industrial estate land (127,000 rai) is rented out or has been sold.
- In 2H20, demand for land in industrial estates (purchase or rent) will continue to soften given the poor economic outlook and weak investor sentiment. In addition, the world is still struggling to bring the COVID-19 global pandemic under control, and domestic political tension appears to be worsening. As such, for full-year 2020, land sales and leases in industrial estates would tumble 62% to 1,200 rai.
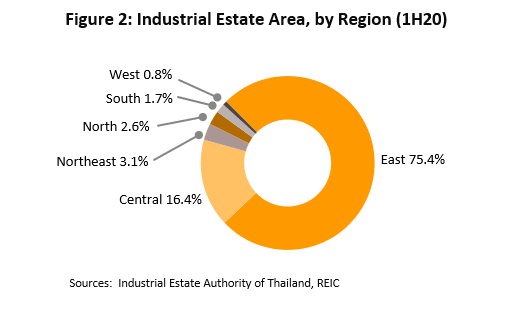
2021-2023 Outlook
- Following poor performance in 2020, the industry should bounce back to average annual growth of 25% over the next 3 years. Total land sales and rental should notch 2,000 rai per year again. This turnaround will be supported by: (i) improving investor confidence along with a more optimistic economic outlook, and more businesses (especially those involved in agriculture, food processing, and the production of medical devices) relocating to Thailand to circumvent the US-China trade conflict; and (ii) progress in public infrastructure projects, especially in the EEC, where crowding-in effect should stimulate greater private-sector investment.
- Eastern region: Demand for land in industrial estates should surge in this region as extensive investment in infrastructure would support the development of the EEC in 3 provinces - Chonburi, Rayong and Chachoengsao. This will attract greater interest from Thai and international investors, especially from those active in the targeted industries for which the government is offering investment support. However, rising land prices may cap supply.
- Central region: Rising demand for industrial land in the central region will be supported by the region’s geographical location and easy connections to national transport links.
- Other regions: Demand will remain flat and the outlook will not improve until the government introduces more measures to stimulate private-sector investment.
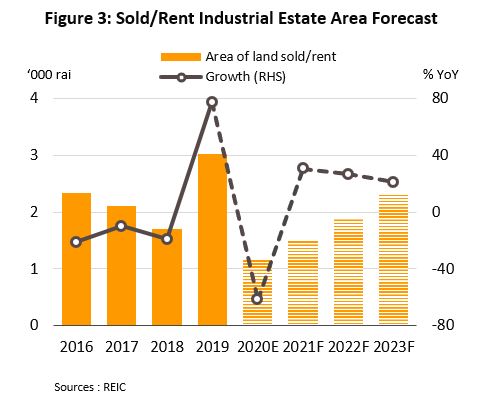
HOSPITALITY
Hotels
Situation in 2020
- Conditions were depressed for hoteliers in 9M20. Foreign tourist arrivals had collapsed by 77.3% to 6.7 mn. Lockdowns worldwide (including in Thailand) froze global travel, with no arrivals in Thailand between April and September. Arrivals from the main markets of China, Malaysia and Russia tumbled by 85.4%, 79.1% and 39.5% YoY, respectively. Domestic tourism also tumbled 54.7% YoY to 52.7 mn trips, almost halting in April and May, before improving with the easing of lockdown in June-September (when the monthly average fell by 47.3%) and the introduction of the “Let’s travel together” program.
- Occupancy rates averaged 28.6% in 9M20 (compared to 71.2% in 9M19), while room rates slipped 34.2% YoY and reduced RevPAR to THB323 from THB1,224 (-73.6% YoY).
- Supply: Applications for construction permits fell 35.2% YoY to 940,000 sq.m. in 8M20. The largest drops were recorded in Phuket (18% of applications by area) at -60.3% YoY. But in Chonburi (28% of the total) and Rayong (3%), they rose by 198.6% and 34.2% YoY because of progress in the EEC projects. There were no applications for Bangkok.
- Conditions have improved slightly in 4Q20. Domestic tourism recovered gradually driven by government incentives and outbound tourists switching to domestic travel. Foreign tourist arrivals is also starting to recover with the issue of the Special Tourist Visa (STV), subject to 14-day quarantine, health checks and having a comprehensive travel insurance. For full-year 2020, arrivals will tumble 83.0% to 7 mn, while domestic tourism will drop by 40% to 95 mn trips. This would reduce occupancy rates to 32.0-35.0% from 71.4% in 2019.
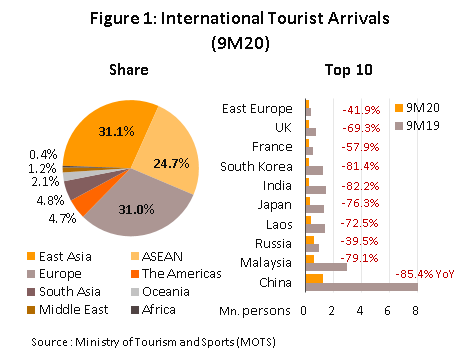
2021-2023 Outlook
- Conditions will remain depressed in 2021, before recovering in 2022-2023. Annual arrivals will take at least 4 years to return to pre-COVID level of 38-40 mn. In 1H21, arrivals rise slowly because of the STVs and perhaps the creation of travel bubbles. By 2H21, mass vaccinations would have accelerated, which would boost international tourism. However, domestic tourism will recover sooner, partly due to ongoing government stimulus measures.
- Hotels in Bangkok, Pattaya and Phuket: Revenues will recover along with the tourism sector, and occupancy rates will average 50-55%. However, investment will slow down because of oversupply in the market since the COVID-19 crisis started.
- Hotels in regional centers and key tourist areas: Revenues will improve led by recovering domestic tourism, supported by government stimulus measures.
- Hotels in other areas: Revenue will be flat at 2020 levels. Government measures will help to lift domestic tourism but occupancy rates will remain low as most visitors would be traveling to other provinces.
- Hoteliers everywhere will see rising competition because of a supply glut (of hotels and other types of accommodation). The slow recovery in demand will limit increases in room rates, especially in areas that rely heavily on foreign tourists.

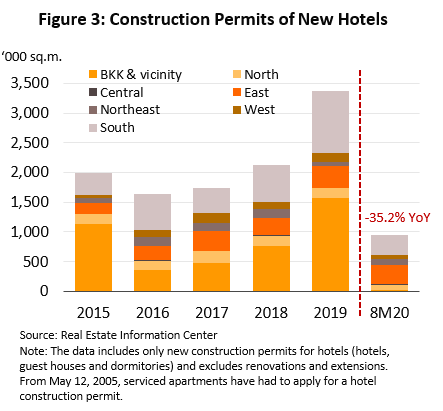
Private Hospitals
Situation in 2020
- The pandemic led to a significant drop in hospital visits in 1H20 as patients postponed non-urgent treatments over fear of infection and the need to maintain social distancing measures, and thus cases of notifiable diseases (e.g. dengue fever and influenza) declined -19.5% YoY. The lockdown also made it impossible for foreign patients to travel to Thailand and so for large private hospitals that depend on overseas customers, revenues contracted sharply, but small to mid-sized players were less troubled since revenue from treating social security patients helped to sustain turnover.
- Conditions have improved in 2H20 thanks to: (i) Hospitals securing new sources of revenue by switching to the domestic market and revamping their services, e.g. by offering telemedicine services, giving blood tests and injections at patients’ homes, providing online consultations, and making available residential health facilities; (ii) more aggressive pricing strategies; and (iii) the relaxing of the lockdown, which encouraged greater uptake of hospital services and opened the door to the return of foreign patients. However, for the year, the industry remains depressed and having grown by 5.0% in 2019, revenue will shrink by 10.0-12.0% in 2020.
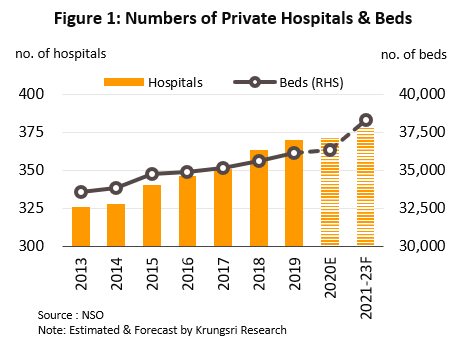
2021-2023 Outlook
The outlook will improve over the next 3 years and revenue will increase by 4.0-5.0% per year, while the number of private-sector hospital beds is forecast to rise by at least 2,000 from the current 36,000. This outlook is supported by the following:
- Demand will tend to rise on a number of factors:
- Structural changes underpinning stronger demand will include: (i) the transition to an aged society, which the NESDC estimates will happen in 2021, increasing demand for complicated, ongoing treatments; (ii) the expansion in the middle class (and the concurrent increase in spending power)[1] from its current level of 41% of the population; and (iii) increasing urbanization, which the UN estimates will go from 50.4% of the population in 2015 to 60.4% in 2025.
- Other factors boosting demand will include: (i) Infections with notifiable, existing and newly emerging diseases will tend to increase, as will cases of NCDs; (ii) hospitals are extending their customer base and by increasing and broadening their investments at home and abroad they are developing their strengths and building more comprehensive supply chains, e.g. by partnering with organizations that extend their networks and connect to more customers; and (iii) government policy that encourages the development of Thailand as an international medical hub, including designating this as one of the ‘new S-curve’ industries.
- Operators will tend to increase investments according to the size of their business.
- Large hospitals: These will see growth thanks to their quality and high levels of expertise. Investments will be made in increasing site sizes and numbers, helping hospitals to better target customers and broaden their revenue base.
- Small and mid-sized hospitals: Revenue will grow slowly due to strong competition from large private-sector and government hospitals that target the same groups, though hospitals that serve social security patients will come under less pressure since revenue from these is guaranteed.
- Challenges facing the industry will include a shortage of doctors and medical staff, government controls on the price of medicines and services, and competition from government hospitals that can match the quality of services in private hospitals, and on a larger scale, from other countries that also plan to develop regional medical hubs.

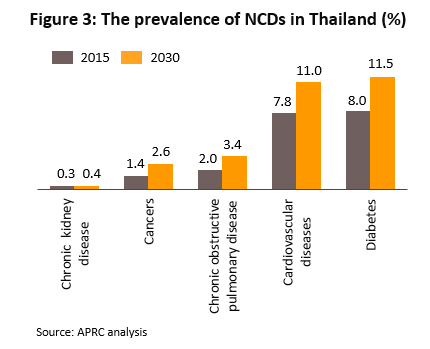
RETAIL TRADE
Modern Trade
Situation in 2020
- In 1H20, retailers registered sluggish business, reflected by the Retail Sales Index for department stores which slipped 5.8% YoY. They were badly affected by social distancing measures (e.g. in-country travel restrictions, reduced opening hours, prohibition on sale of non-essential items, and closure of some rental spaces) and the collapse of the tourism industry.
- In 2H20, conditions improved partly due to government measure to boost consumer spending, including (i) cash aid for for low-income earners, and (ii) the ‘Shop and Payback’ tax rebate program. Rising online sales and year-end spending will also support the sector. For full-year 2020, sales are expected to fall by 5.0-8.0%, following 2.8% growth in 2019.
2020-2022 Outlook
Forecast 2.0-3.0% average annual growth over the next 3 years.
- Demand: Consumer spending power will recover as the economy improve. The industry will also benefit from: (i) extra government measures to stimulate spending; (ii) general improvement in investment following the cyclical recovery in manufacturing and exports, while progress in new infrastructure projects upcountry will lead to the expansion of adjacent communities and greater spending; and (iii) growth of CLMV economies, which will encourage more retail outlets in border regions.
- Supply: Operators will try to increase competitiveness and expand revenue streams and consumer base by: (i) blending on- and off-line shopping; (ii) partnering with players in other industries, e.g. logistics; and (iii) opening new branches, e.g., along BMR metro lines, in tourist centers, near SEZs, in the EEC, and in regional centers or border regions. Some operators will also increase investment in neighboring countries to meet rising demand.
- For the individual segments, the outlook will vary as follows.
- Department stores: Following a drop of 8.5% in 2020, stronger spending power will lift sales by 1.3-2.6% p.a. over the next 3 years. Operators will invest in high-growth provinces and across the broader region.
- Discount stores: Following a fall of 6.6% in 2020, sales will bounce back by 1.0-2.0% in 2021-2023. This segment target low- and middle-income earners who purchase daily necessities. However, there is strong price competition and players need to vie with other types of retailers, including convenience stores.
- Supermarkets: After shrinking by 6.5% in 2020, sales should grow by 1.9-3.8% per year in 2021-2023, supported by rising spending power of middle- and high-income consumers.
- Convenience stores: Following a decline of 6.9% in 2020, sales is projected to grow by 1.1-2.1% p.a. over 2021-2023, led by the expansion and almost complete nationwide coverage of branch networks.
- Challenges facing the industry include stronger competition from players in e-commerce and high household debt levels.
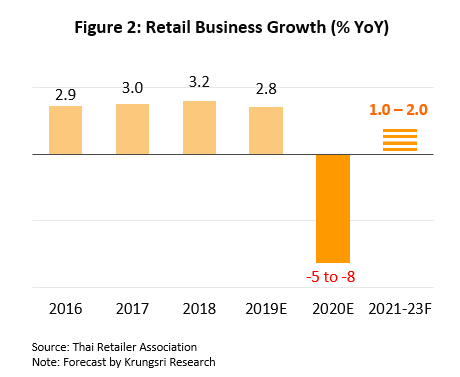
FINANCIAL SERVICES
Credit Card
Situation in 2020
- In the first half of 2020, business conditions for credit card issuers deteriorated sharply. Data for June 2020 show credit card spending plummeted 17.6% YoY, while outstanding balances shrank by 6.3% YoY. This severe disruption was largely caused by the temporary lockdown across the country to halt the spread of COVID-19. But this had severe consequences for most of the economy, especially airlines, hotels, restaurants, offline shopping, and logistics and transportation industries. Demand for goods and services related to tourism almost disappeared both domestically and internationally. Credit card spending in these industries fell sharply. But they continued to grow for purchases of consumer necessities, and spending on health, insurance and online deliveries.
- The number of new cards issued in 1H20 grew only 3.6% YoY compared to 6.9% for all of 2019. Consumer spending power was suddenly reduced as the lockdown had hurt household income and employment. This was especially significant in sectors most seriously impacted by the lockdown. And with this, the ability to service debts also weakened, pushing lenders to be more careful with issuing new credit cards. Card issuers responded to the worsening business environment by focusing on the market segment where income exceeds THB30,000/month and/or customers that are spared by the pandemic, including individuals working in medicine and e-commerce, and civil servants.
- In 2H20, the situation for credit card issuers improved slightly, albeit still lackluster, supported by the relaxation of lockdown measures as well as government stimulus such as “We Travel Together” and “Shop Dee Mee Kuen” to boost domestic spending. For full-year 2020, credit card spending is projected to drop by 14.8%
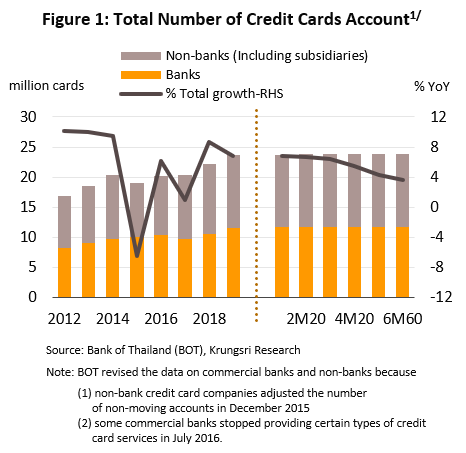
2021-2023 Outlook
- Over the next 3 years, credit card spending growth is forecast to recover to an average of 5.7% per year. This outlook is premised on changing consumer behavior towards using electronic payment methods, the growth of e-commerce, and a recovery in spending (including the use of credit cards) as the economy returns to near-normal conditions. However, players will still face several headwinds from the worsening economic situation. They include weaker household income and the ability to meet repayments, already-high and rising household debt levels, government requirement to provide assistance to credit card holders, higher operating costs driven by the need to book larger provisions to address a possible rise in NPLs, and rising competition from both traditional lenders and non-bank operations. These will encourage players to review their business strategies.
- Operators need to prepare for a general decline in the quality of debtors, by applying pre-emptive measures to manage NPLs.
- Growing the market for online payments remains an important strategy as they try to expand their customer base.
- Players will look to new, higher potential market segments to reduce exposure to risks. This will involve marketing to customers with higher incomes or who work in industries which have been relatively spared by COVID-19.
- Using alternative data to assess credit-worthiness will help lenders make more accurate decisions on whether to issue credit cards to individuals who cannot show evidence of income and who would find it difficult to obtain a credit card.
- Offering rewards to customers when they use their credit cards remains an important incentive to motivate card usage, and so issuers will benefit from competing in this area.
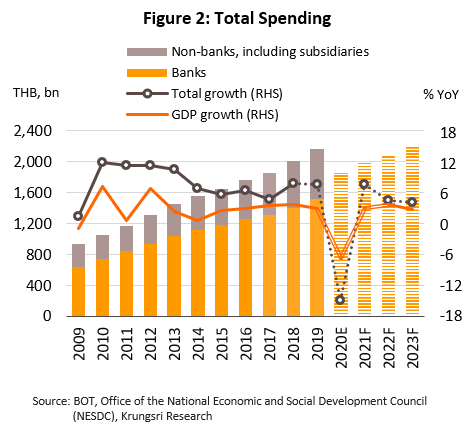
OTHER SERVICES
Mobile Communication
Situation in 2020
- In 1H20, revenues of telecom service providers fell 5.0% YoY. This was caused by the temporary closure of service centers in shopping malls, collapse of the tourism industry, and the sudden recession. Although more people working from home in 2Q20 raised demand for data services, but the release of packages offering unlimited data had capped revenue growth. Overall, monthly average revenue per user (ARPU) fell 0.2% YoY.
- In 2H20, services revenue surged along with a general improvement in the economic outlook. However, consumer purchasing power remains fragile, and price competition is intense. Given this, ARPU continued to slide and user base saw little or no growth, so revenue for full-year 2020 is estimated to shrink by 4.0-5.0%, following 3.6% growth in 2019.
2021-2023 Outlook
The industry is expected to return to growth, with services revenue rising by an average annual rate of 2.0-3.0%. This will be supported by the following:
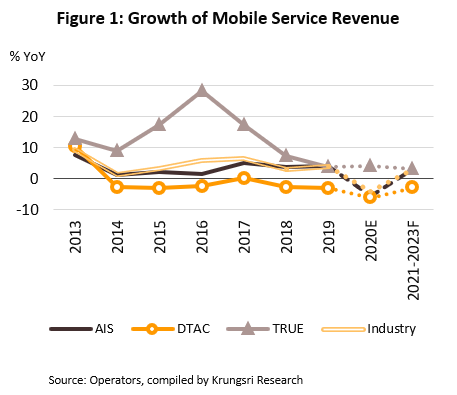
- Stronger demand for mobile phone services will come from: (i) greater uptake of mobile data services to access the internet and online content, use social media, carrying out online financial transactions and online shopping. This presents an opportunity for companies to expand their customer base and revenues; (ii) government policy, for example, to promote the digital economy, the smart city program, and government-led auction for 5G spectrum, will lead to the build-out of new telecommunication infrastructure nationwide and create new sources of demand; and (iii) the digitalization of industry (especially sales & marketing and the implementation of 5G technology) will extend the Internet of Things application, and with this, the use of mobile telecommunication services. Operators will increase investment to expand networks to meet future growth and to provide additional services.
- To this end, operators could roll out strategies that include: increasing the quantity of digital content, expanding services to business customers, providing custom network services to other industries, and forming more partnerships with other content providers. All these would help to expand customer base and create new revenue sources in the long term.
- Headwinds could limit earnings growth. These could include: (i) stiffer price competition which will cap room for operators to raise service charges, thus keeping ARPU flat or rise only slightly; (ii) marginal growth in subscriber base because of a saturated domestic market (in 2019, there were over 129.6 mn registered mobile accounts for a population of 66 mn); and (3) rising costs, driven by investment in new infrastructure for 5G networks and additional expenses to bid for new spectrum.
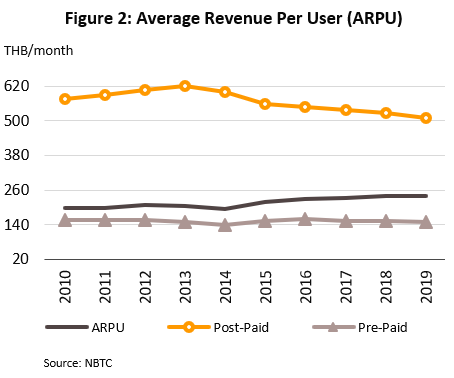
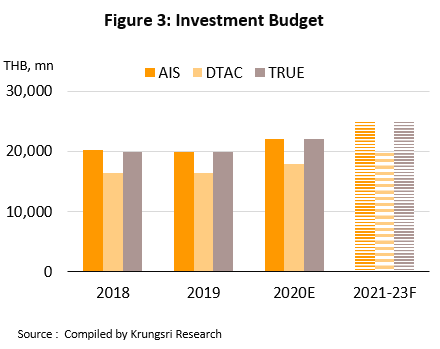
Logistics
Situation in 2020
- Conditions were depressed in 1H20. The COVID-19 pandemic had reduced imports of raw materials and intermediate goods and disrupted manufacturing output, reducing the need to store and export finished goods. The pandemic also complicated the transportation of goods domestically and across borders, while the economic slowdown forced many businesses to temporarily shut down and relinquish some warehouse space. However, the situation improved in 2H20 with the reopening of most business sectors and recovering economic activity. Meanwhile, social distancing measures and work-from-home policies boosted online shopping, which increased demand for small, ready-built units in suburban areas and provincial centers to sort and distribute shipments. Thus, demand for warehousing in 2020 should rise by 75,000 sq.m. (+1.7%) to 4.6 mn sq.m.
- The economic slump has increased idle warehouse space, while new supply have been hit by: (i) strict controls on foreign investors entering the country, and delays in signing new leases and constructing new warehouses; and (ii) big players in e-commerce increasingly building their own warehouses. Supply of new warehouse space for rental reach 230,000 sq.m. in 2020, most being ‘built-to-suit’ warehouses which construction started in 2018-2019. Total supply will rise 4.4% to reach 5.4 mn sq.m. in 2020 (vs +5.2% in 2019). Because supply growth will outpace demand, occupancy rate will slip to 85.3% in 2020 from 87.6% in 2019, while rents will remain unchanged.
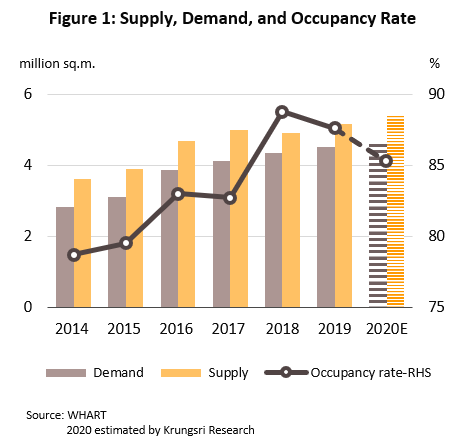
2021-2023 Outlook
- Demand is projected to grow by 3.1% per annum, driven by: (i) recovering manufacturing and trade along with a rebound in the economy; (ii) increasing government spending on infrastructure megaprojects, which will boost demand for collection and distribution centers in new locations; and (iii) the emergence of a ‘new normal’, with greater prevalence of online shopping and with this, stronger demand for warehouse space.
- Operators will be cautious with adding supply, due to: (i) the fragile economic recovery and ongoing risks to international trade and investment; (ii) post-COVID, there is excess supply of space, especially in traditional warehousing; and (iii) stiff competition in the industry on rents and the provision of additional services. To reduce competitive pressure in the market for traditional warehousing, some operators will invest in modern warehousing that is ‘built-to-suit’, for which supply is still limited. This will help to secure stable revenues, with long-term leases, 3-yearly increases in rents, and revenues from additional services.Warehousing space is projected to rise by 160,000 sq.m./year (up 2.9% p.a.) and occupancy rates will average 85.6%.
- Operations with the greatest potential will be in the BMR, the EEC, regional centers or border regions with convenient transportation connections to urban centers, or in industrial estates, parks or regions, or duty-free zones across the country.
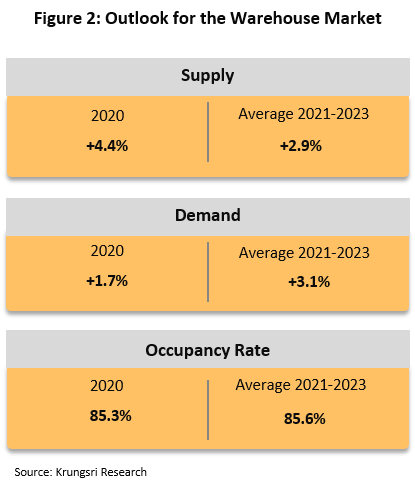
- Mass Rapid Transit Operators
Situation in 2020
- In 8M20, mass transit operators were loss-making due to: (i) reduced passenger numbers and fare revenues due to social distancing, closure of retail and entertainment venues, curfew, more people working from home, and school closures; and (ii) lower revenue from commercial operations and advertising in stations and car parks as rents and tenancy fell. However, conditions have improved since May, when the government started to relax lockdown measures.
- BTS: Daily passenger numbers dropped 42.7% YoY to 385,959 with the delayed reopening of schools and fewer foreign tourists (Chinese travelers comprised 5-6% of BTS users).
- MRT: Daily passenger trips tumbled 23.6% YoY to 242,000. The drop is smaller than for the BTS because of the opening of the Bang Sue-Tha Phra extension, and from the end of 1Q20, the extension connecting to the Purple and Green lines. Also, fares have been kept low since September 2019.
- ARL: Daily passenger trips tumbled 45.2% YoY to 39,472 as the halt in air travel at the start of the pandemic reduced arrivals at Suvarnabhumi, especially foreign arrivals (20-30% of ARL users).
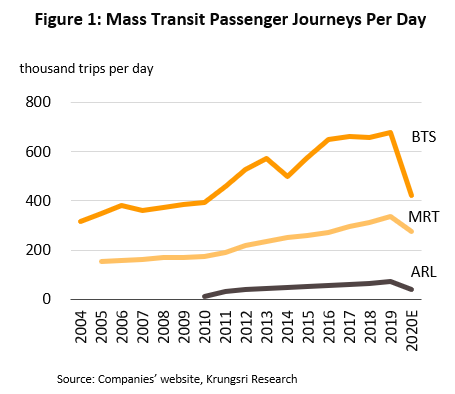
- For the rest of 2020, daily passenger trips will average 885,099 (up from 667,431 in 8M20), lifted by additional public holidays and the extension of low fares to year-end. Additionally, in December, the Dark Green Line Mor Chit-Khu Khot section and Gold Line Krung Thonburi-Khlong San section will open and connect to the Light Green Line. However, international travel restrictions and street demonstrations (which had sometimes prompted the government to close some stations) will weigh on operators. Overall, 2020 passenger numbers will shrink by 37.6% for the BTS, by 18.4% for the MRT, and by 42.4% for the ARL, compared to 3.1%, 8.0% and 10.4% growth in 2019, respectively.
2021-2023 Outlook
- The number of daily trips will rise slowly thanks to: (i) the return to normal economic activity; (ii) the increasing number of people living near mass transit lines, stations or interconnections (in the next 3 years, another 75,000 condominiums will be available near metro lines); and (iii) the opening of 3 new lines (106.5 kilometers of track) in suburban areas, which are nearing completion and undergoing tests. These will boost the number of passengers moving between inner and outer Bangkok, and would increase trips from one end of Bangkok to the other by 690,000 per day.
- Over the next 3 years, more suburban lines will be in service. (i) From October 2021, the BTS will start testing the Pink Line Khae Rai-Minburi sector and Yellow Line Lat Phrao-Samrong sector, with plans to open in 2022; and (ii) from July 2021, the ARL will start testing the Red Line Taling Chan-Bang Sue-Rangsit route. This will increase fare revenues, income from managing commercial sites and servicing electrical and transport systems, and supplying services to the BMA, MRTA and the SRT Electrified Train.
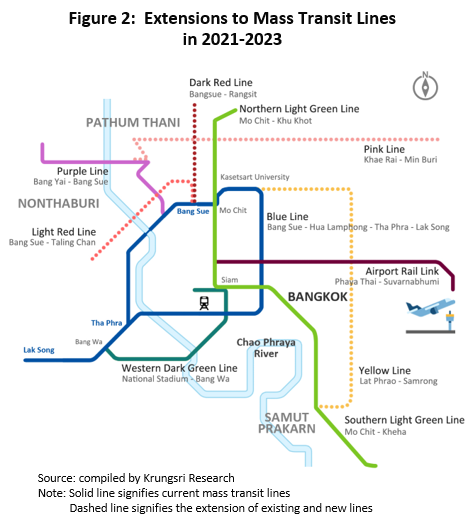
[*] The trade agreement covers 31% of global GDP and encompasses a marketcontaining 2.3bn consumers in 10 Asian countries together with Japan, China, South Korea, Australia and New Zealand.
Power Generation
[1] This does not include 2,906 megawatts of power generated from large-scale hydro.
[2] This is on the assumption that (i) energy saving measures reduce demand by an average of 1 billion units annually, and (ii) independent power suppliers (IPSs), which produce electricity for their own use or who bypass EGAT and supply electricity directly to consumers, supply some portion of this, though information is only available on suppliers generating over 1 megawatt of power (organizations in this category include SPP cogeneration, solar, biomass and biogas producers).
Ethanol
[1] i.e. Gasoline and the various types of gasohol
Biodiesel
[1] B7, B10 and B20 diesels together with special high-speed diesel
Pharmaceuticals
[1] Data from the Office of Industrial Economics.
[2] The Pharmaceutical Inspection Co-operation Scheme (PIC]S) is a cooperative framework set up by GMP inspectors from several countries (especially Europe) which wanted to establish universal standards for assessing GMP in pharmaceuticals production. Thailand officially became its 49th member on August 1, 2016.
Chemical Fertilizers
[1] e.g. urea (46-0-0), ammonia sulfate (21-0-0) and 16-20-0, 15-15-15, 16-16-8 and 13-13-21 fertilizers. These six types account for more than 90% of all fertilizers used in Thailand.
Auto parts
[1] Work by Krungsri Research shows that as of 2019, the average lifespan of passenger cars and pickups had increased to respectively 8.8 years and 12.1 years from 8.7 and 11.9 years in 2018.
Hard Disk Drives (HDD)
[1] Gartner forecasts (as of September 2020) that investment in infrastructure-as-a-service (delivering software services through cloud computing) will grow by 13.4% in 2020 to USD 51.4bn and by another 27.6% to USD 64.3bn in 2021.
Housing in BMR
[1] Total housing projects include detached houses, townhouse, condominium.
[2] The Combined Housing Price Index aggregates the cost of purchases of detached houses, townhouses and condominiums, and is calculated from the value of the collateral against which home loans have been issued by 17 Thai banks for purchases of properties in the BMR.
[3] Mixed-use real estate projects are developments that combine residential accommodation and commercial space within the same complex. Retail, office and residential units may be included in a single development.
[4] The 2019 Land and Building Tax Act was published in the Royal Gazette on March 13, 2019 and will come into effect on January 1, 2020. The Act sets land and property taxes at rates determined by usage: (i) agricultural land is taxed at a maximum of 0.15%; (ii) property is taxed at 0.30%; (iii) land for other uses is taxed at up to 1.20%; and (iv) unused land is taxed at a minimum of 0.30%, but if the land remains utilized, the rate will increase by 0.30% every 3 years to a maximum of 3%.
Housing in Upcountry (major six provinces)
[1] The 6 provinces are Chiang Mai, Chonburi, Khon Kaen, Nakhon Ratchasima, Phuket and Rayong.
Office Buildings
[1] Mixed-use real estate projects are developments that combine residential and commercial facilities within the same development.
[2] Data from CBRE Research, Thailand.
Retail Space
[1] Retail space comprises three segments - enclosed mall, community mall and supporting mall.
[2] Mixed-use real estate projects are developments that combine residential and commercial uses in the same development.
Private Hospitals
[1] BCG’s Center for Customer Insight
Credit Card
[1] One reason for the reduction in the number of issued credit cards in 2015 was that the Bank of Thailand had adjusted down its record of issued credit cards because (i) non-bank issuers had stopped counting ‘inactive accounts’ from December 2015, and (ii) commercial banks had stopped issuing certain types of credit cards from July 2016.


.webp.aspx)