Industry Horizon (October 2026)
28 October 2026
Automobile: Production will grow on EV 3.5 commitments and new XEV tax incentives, while domestic sales and exports will gain from rising XEV adoption.
-
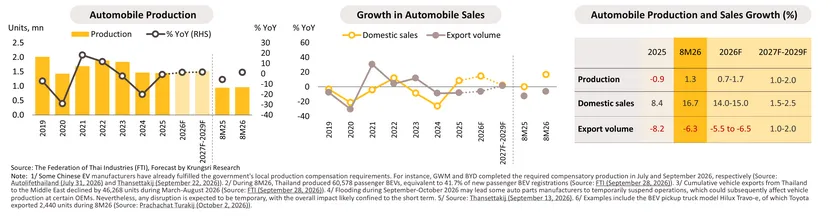
In 8M26, vehicle production increased 1.3% YoY to 959,711 units, reflecting higher output of passenger BEVs (+74.0% YoY), HEVs (+20.0% YoY), PHEVs (+22.4% YoY), trucks (+1.4% YoY), and 1-ton pickups (+0.5% YoY). XEV production benefited from the EV 3.5 compensation scheme1/ and continued investment in XEV manufacturing and related supply chains. However, manufacturers continued to face pressure from excise tax rates favoring low-cost BEV imports, with locally-produced passenger BEVs accounting for only 41.7% of new passenger BEV registrations2/. Domestic sales rose 16.7% YoY to 465,971 units, lifted by a 52.6% YoY growth in passenger XEV sales amid government incentives, improving affordability, and rising fuel costs, while pickup sales fell -2.4% YoY due to tighter lending and fragile financial conditions among middle- and lower-income consumers. Meanwhile, exports declined by -6.3% YoY to 565,037 units, weighed down by Middle East tensions, which caused exports of vehicles and parts to the region to fall -49.1% YoY during March-August3/. For 2026, production4/ and domestic sales are projected to grow by 0.7-1.7% and 14.0-15.0%, respectively, while exports are expected to contract by -5.5% to -6.5%.
-
During 2027–2029, vehicle production is expected to grow by 1.0-2.0% per year, driven by higher BEV compensation requirements under the EV 3.5 scheme, which will increase to three times the volume of imports in 20275/, as well as potential policy measures favoring locally produced XEVs over imports. However, production growth may face headwinds from the expiry of BEV tax incentives from 2028 onward and ongoing production compensation requirements for XEV manufacturers. Domestic sales are projected to expand by 1.5-2.5% per year, driven by energy transition measures and favorable excise tax incentives for XEVs that boost demand and improve XEV affordability, as well as inventory clearance campaigns for passenger BEVs from accelerated production under the EV 3.5 scheme. Nevertheless, lending conditions are expected to remain stringent, particularly for the 1-ton pickup segment, which continues to await a meaningful recovery in consumers’ purchasing power. Meanwhile, exports are forecast to increase by 1.0-2.0% per year from a low base, aided by the expansion of export markets by BEV manufacturers and earlier investments in low-emission ICE pickups and BEV pickups6/ that are aligned with increasingly demanding environmental requirements in overseas markets.
EVs: BEV registrations are expected to ease following the expiry of EV 3.5 incentives, while HEVs benefit from the new excise tax structure.
-
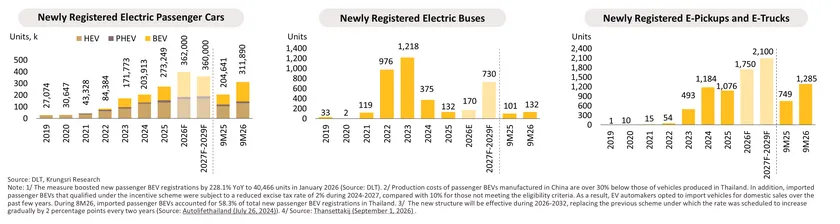
In 9M26, new registrations of passenger XEVs increased 52.4% YoY to 311,890 units. Passenger BEV registrations rose 32.3% YoY, driven by (i) accelerated deliveries of domestically-produced vehicles registered in January 2026, the final month eligible for subsidies under the EV 3.0 scheme1/; (ii) growing imports of cost-competitive BEVs from China, while excise tax incentives under the EV 3.5 scheme continued to keep imported BEVs relatively affordable2/; and (iii) higher fuel costs, which encouraged demand for energy-efficient vehicles. Meanwhile, registrations of passenger HEVs (+25.5% YoY) and PHEVs (+3.1% YoY) benefited from lower excise tax rates of 6-9% for locally-manufactured HEVs3/ and rising fuel costs. Registrations of electric buses and commercial EVs also increased by 30.7% YoY to 132 units and 71.6% YoY to 1,285 units, respectively, reflecting a new phase of electric bus deployment in the Bangkok Metropolitan Region (BMR), as well as stronger private-sector investment that boosted demand for commercial vehicles. For 2026, new registrations across all EV segments are expected to increase, with passenger XEV registrations projected to reach 362,000 units, while electric buses and commercial EVs are forecast at 170 and 1,750 units, respectively.
-
Over 2027–2029, passenger XEV registrations are expected to ease to average around 360,000 units per year. Passenger BEV registrations are projected to average 170,000 units per year, down from an estimated 215,000 units in 2026, reflecting the expiration of purchase subsidies under the EV 3.5 scheme from 2028 onward and potential price increases for imported BEV models following revisions to the excise tax structure. Meanwhile, registrations of passenger HEVs and PHEVs are expected to reach 170,000 and 20,000 units per year, respectively, benefiting from lower excise tax rates for locally-produced XEVs and fuel costs that are expected to remain elevated. Registrations of electric buses and commercial EVs are forecast to increase to around 730 and 2,100 units per year, respectively, lifted by (i) the phased deployment of 1,520 electric buses in the first procurement phase (2027) and a further 800 units in the second phase (2027-2033)4/, and (ii) the launch of new electric pickup and truck models with longer driving ranges per charge.
Data Center: Total revenue is set for solid growth, led by AI server investment, expanding cloud capacity, and rising data volumes.
-
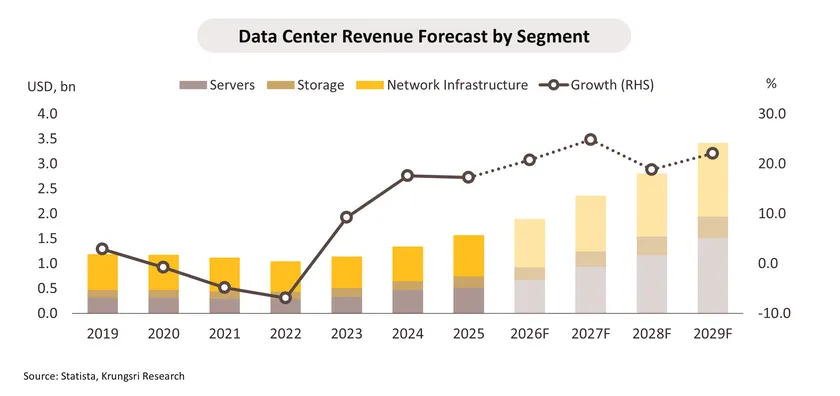
In 1H26, the Board of Investment (BOI) approved investment promotion for 88 digital-sector projects worth THB 885.7 billion (+161.2% YoY). Most of these were data center projects, driven by rising demand for cloud and AI services. However, because investment outpaced the regulatory framework and concerns grew over electricity use, water consumption, and environmental impacts, the government set up a data center board in August 2026. The board requested a slowdown in construction and a pause on new project approvals until minimum standards are finalized, which are expected by October. Nevertheless, total industry revenue is expected to grow by 20.2-21.2% in 2026, underpinned by existing projects that are gradually coming online.
-
Over 2027–2029, total data center industry revenue is forecast to grow by 21.4-22.4% per year, driven by three key segments. (i) Network infrastructure revenue is projected to expand by 14.9-15.9% per year, boosted by demand for high-speed networking in AI clusters and growing interconnect needs as global cloud providers continue to expand capacity in Thailand. (ii) Server systems revenue is expected to grow by 30.8-31.8% per year, underpinned by AI server investment by hyperscalers and cloud providers, as well as ongoing cloud migration. In addition, as data centers face tighter power and space constraints, operators are replacing older servers with AI-capable servers that are more energy efficient and have a higher unit value. (iii) Data storage systems revenue is anticipated to increase by 18.3-19.3% per year, fueled by rising data volumes from AI, digital transactions, and video, as well as data residency and backup requirements in the financial and public sectors.
Integrated Circuit (IC): Production and exports are expected to rise steadily, fueled by data center growth, higher EV output, and a deepening domestic electronics supply chain.
-
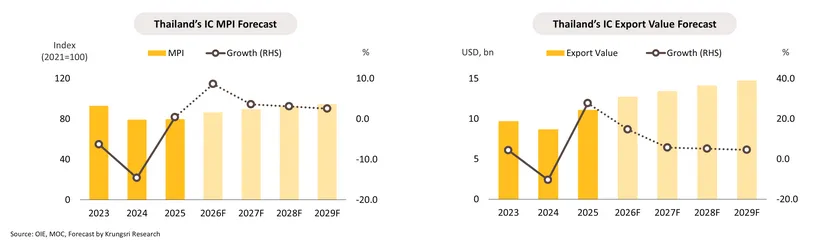
In 8M26, Thailand’s IC exports reached USD 8.7 billion, rising by 15.7% YoY. This came amid strong global semiconductor sales, which grew by 102.3% YoY in 1H26, while World Semiconductor Trade Statistics (WSTS) forecasts global IC sales to expand by 108.1% in 2026. Thai exports were backed by rising global sales of electrical appliances and IT equipment, growing investment in data centers, and increasing electric vehicle (EV) production worldwide. On the production side, Thailand’s revised IC Manufacturing Production Index (MPI) expanded by 8.0% YoY in 8M26, driven by global demand for electronics linked to digital technology and data processing, as well as by restocking after the inventory rundown (inventory index: -7.4% YoY). Thus, IC export value and production are expected to grow by 14.2-15.2% and 8.1-9.1%, respectively, in 2026.
-
Over 2027–2029, IC production is expected to expand by 2.6-3.6% per year, while IC export value is forecast to grow by 4.6-5.6% per year, underpinned by three tailwinds: (i) the global expansion of data centers and AI. However, Thailand does not yet benefit directly because it cannot produce advanced chips such as GPUs and high-bandwidth memory (HBM). Nevertheless, it benefits indirectly as a production base for other chips required by data centers, particularly analog and power management chips built on mature-node technology. (ii) Rising EV production in Thailand and worldwide. EVs use more chips per vehicle than internal combustion engine vehicles, especially in energy management systems, advanced driver-assistance systems (ADAS), and infotainment systems, so chip value per vehicle will continue to rise. (iii) The growth of the domestic supply chain on the back of investment promotion in recent years. This includes investment in data centers, printed circuit boards (PCBs), hard disk drives (HDDs), and smart electrical and electronic appliances, which are expected to strengthen domestic demand for ICs.
Hard Disk Drive (HDD): AI-driven storage demand and capacity expansion should keep production and exports on a steady upward path.
-
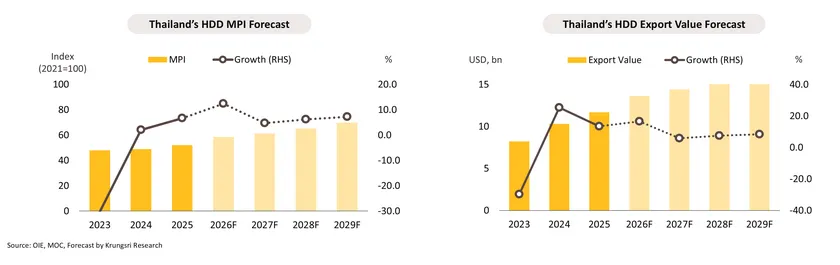
In 8M26, Thailand's HDD MPI rose by 9.7% YoY, while export value expanded by 19.1% YoY to USD 9.3 billion. The U.S., China, and Hong Kong were the three largest export markets. Growth has been driven by (i) growing demand for storage capacity from data centers and cloud services, which has risen alongside AI development and the increasing migration of corporate IT systems to the cloud, and (ii) the cost-per-capacity advantage of HDDs. High-capacity HDDs currently average around USD 15/TB, compared with USD 262/TB for NAND flash (the memory used in SSDs). As a result, NAND flash now costs more than 17 times as much as HDDs per terabyte, up from 7 times in 2025, according to Bloomberg Intelligence. For full-year 2026, HDD production and exports are expected to grow by 11.9-12.9% and 16.1-17.1%, respectively.
-
Over 2027–2029, HDD output is expected to grow at an average rate of 5.5-6.5% per year, while export value is forecast to expand by 6.7-7.7% per year. Growth will be underpinned by three tailwinds. (i) Global demand for data storage at data centers and cloud services will rise with AI usage, particularly as models are deployed in real-world applications (inference). Inference workloads generate new data that requires long-term storage, including usage histories, data for governance purposes, and training data for next-generation models. At the same time, the growing need to retain historical data for future model development will continue to create a structural tailwind for HDD demand. (ii) Investment in data centers and digital services in Thailand, the domestic downstream market for HDDs, will continue to expand. (iii) Manufacturers in Thailand are investing in capacity expansion and technology upgrades. These investments will enable them to produce HDDs with higher capacity per unit, faster data transfer speeds, and lower unit costs, positioning Thai producers to meet rising global demand.
Refinery: Refining margins are expected to remain at above-average level, driven by ongoing supply disruption in the Middle East.
-
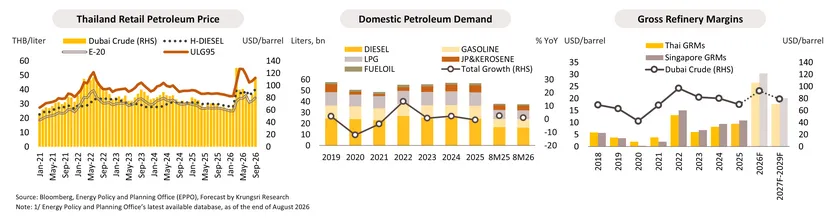
In 9M26, gross refinery margins (GRMs) remain significantly above the 2025 average, driven by ongoing Middle East tensions and the prolonged closure of the Strait of Hormuz—a key route for roughly one-third of global seaborne crude—tightening supply and pushing Dubai crude to hover at an average of USD 90.7/bbl (+28.0% YoY). At the same time, disruptions to refined product supply from attacks on refineries in the Middle East continue to tighten market conditions. As a result, ex-refinery prices for oil products such as Diesel and E20 increased by 21.3% YoY and 18.2% YoY, respectively. Domestic demand for refined products fell slightly by -0.8% YoY (January–August)1/, mainly due to a fall in Diesel consumption (-2.0% YoY), reflecting softened economic momentum and demand-side adjustments amid persistently high fuel prices. For the rest of the year, global crude prices will stay elevated due to the current impasse in the U.S.-Iran conflict. Therefore, the average Dubai crude price for 2026 is projected at USD 85-90/bbl (+25.0%), resulting in Thai GRMs averaging USD 24–29/bbl, up sharply from USD 9.5/bbl in 2025.
-
From 2027–2029, the oil refining industry is expected to continue benefiting from above-average refining margins, although the scope of further gains is limited. Refined product markets are likely to stay relatively tight, as Middle Eastern oil and gas facilities are gradually rebuilt, keeping product spreads elevated even after crude flows partially normalize. In the meantime, periodic conflict and logistics disruptions through the Strait of Hormuz could still recur, leaving crude and refined product prices volatile, albeit below the 2026 peak. In addition, Thailand’s steady economic growth should sustain demand for travel and goods transportation, bolstering refined oil consumption. Looking ahead, Krungsri Research expects Dubai crude in 2027-2029 to average USD 75–85/bbl, and Thailand’s GRMs will remain elevated at USD 14–22/bbl, compared to the 2019-2025 average of USD 6.5/bbl. Key downside risks for refiners include inventory losses on crude and product stocks accumulated at elevated prices during the conflict, while government policy intervention could constrain cost pass-through and gradually compress refining margins.
Petrochemical: Sales and exports are expected to grow at a modest pace, while spread recovery remains constrained by feedstock disruptions and oversupply.
-
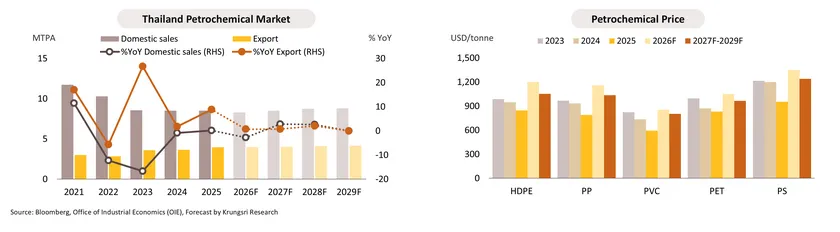
Petrochemical spreads for polyolefin products remained elevated during 9M26, particularly in HDPE (+12.7% YoY), LDPE (+8.0% YoY), and PVC (+30.0% YoY), as product prices rose faster than feedstock costs amid tightened regional supply. However, wider spreads did not translate into stronger margins for all producers. Since the effective closure of the Strait of Hormuz in March 2026, naphtha flows from the Middle East have been severely disrupted, forcing naphtha-based producers in Thailand and across Asia to declare force majeure and initiate supply rationalization. During September, the conflict reemerged, which pushed Dubai crude oil prices above USD 100/bbl and lifted feedstock costs again despite tepid downstream demand. In contrast, gas-based producers in the U.S. and Thailand, as well as China’s coal-based olefins, were relatively insulated and able to capture wider spreads. However, China also ramped up polyolefin exports at competitive prices, with persistent capacity additions. Consequently, this may intensify competitive pressure on Thai producers from Chinese imports, as China’s scale advantages could enable more aggressive price competition. Taking these factors together, Krungsri Research expects domestic sales to decline by -2.8%, while exports are projected to edge up by 0.7% in 2026.
-
During 2027–2029, feedstock cost pressures are expected to ease somewhat in line with likely lower naphtha prices. Meanwhile, a gradual recovery in the global economy and demand from downstream industries should support prices and spreads for several petrochemical products. However, the recovery in spreads is likely to remain constrained for products facing persistent oversupply, particularly ethylene, propylene, and paraxylene. At the same time, structural challenges remain intact, including (i) a more stringent domestic regulatory environment, particularly the expected enactment of the Clean Air Act and the Climate Change Act by 2027; (ii) full implementation of the Packaging and Packaging Waste Regulation (PPWR), and the Carbon Border Adjustment Mechanism (CBAM); and (iii) persistent oversupply from capacity expansions in China and India. Overall, domestic petrochemical sales and export volumes are expected to grow by an average of 0.8% and 1.2% per year, respectively.
Power Generation: Electricity demand is expected to grow, boosted by EVs and data centers, while the PDP2026 will favor investment in renewable power capacity additions.
-
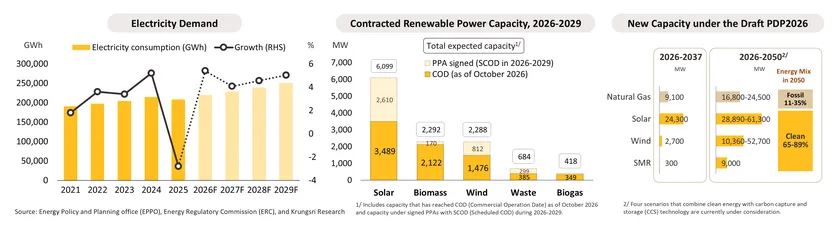
In 7M26, electricity consumption increased 6.0% YoY, with household consumption up 9.9% YoY, partly driven by higher average temperature (+0.4 °C YoY). Business and industrial consumption rose 4.8% YoY, boosted by the gradual recovery of tourism, as well as growth in AI-related production and services, including data centers. At the same time, power generation expanded 5.0% YoY, with natural gas-fired generation rising 13.9% YoY (60.4% of total generation). Thailand diversified its LNG import sources through higher imports from the U.S., Australia, and Malaysia, helping mitigate the impact of Middle East tensions, with imports from Qatar declining -44.3% YoY. Meanwhile, hydropower and renewable power generation rose 32.6% and 3.0% YoY, respectively. For full-year 2026, total electricity demand is expected to grow 4.9–5.9%, while the average electricity tariff for September–December is set at THB 3.86/unit.
-
Over 2027–2029, demand is expected to grow 4.0–5.0% annually, driven by gradual expansion in the Thai economy; continued EV adoption; growth in power-intensive data centers; and warmer weather due to El Niño conditions, particularly in 1H27. Amid tightening environmental regulations and the government’s supportive policies, renewable power generation will play a greater role, with 3,959 MW of new capacity expected during 2026-2029, around two-thirds from solar (2,610 MW). Meanwhile, natural gas will remain a key transition fuel, as reflected in the draft PDP2026, which targets 9,100 MW of gas capacity by 2037, second only to solar power. Over the longer term, clean energy, including renewables and SMRs, is set to account for at least 65% of total capacity by 2050. Key factors to monitor include the PDP finalization, progress on direct PPAs via third-party access (TPA), power criteria for data centers, and the escalation of Middle East tensions that could affect LNG prices.
Ready-to-eat Food: Domestic sales continue to grow steadily, driven by rising demand and economic recovery, while exports recover amid ongoing trade disruption risks.
-
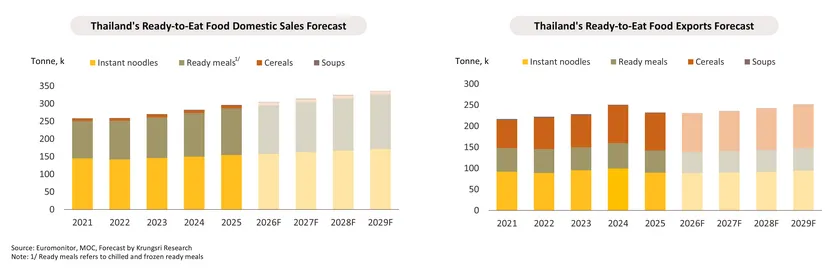
During 8M26, domestic sales continued to expand, underpinned by increasingly urban lifestyles and steady demand for affordable, convenient ready-to-eat (RTE) products, despite softer purchasing power amid economic uncertainty and high living costs. Meanwhile, export volume declined marginally by -0.2% YoY, as milder purchasing power in key export markets, particularly the U.S. and Europe, weighed on ready meals and RTE soups, offset by higher demand for more affordable and shelf-stable products, including RTE cereals and instant noodles. For full-year 2026, domestic sales are projected to grow by 2.5–3.5%, while export volume is expected to be broadly flat at 0.0% to -1.0%.
-
Over 2027–2029, domestic sales are expected to grow by an average of 2.8–3.8% annually, driven by (i) fast-paced lifestyles; (ii) new product development and premium segment expansion; (iii) continued convenience-store branch expansion; and (iv) a gradual recovery in domestic purchasing power. However, growth will be tempered by rising health consciousness, which favors healthier meal alternatives, and by volatile raw material costs. Meanwhile, export volume is expected to grow by an average of 2.4–3.4% annually, bolstered by rising demand for convenient foods among urban consumers and growing food security concerns in several countries, which boost demand for Thai dried and shelf-stable RTE products. Nevertheless, export growth may be constrained by (i) prolonged tensions in the Middle East, which could disrupt shipping routes and raise logistics costs; (ii) U.S. tariff measures, which affect demand in a key export market; and (iii) shifting consumer preferences toward healthier and less-processed foods.
Chilled, Frozen, and Processed Chicken: Production and domestic demand are expected to grow steadily in 2027–2029, while exports recover driven by processed chicken products.
-
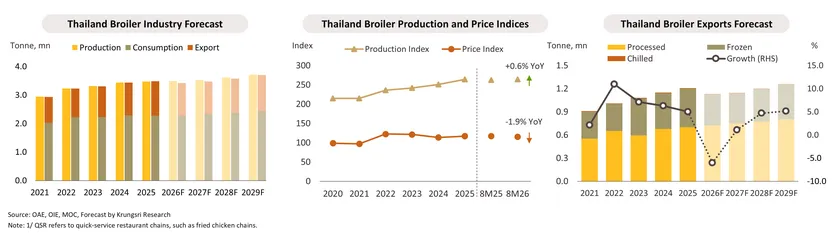
In 8M26, broiler production rose slightly, with the production index edging up by 0.6% YoY, while the price index declined by -1.9% YoY. Domestic consumption is expected to remain broadly flat, growing by 0.0–1.0%, tempered by weakening consumer purchasing power and a shift toward more competitively priced meats, especially pork. Meanwhile, export volume contracted by -5.5% YoY, as chilled and frozen chicken exports were weighed down by Middle East tensions, which disrupted regional trade flows and increased logistics costs, and China’s suspension of import approvals for selected Thai poultry processing plants, while processed chicken exports continued to grow steadily. For full-year 2026, production is projected to grow by 0.0–1.0%, domestic consumption by 0.0–1.0%, while total export volume is expected to decline by -5.5% to -6.5%.
-
Over 2027–2029, production is expected to grow by 1.6–2.6% annually, underpinned by improving domestic demand, a recovery in export markets, and capacity expansion among major producers. Domestic demand is expected to rise by 1.6–2.6% annually, bolstered by (i) gradually improving economic conditions; (ii) growing consumer preference for healthier and more sustainable protein sources; and (iii) expansion of the quick-service restaurant (QSR)1/ sector and pet food industries. However, competition from other meat products and alternative proteins remains a key challenge. Exports are projected to grow by 3.1–4.1% per year from a low base in 2026, primarily driven by processed chicken exports, which are expected to expand on steady demand in key markets, including Japan, and a global shift toward healthier, higher-protein diets. In contrast, chilled and frozen chicken exports are expected to decline in 2027, pressured by uncertainty over exports to China and intense price competition from Brazil and China, before recovering in 2028–2029.
Construction: Investment growth during 2027–2029 will be strengthened by public sector projects, despite rising cost pressures from construction materials and labor.
-
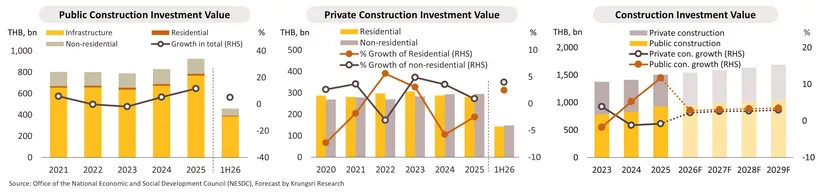
In 1H26, total construction investment reached THB 750.1 billion (+4.3% YoY). Public investment rose 5.0% YoY to THB 458.7 billion, propelled by transport infrastructure and accelerated budget disbursement in 1Q26, before softening in Q2 2026. Private investment increased 3.2% YoY to THB 291.4 billion, underpinned by residential (+2.5% YoY) and non-residential construction (+4.0% YoY). Full-year 2026 investment is expected to grow by 2.5–2.7%. Key risks include supply-side tightening stemming from the Middle East conflict, driving up energy, transport, and material costs, while Sep–Oct flooding may temporarily delay construction in the BMR and eastern region.
-
During 2027–2029, construction investment is projected to grow by 2.8–3.3% per year, bolstered mainly by public infrastructure, particularly rail, other transport-related, water resources, and EEC projects. Private construction is expected to recover gradually, led by high-potential areas, factories, warehouses, industrial estates, and data centers, while residential construction remains constrained by weak purchasing power and tight credit
-
Public construction investment is projected to grow by 3.0–3.5% per year, driven by major infrastructure projects in rail, roads and motorways, ports, water resources, airports, and utilities. EEC infrastructure projects and projects in other regions are expected to gradually enter a new investment cycle, including projects connecting industrial areas, ports, airports, and logistics networks, alongside greater utilization of PPPs. However, delays in project approvals, financing, site handovers, and contract amendments, particularly for key EEC projects, could postpone bidding and contractors’ revenue recognition.
-
Private construction investment is projected to grow by 2.5–3.0% per year. Residential construction is expected to recover gradually following fewer new project launches and inventory reductions, although growth will remain modest due to weak purchasing power and tight lending conditions. Factory, industrial estate, and data center construction will continue expanding, particularly in the EEC, supported by supply chain relocation, foreign investment, and government investment promotion measures. Commercial building construction is likely to see limited growth and remain concentrated in high-potential locations, with retail space backed by mixed-use developments and tourism, while new office construction is expected to slow amid oversupply, shifting investment toward high-quality buildings and upgrades of existing properties.
Housing (BMR): The housing market is gradually recovering amid persistent constraints on purchasing power.
-
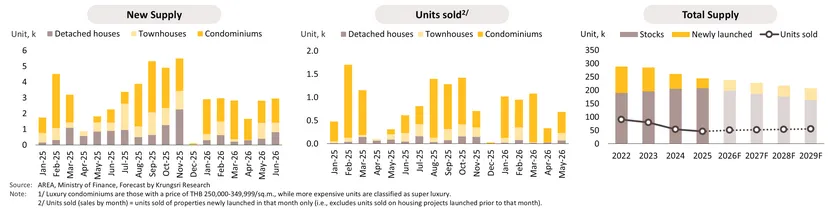
In 1H26, the housing market performed better than expected, with total sales rising by 15.6% YoY to 24,652 units, led by condominiums (+26.5% YoY) and townhouses (+8.7% YoY), while detached house sales declined by -6.6% YoY. The increase reflected developers’ efforts to clear completed inventory, government support measures, and a low base in the previous year. Newly launched residential supply also rose by 13.6% YoY to 16,107 units, driven by a 40.9% YoY surge in condominium launches, particularly in the luxury segment, as developers sought to capture demand from high-income and foreign buyers. In contrast, low-rise launches continued to contract, with detached houses declining by -29.3% YoY and townhouses by -0.3% YoY. In 2H26, housing market growth is expected to moderate amid weak purchasing power among middle- to lower-income households, high household debt, and mortgage rejection risks. Flooding in parts of the BMR in early October may further delay purchase decisions. Nevertheless, demand for luxury condominiums1/ and foreign buyers is expected to cushion the market slowdown. For full-year 2026, total sales are projected to grow by 8.6%, while newly launched residential supply is forecast to increase by 4.8% to 39,300 units, as developers remain cautious about new launches, particularly in flood-prone areas.
-
During 2027–2029, the housing market is expected to expand gradually, with new launches rising by an average of 3.2–4.0% per year to around 42,000 units, 60% below the pre-COVID-19 average of 110,000 units in 2017–2019. Meanwhile, total sales are forecast to grow by 2.9–3.7% per year. Key drivers include (i) a gradual economic recovery and stronger purchasing power; (ii) the full operation of new mass transit lines, particularly the Orange Line (Taling Chan–Min Buri) and the Southern Purple Line (Tao Poon–Rat Burana), opening up new high-potential locations; and (iii) demand from foreign buyers seeking safe-haven destinations amid geopolitical conflicts and from skilled expatriates relocating to Thailand. However, growth will remain constrained by (i) high household debt; (ii) increasing difficulties among borrowers in meeting lending criteria, with the issue extending to middle-income households; (iii) rising development costs amid geopolitical conflicts, together with investment in ESG-compliant and climate-resilient designs, which could push up housing prices; and (iv) demographic pressures from an aging population and younger generations’ growing preference for renting over homeownership.
Office Building (BMR): The flight-to-quality trend is boosting demand for Grade A+ offices, while older buildings face intensifying competition.
-
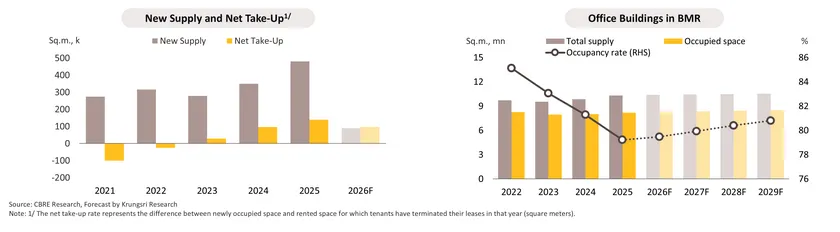
In 1H26, total accumulated office supply remained unchanged from the end of 2025 at 10.3 million sq.m., as no new projects were completed during the period. Meanwhile, net take-up reached 37,836 sq.m., bringing occupied space to 8.2 million sq.m. (+1.8% YoY) as landlords offer more flexible lease terms, such as longer rent-free periods and partial office fit-outs, lifting the occupancy rate slightly to 79.6%. For the remainder of 2026, demand is expected to grow amid the continued flight-to-quality trend, with MNCs and businesses in New S-Curve industries, such as EVs, digital, and advanced medical industries, increasingly relocating to Grade A+ buildings. Thus, occupied space is projected to rise by 1.2% to 8.3 million sq.m. by year-end, while older Grade A and B buildings will face greater pressure to retain tenants, including by maintaining competitive rental rates. On the supply side, approximately 90,000 sq.m. of new office space is expected to enter the market, including One Bangkok Tower 2 and Thai Group Quarter, bringing total accumulated supply to 10.4 million sq.m. (+0.9%). Net take-up is projected to reach 100,000 sq.m., with the average occupancy rate edging up to 79.5%, slightly above 79.2% in 2025.
-
During 2027–2029, office demand is expected to gradually improve, underpinned by tourism recovery, expansion in technology, finance and digital services, increased FDI by MNCs in Thailand’s targeted industries, and demand from luxury retail brands for high-quality CBD offices. However, fragile purchasing power and an uneven economic recovery are likely to restrain business investment and office expansion. As a result, office demand is projected to grow by an average of 0.7–1.3% annually. Meanwhile, new office supply is expected to grow at a slower pace following substantial additions in previous years, with total accumulated supply projected to increase by an average of only 0.1–0.7% per year. As demand outpaces supply, the market is expected to gradually absorb excess vacant space, lifting the occupancy rate to 80.4% by 2029. Rental rates are expected to remain stable or edge up slightly, with Grade A+ offices in CBD locations commanding a premium. However, rental growth in other segments will remain limited amid continued high-quality supply and the flight-to-quality trend. Older buildings and those in non-CBD locations may need to offer competitive rents to maintain occupancy and competitiveness.
Hotel: The occupancy rate is expected to rise slightly during 2027–2029, amid recovering international arrivals and modest growth in domestic tourism.
-
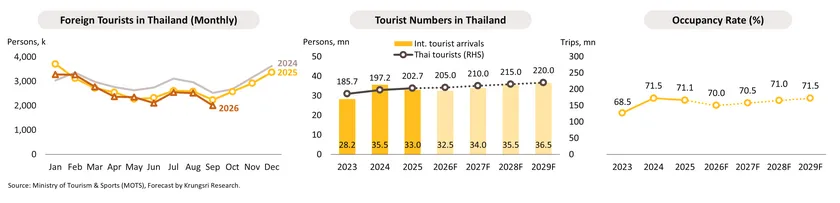
International tourist arrivals reached 23.2 million in 9M26, down -3.8% YoY, amid higher travel costs and stronger regional competition. Arrivals from Malaysia (12.7% share) and ASEAN excluding Malaysia (13.6% share) fell -15.2% and -15.7% YoY, respectively. Indian arrivals (7.5% share) declined -2.5% YoY, contracting since June partly due to visa uncertainty affecting advance bookings, despite Thailand's subsequent confirmation of visa-free entry. In contrast, Chinese arrivals (17.0% share) rose 15.2% YoY, boosted by recovering travel confidence, increased flight connectivity, and a low-base effect from last year. Meanwhile, domestic tourism grew 2.7% YoY to 152.4 million trips, helped by government campaigns, including “Seeking Thailand’s Wonders” (May–July) and “Saneh Thai: Feel All the Feelings” (June–September). Nationwide hotel occupancy rate edged up to 62.5% in 8M26 from 62.4% a year earlier. For the remainder of 2026, international arrivals are expected to improve slightly during the high season, despite economic headwinds and volatile global energy prices. Chinese arrivals are likely to maintain growth momentum through year-end, while domestic tourism may soften due to extensive flooding in BMR and eastern Thailand during September–October. For full-year 2026, international arrivals are projected at 32.5 million (-1.4% from 2025), while domestic tourism is expected to grow just 1.1% to 205 million trips. The nationwide hotel occupancy rate is forecast at 70.0%, slightly below 71.1% in 2025.
-
During 2027–2029, international tourist arrivals are expected to recover gradually, driven by (i) the recovery of key markets, particularly China, alongside growth in arrivals from India, Russia, and emerging markets; (ii) increased flight frequencies and airport capacity; (iii) visa facilitation measures; (iv) growth in Wellness & Medical Tourism and the Digital Nomad segment; and (v) infrastructure development and improved connectivity between tourist destinations, which will enhance tourism capacity and disperse visitors to new destinations. However, key downside risks remain, including (i) a potential slowdown in China's economy; (ii) intensifying competition from Vietnam and Japan; and (iii) persistently high living and travel costs. Accordingly, international tourist arrivals are projected to reach 34.0 million in 2027, 35.5 million in 2028, and 36.5 million in 2029, while domestic tourism is expected to average 215–220 million trips annually. The nationwide hotel occupancy rate is forecast at around 70.5–71.5%, with major tourist destinations, including Bangkok, Chonburi, and Phuket, expected to record occupancy rates above 71.5%, fueled by the continued recovery in international tourist arrivals.
Sea Freight Transport: Volumes are expected to expand on resilient trade and investment, while fleet expansion and geopolitical risks remain key headwinds.
-
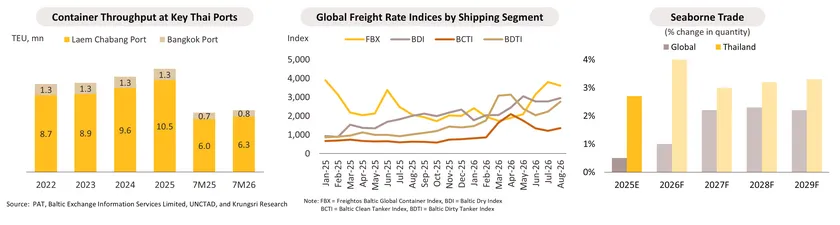
In 7M26, Thailand’s sea freight transport business remained underpinned by growing international trade. Export and import values rose by 18.2% and 39.7% YoY, respectively, reflecting continued production and trade activity in manufactured goods, raw materials, intermediate goods, and capital goods. Growth remained resilient despite disruptions to maritime trade routes and higher logistics costs stemming from Middle East tensions. Combined container throughput at Laem Chabang and Bangkok ports also increased by 4.3% YoY to around 7.1 million TEUs, with volumes at Laem Chabang and Bangkok ports rising by 4.6% and 1.8% YoY, respectively. Freight rates remained elevated and volatile amid route constraints and tight effective vessel supply. Container and dry bulk freight rates increased during the mid-year period, while tanker rates remained volatile due to constraints around the Strait of Hormuz. For 2026, Thailand’s sea freight transport volume is forecast to expand by 3.5–4.5%, accelerating from 2.7% in 2025, although growth momentum is expected to moderate in 2H26.
-
Over 2027–2029, Krungsri Research forecasts Thailand’s sea freight transport volume to expand by 2.7–3.7% per year, averaging 3.2%, driven by (i) steady expansion in the global economy, with the IMF expecting growth to settle at around 3.2% over the medium term, alongside further expansion in global trade volume; (ii) continued investment and diversification of production bases into Thailand and ASEAN, particularly by Chinese firms pursuing the China+1 strategy; (iii) continued growth in Asian and Middle Eastern markets, which should broaden export opportunities for Thailand; (iv) rising energy import demand, particularly for LNG to substitute for domestic natural gas supply; and (v) upgrades to port infrastructure and technology, which should improve port efficiency and cargo-handling capacity. Key headwinds include (i) global vessel oversupply risk, as new fleet capacity additions could outpace demand growth, particularly upon normalization of the Red Sea-Suez Canal route; (ii) ongoing geopolitical risks surrounding key maritime chokepoints; (iii) persistent trade protectionism and shifts in trade routes; (iv) tighter environmental regulations that could raise operating costs and investment requirements; and (v) intensifying competition from regional ports, particularly in Singapore, Malaysia, and Vietnam, which could divert cargo flows from Thailand.
Medical Devices: Production is expected to recover on improving export demand and sustained domestic sales amid rising health consciousness.
-
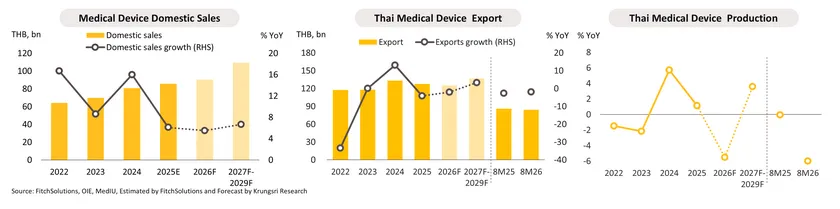
In 8M26, Thailand’s medical device production index contracted by -6.0% YoY, pressured by lower production of blood transfusion and infusion sets (-10.3% YoY), syringes (-12.5% YoY), disposable medical devices (e.g., face masks, caps and gowns) (-25.4% YoY), and ophthalmic lenses (-3.5% YoY), amid weaker exports, which account for 91.9% of total production value. The overall medical device exports declined by -1.9% YoY, due to (i) intensifying price competition in medical consumables, Thailand’s major export category, from major producers such as China and Malaysia (ii) a slowdown in the global economy amid the Middle East conflict that may weigh on purchasing power in some trading partners, and (iii) China’s promotion of domestic medical device production and procurement, limiting demand for imports from Thailand. Meanwhile, the domestic market continued to grow, propelled by an aging population, rising prevalence of non-communicable diseases (NCDs), and expansion of medical services. In 2026, medical device production and exports are expected to contract by -5.0% to -6.0% and -1.5% to -2.5%, respectively, while domestic sales are projected to grow by 5.0–6.0%.
-
During 2027–2029, medical device production is expected to recover and grow by an average of 3.1–4.1% per year, reinforced by economic recovery that will strengthen purchasing power in both domestic and export markets, as well as growing investment in advanced medical devices and associated components, which will boost production volumes. Meanwhile, the domestic market is expected to grow by 6.2–7.2%, driven by (i) an increasing number of patients with non-communicable diseases (NCDs) and a growing elderly population; (ii) rising preventive healthcare trends, which will increase demand for disease screening and prevention devices; (iii) growth in medical tourism; and (iv) expanding public and private investment in hospitals and specialized medical centers. Meanwhile, exports are expected to grow by an average of 2.9–3.9% per year, in line with a gradual global economic recovery, expanding medical services, rising global demand for medical consumables, and greater alignment with international manufacturing standards, which will create opportunities for export market expansion. However, intense price competition from major producers, particularly China and Malaysia, and uncertainty surrounding international trade policies will continue to weigh on exports.

The 2026–2027 El Niño is expected to intensify into a Super El Niño, damaging the output of Thailand's key agricultural commodities, particularly rice, cassava, sugarcane, and oil palm.
-
The world entered El Niño conditions in Q2 2026, and the current episode is expected to intensify to a Very Strong El Niño, with the potential to develop into a Super El Niño. The event is expected to affect supply chains and the broader Thai economy through 2026-2027. Krungsri Research has developed two El Niño scenarios:
-
Severe case (60% probability; base case): the index rises to a strong level from August 2026 and intensifies to a very strong level during October-November 2026, before gradually returning to neutral conditions by mid-2027 and transitioning to a weak La Niña from August 2027 onward.
-
Extreme case (40% probability; Super El Niño case): the RONI index reaches a new record high in November 2026 before reversing sharply and weakening to a moderate La Niña in the second half of 2027.
-
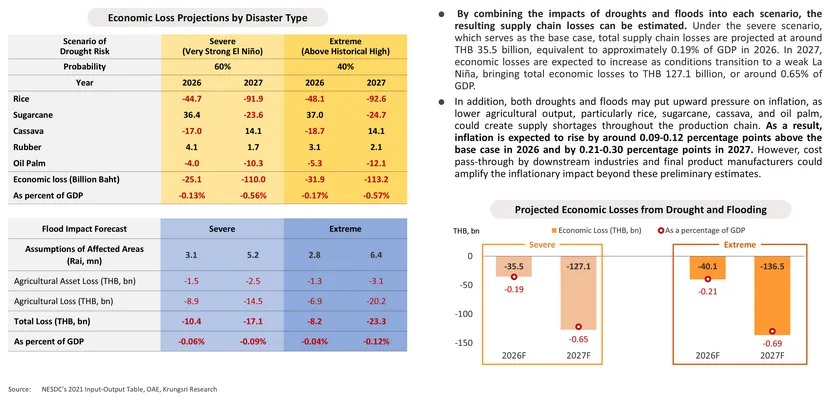
Krungsri Research assessed the impact on the output of key crops (rice, sugarcane, cassava, rubber, and oil palm) by incorporating several cultivation-related factors, including limited irrigation coverage and low reservoir levels, prolonged dry spells that reduce water availability for crop growth, hotter and drier weather conditions, and elevated production costs. Based on this assessment, rice, cassava, and oil palm are expected to experience the most significant losses in 2026, while rice, sugarcane, and oil palm are likely to be the most affected crops in 2027.
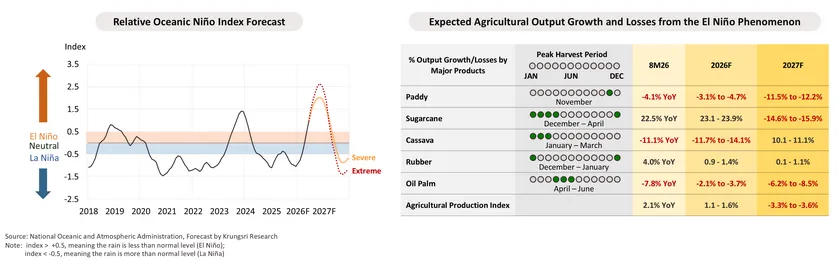
Economic losses from the agricultural supply chain due to droughts and floods are projected at THB 36–40 billion in 2026, increasing sharply to THB 120–140 billion in 2027.
Back