EXECUTIVE SUMMARY
From 2023-2025, sea freight operations should enjoy a brighter outlook, thanks to steadily improving global and Thai economic conditions and income from freight charges that will remain above its pre-COVID level. Meanwhile, the supply of new ships will expand only slowly. The industry will be affected by a number of headwinds. (i) As the supply of new shipping capacity expands and new entrants to the market proliferate, competition on price will tend to be stiffer. (ii) Costs will likely rise, both for fuel (prices for which will remain fluctuate on the ongoing Russia-Ukraine war) and as a result of the need to better control pollution from older vessels. (iii) The Thai merchant fleet is somewhat limited and so Thai liners occupy only a small share of the market relative to the size of the Thai export sector and the volume of goods distributed from Thailand to the rest of the world, and this will then weigh on opportunities for growth.
Krungsri Research view
Krungsri Research views that sea freight business outlook is diverse depending on types of vessels.
-
Containerized shipping: Income will rise for ship owners, shipping lines, and freight forwarders due to a combination of recovery in the world economy and rising demand for goods generally, and the easing of earlier problems with the recirculation of shipping containers. However, demand for shipping services will strengthen only gradually. In order to ensure that ships sail with full holds, operators will thus need to be careful to balance the supply of cargo space with the demand for shipping services. In addition, this business is likely to intensify from 2025 onwards as a 2017 agreement between Maersk and Mediterranean Shipping Company (MSC), the world’s two biggest container shippers, that currently restricts competition on prices and shipping lines will end in 2025. This will likely result in a price war as these two players fight for market share, and Thai operators may be caught in the crossfire.
-
Bulk cargo: Income will slowly trend upwards on greater demand for commodities, construction materials, metals, and ores, for which demand is gradually improving. In addition, the manufacturing sector is restocking and securing supplies of inputs and raw materials in anticipation of the economic recovery in the period ahead. This too will add to the demand for cargo services and sustain income from freight charges. However, earlier orders for new ships are now being completed, and income growth would be limited as these are delivered and capacity increases.
-
Tankers: Players can look forward to solid rates of income growth thanks to demand for oil and chemical products which is encouraged by i) the rebound in the economy, and ii) strong demand for inputs as companies look to reduce the risk of raw materials shortages and fluctuation of global energy prices, which are affected by the prolonged Russia-Ukraine war. Operators will also be able to generate income from leasing and charter services, and from associated major factors of production for industries across the country.
Overview
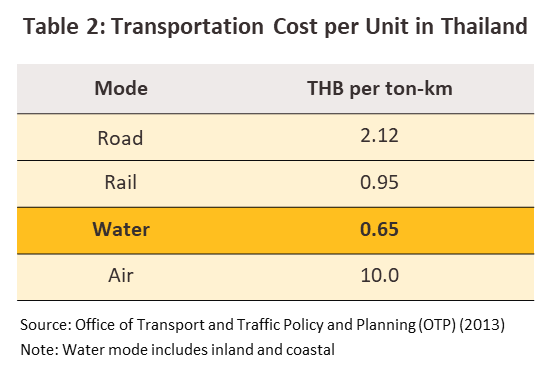
Sea freight plays a central role in facilitating international trade, and in addition to underpinning the health of global supply chains by moving raw materials to production sites around the world, sea freight is essential to ensuring that global markets continue to meet the needs of producers and consumers. The sea freight industry is linked to a broad range of other domestic and international activities, including warehousing, transportation, and end-point distribution. Therefore, there are a wide range of sea freight services provided by type of vessel (figure 1). Moving goods by maritime channels offers a number of advantages, most obviously that a large quantity of heavy, bulky goods may be shipped together, and this then makes sea freight considerably cheaper than alternatives for a given weight of goods (average freight charges come to THB 0.65/tonne/kilometer for sea transport, compared to THB 0.95, THB 2.12 and THB 10.0 for respectively rail-, road- and air-based alternatives)1/. In addition, maritime freight has the benefit of flexibility, have now generally been modernized with regard to both transportation systems and the fuels that they use, and containerization means that goods can be shipped with a high degree of safety. Nevertheless, it does have its disadvantages, that it is relatively slow in comparison to the alternatives, and other transport modalities still need to be utilized when moving goods to the final point of delivery. Given this, by volume and value, currently sea freight of global merchant fleet accounts for respectively over 80% and 70% of all international trade2/ (the latest data as of 2021).
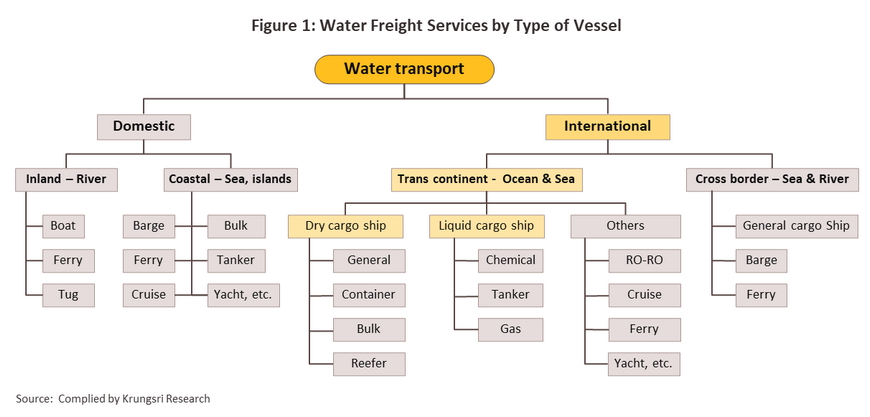
Sea freight services3/ can be subdivided into several categories.
1) Services may be categorized according to the type of vessel or ocean carrier. (i) Ships moving dry cargo4/ include bulk carriers, container ships, and reefer containers (temperature-controlled containers) as well as specialist or multipurpose vessels (e.g., roll-on/roll-off or RO-RO ships). (ii) Vessels moving liquid cargoes include oil tankers, LPG and LNG tankers, together with ships used to move chemicals, petrochemicals, other dangerous substances, vegetable oils, and so on.
2) Services may also be categorized according to the routes on which they operate. (i) Shippers run services on regular lines according to fixed schedules (Liner services), for which freight rates are set for particular periods. Most of these services operate on the major trans-pacific, Asia-Europe, and transatlantic routes, though intra-regional services also exist. (ii) Tramp or time charter services run on lines and at times according to the terms of the hire agreement. Likewise, freight rates are also determined on an individual basis as set in the charter agreement, though the hiring organization is often responsible for paying fuel costs.
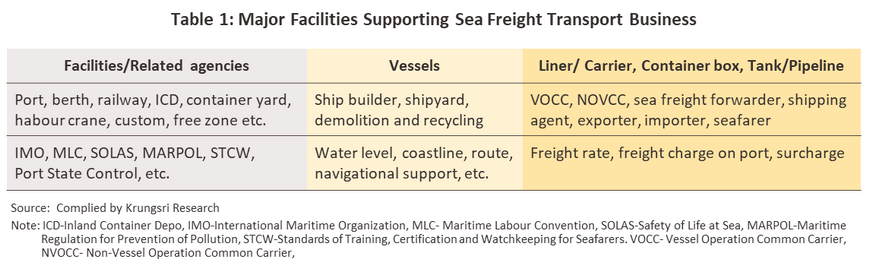
Sea freight companies operate globally to move goods port-to-port. Given the benefits that they offer in terms of both costs and time, operators generally rely on other companies or other parts of their commercial network for services including entering and exiting ports, dealing with customs, and offloading goods en route to a final destination (Table 1). The various types of sea freight operations are described below.
-
Shipping lines, vessel operating common carriers (VOCCs), and ocean common carriers operate their own fleets and either manage their own containers to shift goods on regular routes (most of these are large operations) or they may operate charter services (mostly undertaken by small, local operations). These typically run domestic and international branch offices or have partnered with other businesses to offer a similar service. Brokers will source shipping capacity or goods to ship, while agents will attempt to sell cargo space, thus ensuring that ship or freight utilization rates are as high as possible.
-
Shipping line agencies operate as middlemen selling cargo space to third parties. These include: (i) importers and exporters that buy space directly on lines as needed; (ii) service operators and freight forwarders that do not have contracts with major carriers but that offer services to smaller clients moving lower volumes of goods; and (iii) non-vessel operating common carriers (NVOCCs) and international freight forwarders that resell cargo space to their clients along with related services such as stevedoring, arranging storage, container packing5/, and customs clearance.
Entering the market to supply sea freight can carry heavy capital overheads and repayment horizons may be very extended, since if operators do not lease ships, they will need to establish their own fleet. In addition, staff require specialized knowledge, and to ensure that cargo is managed effectively in destination countries, shippers need either to operate their own branches there or to work with trusted partners. The international regulatory environment may also be complex and in addition to maritime matters, operators will need to comply with rules on employment, the environment, and the security of goods in transit. Moreover, operators are exposed to risk arising from fluctuations in the economic outlook and in the price of fuel, changes in the terms of global trade and variations in the rules, regulations and incentives that may be in effect in different parts of the world.
Competition may be somewhat intense since goods are transported through international waters open to shippers worldwide. Income comes from the freight rates that operators charge, though these can vary depending on the demand for space, the supply of capacity at a particular point in time, and the type of service being offered. The latter includes shipping goods on regular routes, in which case fees will be charged according to the volume of goods and the distance to the destination, or charter services, in which case fees will be agreed on an individual basis, though this might be for chartering an empty vessel or for the delivery of a pre-agreed cargo. The principal costs faced by operators are: (i) voyage costs which are largely accounted for by bunker fuel and piloting and port charges; (ii) other operating overheads, which include manning costs (covering salaries and payments to staff such as per diem allowances), repair and maintenance of ships, insurance fees, and fees, charges and other expenses levied on operators; and (iii) capital costs incurred in the lease or purchase of ships and the interest that is charged on this.
Effective management can help to increase operating efficiencies and through this, add to profits. (i) Spending too long queueing for port calls to load/unload goods may affect an operator’s ability to take on or offload goods at the next port. Sea freight companies thus work with brokers and agents or with trusted partners and branch networks that are familiar with local operators and that have solid local connections, which then helps to minimize opportunity costs. (ii) To hedge against risk from fluctuating exchange rates and energy prices operators will typically take out insurance or enter into forward contracts. (iii) Arranging protection and indemnity insurance that covers cargo, ships, machinery, crew, and third-party liabilities helps to cut losses in the event of unexpected or unusual events, such as damage or loss to cargo, piracy, or unfavorable climatic events.
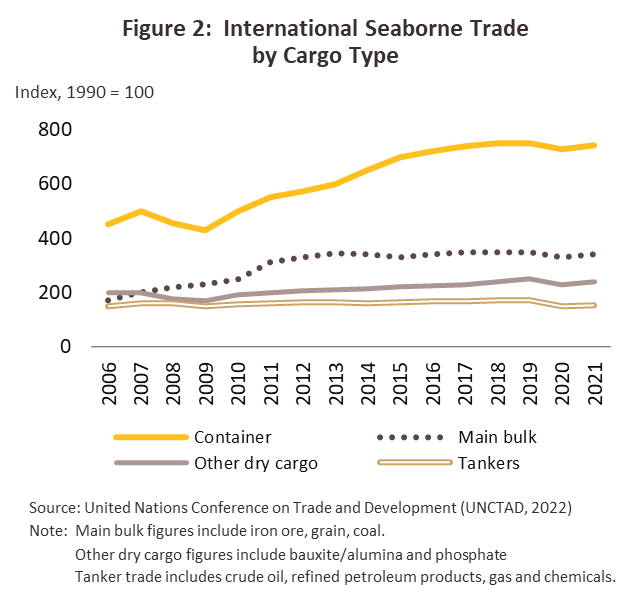
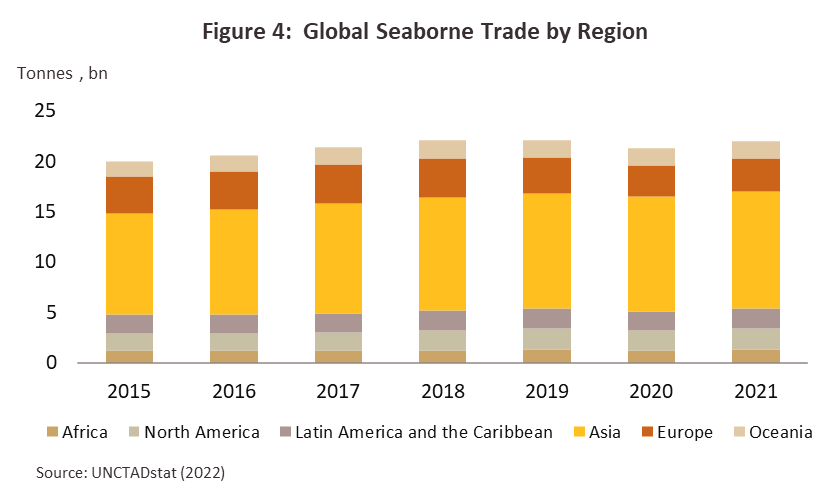
Demand for sea freight services has grown steadily over the years, moving in step with expansion in global trade and growth in the world economy. Thus, in the decade prior to the COVID-19 pandemic (2010-2019), the markets for containerized and bulk freight enjoyed average annual growth of respectively 5.8% and 5.0% (Figure 2 and Figure 3). As a result, ship sizes have increased as operators have looked to move ever-larger quantities of cargo. For example, Chinese ships now carry more than 24,000 containers or 240,000 tonnes of goods, which has had the fortunate side-effect of cutting carbon emissions by 6,000 tonnes per year. Thanks to the region’s rapid economic growth and its position as a center of agricultural and manufacturing sectors, Asia’s import-export sector has grown steadily and the region is now the busiest in the world regarding sea freight services (Figure 4), accounting for more than half of all goods shipped by sea and 62.5% of containers in circulation (source: UNCTAD). Within the ASEAN region, as measured in imports and exports at the most important ports, Singapore is responsible for the largest single share of the maritime shipping market, followed by Thailand and then Malaysia.
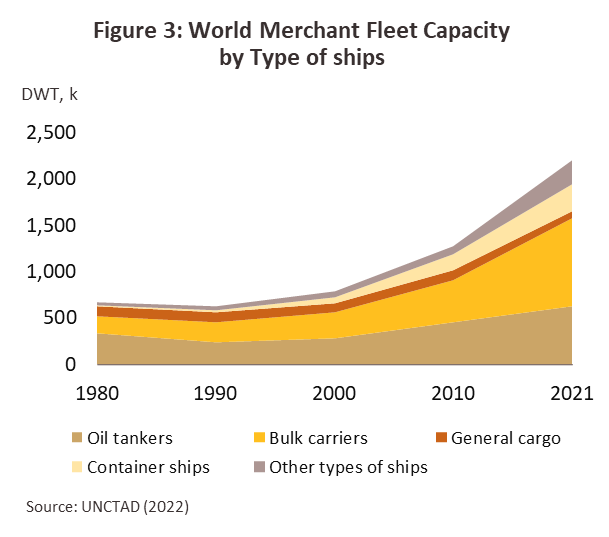
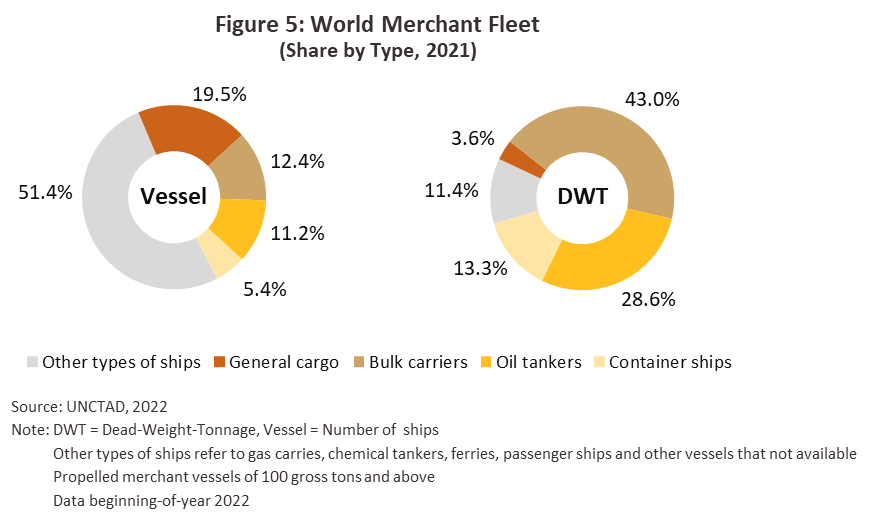
As of 2021, the global merchant fleet numbered 102,899 ships (Figure 5) with a combined tonnage of 2.2 billion dead-weight tonnage (DWT). These vessels may be split into various classes. General carriers comprise 19.5% of the total by the number of vessels and 3.6% by tonnage, and these have an average working life of somewhat longer than 27 years. By number, bulk carriers are in second place with 12.4% of the total, while by weight, they account for a full 43.0% of the global fleet with an average lifespan of 11 years. 11.2% of the fleet are oil tankers (28.6% of the total by tonnage), and these have a lifespan of 19 years. Lastly, container ships comprise 5.4% of the total by number but 13.3% by tonnage, and these typically have a working life of 13 years. The relatively short lifespan of bulk and container carriers is explained by the heavy and growing demand for these services, which has meant that the number of these vessels has expanded more rapidly than have other types of ship. Regarding national fleet sizes, the 5 largest are China (including Hong Kong SAR, which accounts for 17.9% of the global fleet), Greece (17.6%), Japan (10.9%), Singapore (6.2%), and South Korea (4.2%). Together these 5 countries therefore control 56.7% of the world’s shipping fleets. By comparison, with 0.24% of the total, Thailand sits in 45th place in the world rankings.
The importance of Thailand’s maritime freight industry has been building steadily, helped by a number of factors. (i) The Thai economy is heavily reliant on global trade, and over 90% of goods imported to and exported from the country are moved by sea. (ii) Thailand has signed a range of agreements on economic cooperation that aim to increase trade and investment flows between members. These include the ASEAN Economic Community (AEC) and the Regional Comprehensive Economic Partnership (RCEP). (iii) Thailand is host to production facilities that are integrated into the global supply chains of major industries, (e.g., the production of autos and auto parts). (iv) To help develop the competitiveness of Thai industry and trade, the government plans to develop the infrastructure required to support greater use of sea and coastal freight services.
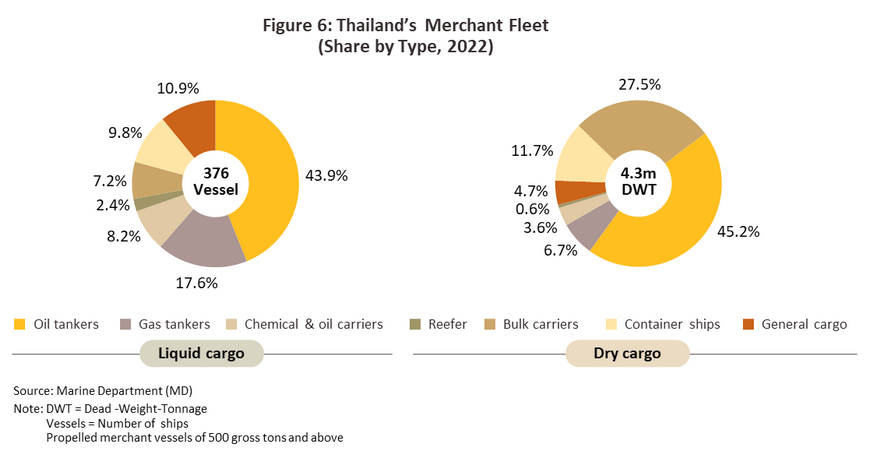
The Thai merchant fleet may be divided into two main groups6/ (Figure 6):
-
Liquid cargo ships: Thai companies operate 262 vessels in this class, and these have a combined capacity 2.4 million DWT (respectively 69.7% and 55.5% of the total national merchant fleet). Of this total, 165 vessels are oil tankers, 66 are natural gas tankers, and 31 are used to transport chemicals and oil products. The main customers for the services provided by these are principally operators of oil refineries and major oil importers, which generally have oil storage facilities in coastal areas, as well as overseas manufacturers and distributors. Cargo is typically crude, chemicals, liquid refinery products, natural gas, and vegetable oils.
-
Dry cargo ships: The Thai merchant fleet includes 114 dry cargo vessels and these have a capacity of 1.9 million DWT (30.3% and 44.5% of the total, respectively). This includes 41 general purpose cargo ships, of which 62% have a capacity not greater than 5,000 DWT, which then account for 10.5% of the total capacity of Thailand’s dry cargo fleet. Thai players also operate 27 dry bulk cargo vessels and these are principally used to transport commodities including cereals, metals, fertilizer, sugar, and coal. 96% of these have a tonnage in excess of 20,000 DWT, and these thus represent 61.9% of total capacity in this class. Thailand has 37 container ships, 56% have a capacity less than 5,000 DWT (26.2% of the total). Finally, the merchant fleet includes 9 reefer ships equipped to transport temperature-controlled products in containers. None of these have a capacity over 5,000 DWT and so these account for just 1.4% of total capacity. (Thai container and reefer cargo ships are generally relatively small since they are used as feeder vessels between coastal ports and large vessels call at deep water ports or transshipping goods over short distances to neighboring countries).
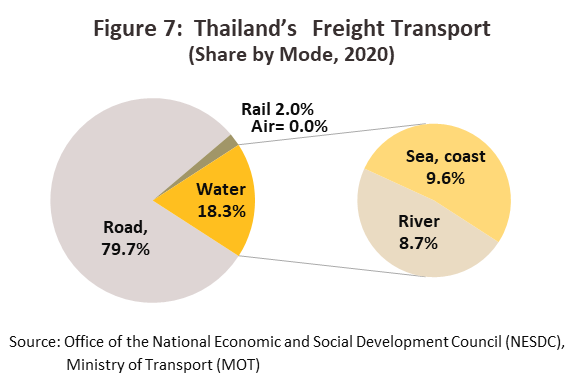
By volume, 18.3% of domestic shipments are made by waterborne transport (Figure 7), shipment cost per unit for water transport are lower than for any other modality (Table 2). Coastal and open-water shipping accounts for 9.6% of the total, with inland (i.e., rivers and canal) shipping adding another 8.7% to this. International shipping mostly passes through Thailand’s major ports, that is, Bangkok (Khlong Toei), Laem Chabang, and Map Ta Phut, though inland facilities in, for example, Rayong, Songkhla, Chiang Saen, and Chiang Khong may be used when shipping goods between Thailand and neighboring countries.
Thai operators are, however, somewhat uncompetitive on world markets. (i) The Thai merchant fleet is small, numbering only 391 vessels (source: UNCTAD). Thailand, therefore, accounts for just 0.8% of the global merchant fleet. Furthermore, by capacity, at 2.2 million DWT, Thailand’s contribution falls to only 0.24% of the total (correct as of 2021). This is because 72% of the Thai fleet, or 271 vessels, are classed as ‘small’ (i.e., they have a cargo capacity of less than 5,000 DWT) and only 42 ships (or 11% of the total) are considered ‘large’ or have a capacity in excess of 20,000 DWT. Thai-flagged carriers, therefore, carry a meager 7% of Thailand’s international trade7/, most of which is intra-Asia trade, and so the remainder (93%) is carried by foreign shippers (generally European and Asian companies). (ii) The Thai merchant fleet is largely old aged, which means that both maintenance and fuel costs are high. This then negatively impacts the industry’s price competitiveness. For example, oil and gas tankers typically have a service life longer than 25 years. For reefers, this extends to an average of over 30 years, and (iii) The 20 largest liners sail span all over the world, of which, more than 50% of these is operated by just the 4 biggest liners (source: UNCTAD). Given this, they can serve demand for sea freights in a wide range of routes.
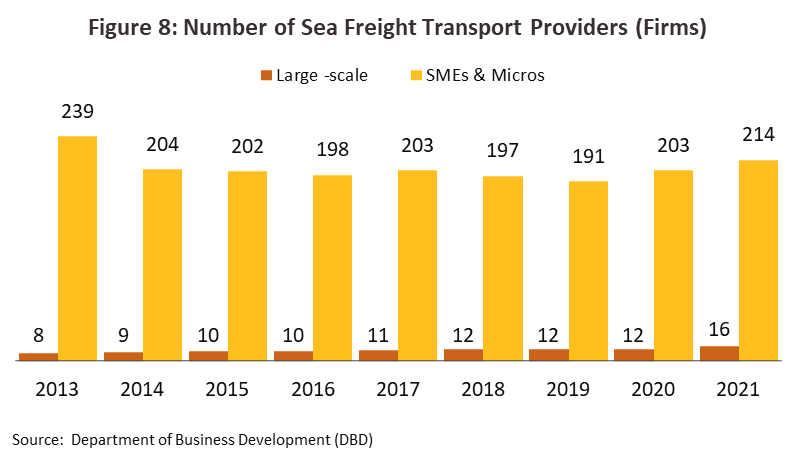
As of 2021, 230 companies (Thai or Thai-overseas joint ventures registered with the Ministry of Commerce) offered coastal or open water freight services (Figure 8). These can be classified into the following two groups.
-
16 companies (6% of the total) qualify as large operations, and most of these are VOCCs. Shippers of liquid cargos include Siam Lucky Marine, Ama Marine, VL Enterprise, and Nathalin Group, Regional Container Lines moves containerized goods, while Thoresen Thai Agencies and other companies in the same group (e.g., Thoresen Shipping (Thailand)) and Precious Venus (part of the Precious Shipping Group) offer bulk cargo services. Joint ventures involving Thai companies include Singha Tankers (Singapore) and Shipco Transport Thailand (Denmark). Within this group, Nathalin and Singha Tankers, and Ama Marine and Top Nautical Star collaborate or have negotiated business partnerships with one another.
-
214 companies are SMEs and micro operations (94% of the total). This group includes VOCCs moving liquid goods along the shoreline, bulk dry goods and containerized goods, and freight forwarders. Some of these are in fact subsidiaries of companies that expanded their commercial networks and then hived off these subsidiaries as regional offices. The group also includes joint ventures with overseas operators based in countries that are on the routes of these companies, and subsidiaries of major producers of raw materials. Import players in this category include Precious Shipping, Biogreen Energy Tech Group, Leo Global Logistics, and Thai Oil.
Situation
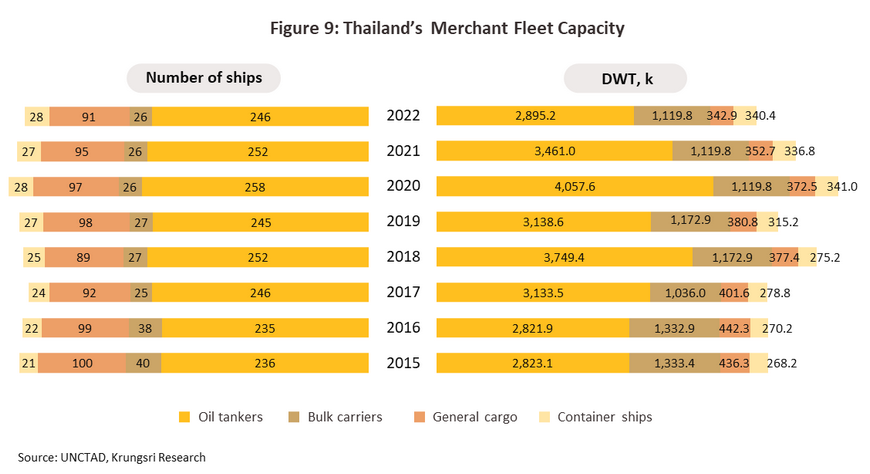
Data from the UNCTAD Maritime Profile indicate that over the 5 years prior to the outbreak of COVID-19 (2015-2019), the number of vessels in the Thai merchant fleet grew by an average of 0.8% annually, increasing by 2.0% for oil tankers and 6.2% for container ships. However, by tonnage the increase averaged 3.5% per year (7.4% for oil tankers and 3.6% for container ships) (Figure 9), thus moving roughly in line with the 3.0% annual expansion in Thailand’s overseas trade that was recorded during the same period. This trend continued into 2020 as newly build ships ordered prior to the pandemic came into service but would decline in 2021 and 2022 as ports worldwide closed and a severe global shortage of containers emerged due to the overall effect of the COVID-19 crisis and the prolonged conflicts between Russia and Ukraine that resulted in higher global energy prices. In response to transformed conditions, freight rates rose precipitously across the board, and players responded by adjusting their business playbooks, principally by cutting overheads and eking out greater efficiencies (e.g., slowing orders of new ships, demolishing old aged vessels, revamping hold space to make this more attractive to the market, and shipping more goods on short routes and fewer goods on longer routes). The upshot of this was that the average number of Thai merchant fleets in 2021 and 2022 contracted by -3.3% from 2020 and fell -15.4% in terms of average tonnage.
Following the spread of COVID-19 around the world, inbound sea freight to Thailand slipped from -3.9% in 2020 due to the sluggish Thai economy. However, following the successful global rollout of vaccines (including Thailand) to begin relaxing pandemic controls, this rebounded to growth of 23.9% in 2021, moving with global demand that strengthened as companies looked to restock that had run down in the preceding period. Nevertheless, problems with congested ports and a global shortage of containers pushed up freight rates, and as such, these rose four-fold relative to their pre-pandemic levels. Having shrunk by -3.8% in 2020 (the first of such decline in 12 years), the volume of goods moved by ship worldwide thus increased by just 3.2% in 2021. For Thailand, recovering global demand provided a substantial boost to the country’s international trade (by value, exports jumped by a ten-year high rate of 19.2% YoY, while imports surged 23.9% YoY). Therefore, the volume of goods moved by inbound and outbound sea freight rose 23.2% in 2021 (compared to a contraction of -2.0% in 2020 and was substantially above the 5-year average of 5.5% maintained over 2015-2019. The top 3 products of shipment were miscellaneous goods, petroleum products, and mineral fuels products.
Expansion in the sea freight industry decelerated in 2022 on a combination of factors. (i) Growths in global trade and the world economy more broadly slowed to respectively 5.2% and 3.5%, down from 10.7% and 6.3% a year earlier (source: IMF), and naturally demand for freight services dropped with this. (ii) Despite the eased COVID-19 pandemic, it continued to disrupt supply chains and problems with portside congestion continued from 2020. (iii) The outbreak of the Russia-Ukraine war lifted the cost of energy and higher inflation worldwide, while shipping overheads (e.g., insurance) also increased. In addition, the war affected shipping routes in the Black Sea, adding to congestion in European ports. (iv) China extended its zero-COVID policy, and this affected both demand for certain goods and operations on some sea routes (e.g., some sailings had to be rerouted). UNCTAD estimates that for 2022, global sea freight volumes were up just 1.4% from their 2021 level, with growth strongest for container shippers, while Thailand's overall seaborne volume slowed to 21.2% on the following factors.
-
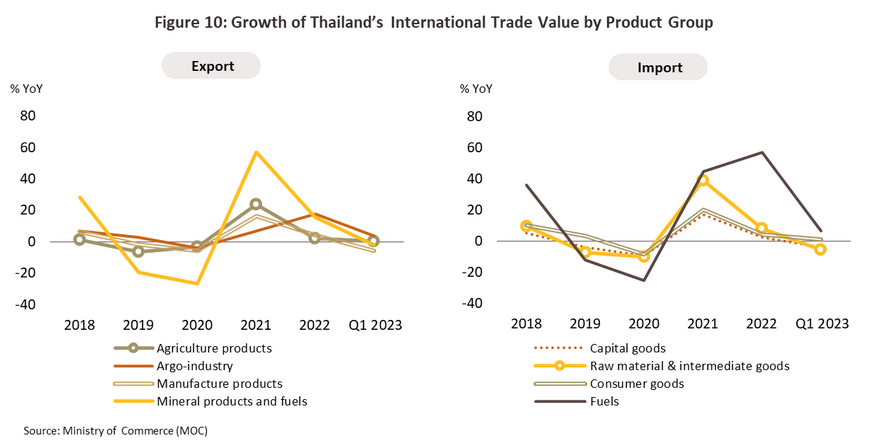
Thailand’s international trade weakened in line with the general slowdown in the global economy, though trade was also impacted by the Russia-Ukraine war, which then encouraged many countries to hold back on exports of goods including agricultural commodities and fertilizer. In 2022, Thai exports thus rose 5.5% YoY to a value of USD 290 billion (Figure 10), with growth most pronounced for agro-industry products (up 17.8% YoY) and minerals and fuels (15.5% YoY). At the same time, imports totaled USD 330 billion (up 13.6% YoY), with raw materials (8.3% YoY) and fuels (56.9% YoY) performing especially strongly.
-
By both number and tonnage, the Thai merchant fleet continued to contract in 2022, falling by respectively -1.1% and -19.2% from 2021 due partly to the following reasons: (i) operators developed vessels to comply with international standards8/, (ii) some ships were reflagged (this affected mainly those 20-years old or older, including oil tankers, general cargo ships, and reefer ships). As a result, numbers were down -2.9% for oil tankers (43.9% of the Thai merchant fleet), -2.4% for general cargo ships (10.9% of the total), and -10.0% for reefer ships (2.4%). The increase in the volume of goods moved by sea thus principally benefited overseas rather than Thai fleets.
-
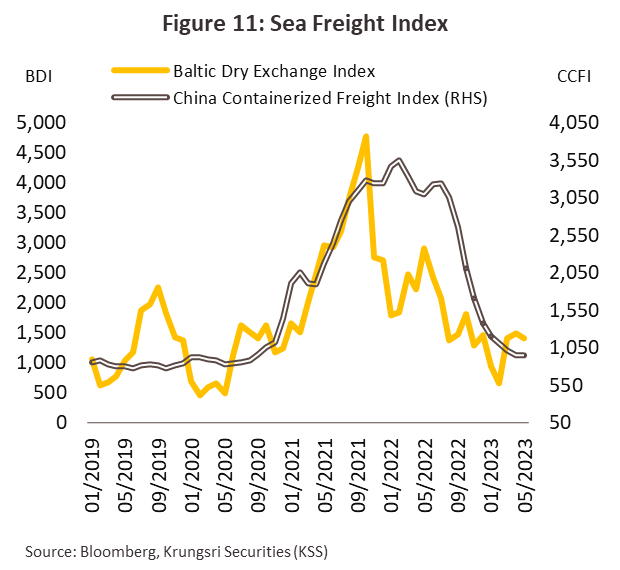
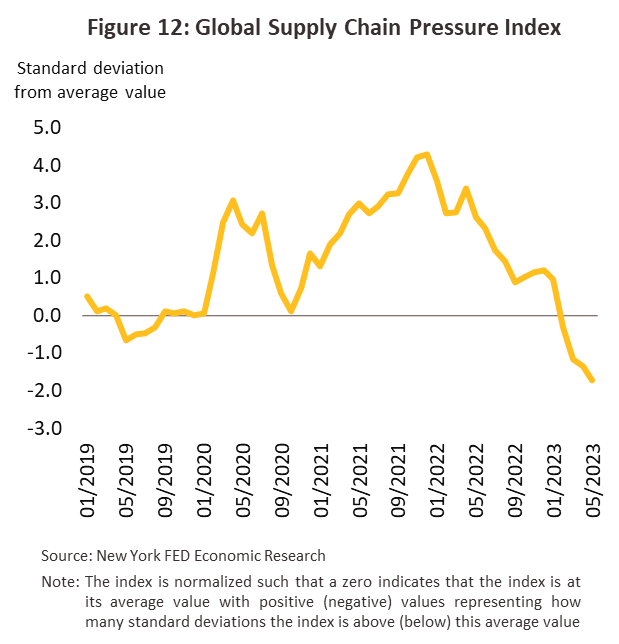
In 2022, freight rates came down substantially from the peak in 2021 despite the still-high level and the global easing of the pandemic (Figure 11). A substantial decrease was attributed to extended sailing times and blank sailing and skip calling by shippers, especially on the Asia-Europe loop and trans-pacific routes. Rates did, however, begin to soften substantially in 4Q22 as demand slowed on a weaker outlook for the global economy, the easing of port congestion (Figure 12), and the conclusion of the Black Sea Grain Initiative, which then cleared the way for an increase in exports of cereals, foodstuffs, fertilizer, and consumer goods from Ukrainian ports. The situation with freight charges in 2022 is described below.
-
Across 2022, the average value of the CCFI (which measures container freight rates) was up 9.4% YoY (down substantially from 2021’s jump of 167%). The market for container shipping was boosted by the increase in imports of processed food to some countries, which then had a positive impact on business conditions for shippers of containerized goods.
-
The BDI (which measures the cost of shipping bulk goods) slumped by an average of -33.8% in 2022 (compared to an increase of 174% a year earlier). In the first half of 2022, the BDI remained relatively flat compared to a year earlier, but the index then crashed by an average of more than -50% in the latter half of 2022 as the global slowdown fed through into weaker demand for the shipment of commodities.
Operators have responded to these turbulent market conditions with a variety of strategies, including better aligning the space and sailings with demand, tighter management of their routes (e.g., by greater blank sailing and skip call, that is, reducing the frequency of sailings and suspending services to some ports), and applying surcharges such as BAF/FAF (Bunker/ Fuel Adjustment Factor), EBS (Emergency Bunker Surcharge), WRS (War Risk Surcharge) or emergency surcharge for elevated risk arising from armed conflict and sailing through contested regions. As a result, for shippers listed on the stock exchange of Thailand (SET), 2022 income rose by 30-35% for container shippers (down from a rise of 120% in 2021), by 20-25% for bulk carriers (down from 60% in 2021). In addition, operators of liquid tankers posted income to increase by 25-30% (up from 9.7% in 2021) due to higher oil prices.
Outlook
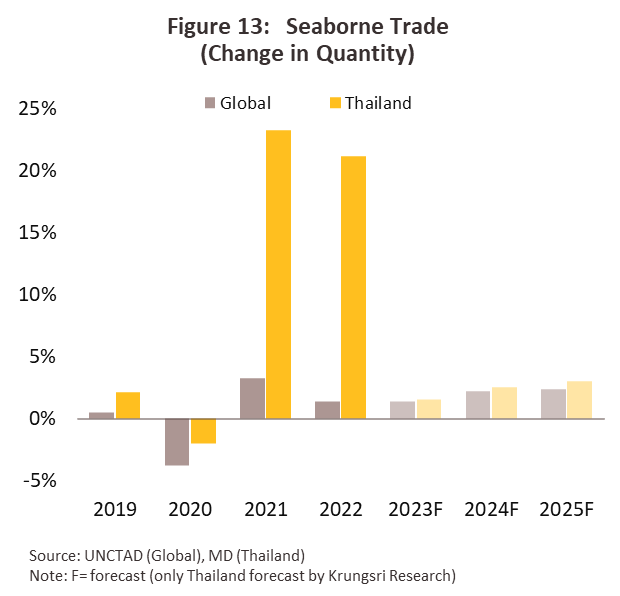
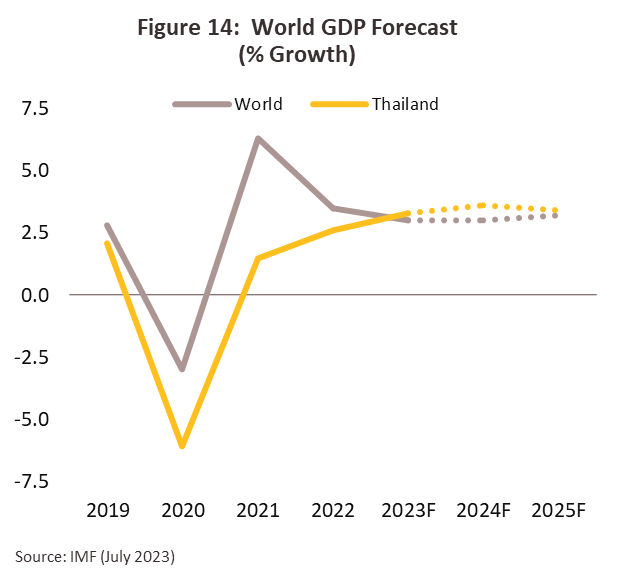
The sea freight market should see similar rates of growth in 2023 as in 2022. Although the world economy will tend to slow, the lifting of COVID-19 restrictions in China will continue to have a positive effect on demand and so consumption will expand. UNCTAD thus sees the global seaborne trade growing by 1.4% in 2023 (close to the level in 2022), with this then accelerating to 2.2% and 2.3% in 2024 and 2025 (Figure 13) in line with the world economic recovery. Likewise, Krungsri Research expects that for Thailand, the sea freight market will grow by 1.0-1.5% in 2023 and then by 2.0-3.0% in 2024 and 2025. This outlook will be supported by the following factors.
-
The world economy will slow in 2023 and will maintain its momentum in 2024 but is expected to rebound to faster growth in 2025. The IMF in July 2023 is predicting growth in the global economy slowing to 3.0% in 2023-2024, and this will then drag on demand for goods, pulling growth in world trade volume down to 2.0% in 2023 (from 5.2% in 2022), before recovering to 3.7% in 2024. However, the situation will improve in 2025, and the global economy is forecast to expand at a range of 3.0-3.5%. This will then push up growth in world trade in 2025 at a range of 3.0-4.0% per year (source: IMF, April 2023), and with this, the volume of goods moved by ship will rise.
-
The Thai economy is predicted to expand by 3.0-4.0% per year over the next three years. Through 2023, the economy will be boosted by a recovery in the tourism sector, and this will translate into stronger consumption, despite the negative impacts on Thai exports of the worsening global outlook. Exports have in fact contracted steadily since October 2022, and for all of 2023, exports and imports are expected to rise by just 0.5% and 1.0% respectively (down from growth of 5.5% and 15.3% in 2022), which will then naturally weigh on the sea freight industry. However, in 2024 and 2025, an improving situation in the country’s main export markets (especially in China and the ASEAN region) will boost Thai trade. Thailand will also benefit from its integration into global supply chains, in particular in the food, auto, and electronics industries, and its membership of a number of free trade areas, including the ASEAN Economic Community (AEC)9/ and the Regional Comprehensive Economic Partnership (RCEP, 2022). As a result, demand will strengthen and new shipping routes or trade lanes will be opened.
-
Government plans for the development of maritime infrastructure will help to integrate the national logistics network and to make the distribution of goods quicker and easier. Of particular importance will be projects connected to the Eastern Economic Corridor (EEC), including: (i) phase 3 of the Laem Chabang Port development, which will extend the port’s capacity by 7 million TEUs (to be completed in stages over 2025-2035); (ii) phase 3 of the Map Ta Phut Port development, which aims to establish the port as a center of the trade in liquid natural gas (LNG) in the ASEAN region, and which when completed (in 2026) will be able to handle an additional 16 million tonnes of petrochemical product and LNG per year; and (iii) spending on facilities to develop sea routes linking the EEC with special economic zones and industrial estates in coastal regions in the south of the country (construction is expected to run from 2023 to 2035). In addition, government efforts to promote investment (e.g., through tax breaks administered by the BOI) will also help to encourage foreign investors to establish production bases in Thailand, and because Thailand lies at the heart of the ASEAN region, the country will be an attractive possibility for companies adjusting supply chains or relocating from China.
-
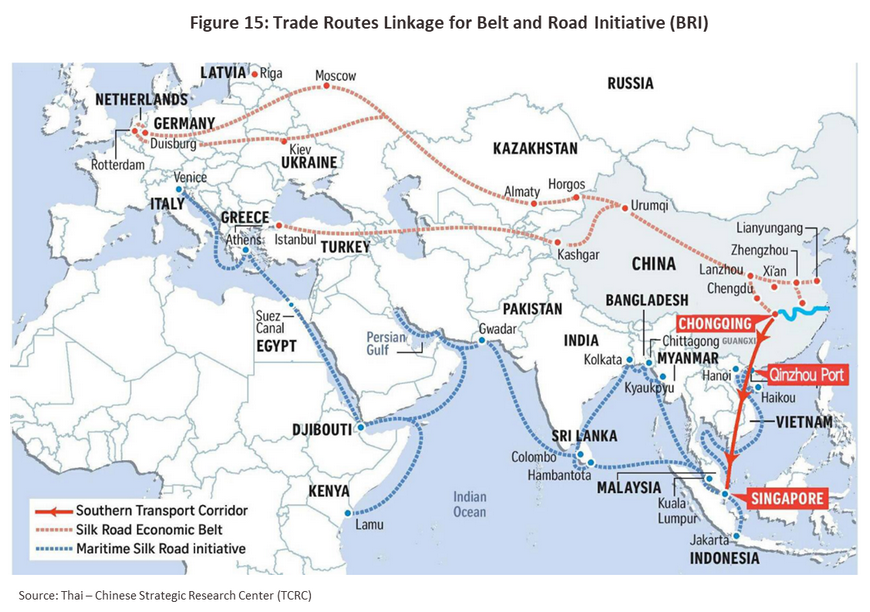
Better international connections have resulted from the development of agreements with sister ports, such as those that exist between Laem Chabang and Xiamen Port in China and Kitakyushu Port in Japan. These agreements cut port fees and charges for services such as using cranes and so help to increase the volume of goods moving between these sister ports. In addition, the extension of China’s Belt and Road Initiative and the new rail and sea transport routes that this has established has opened up new possibilities for sea lines linking Asia, Africa, and Europe (Figure 15). This will then stimulate greater demand for sea freight services and will feed an increase in the volume of goods moved from Thailand to export markets. As such, Thai sea freight operators will be in a position to grow their user base and develop new sources of income.
Although demand for sea freight will be buoyed by a number of factors, operators’ income will come under pressure from falling freight charges, which will likely slip back to their pre-COVID-19 levels due to: (i) the easing of supply chain disruptions (e.g., clearing portside congestion and greater access to containers) as COVID-19 infections lessen; (ii) only slow expansion in the global economy, which will then weigh on growth in manufacturing worldwide; and (iii) expansion in the supply of shipping capacity that will outpace demand. Clarksons Research estimates that the supply of space on bulk cargo ships will grow by 2.4% and 0.3% YoY in each of 2023 and 2024, while Hapag-Lloyd expects that a large number of new container ships with huge shipping capacity that was ordered in 2021 and 2022 will come onstream over 2023-2025. And as a result, income growth will fall behind the levels seen during the COVID-19 pandemic.
Thai players will tend to increase shipping capacity, and the Thai merchant fleet is expected to grow by 1.0-2.0% annually as operators look to meet strengthening demand, replace demolished vessels8/ and expand into new high-potential markets in the Middle East and Africa. However, at the same time, competition will stiffen, with this coming both from shippers extending the range of services that they offer and from overseas players eyeing the Thai market. This is because the trans-pacific and Asia-Europe trade lanes are the main channels for shifting goods from Asia to markets in the West and so new and existing players are expanding their offerings and competing directly against one another, and as a consequence, downward pressure on freight charges will increase. The outlook for individual segments is given below.
-
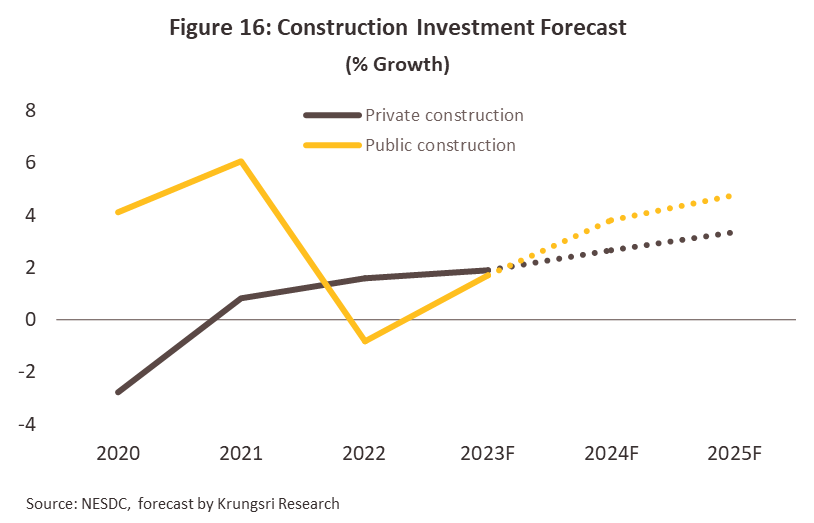
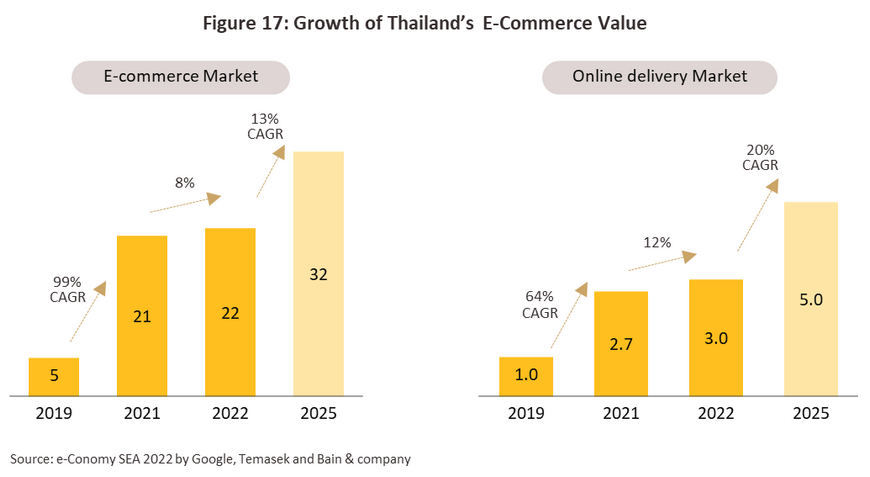
Containerized shipping: Stronger demand will be supported by an improving economic outlook and growth in the construction (Figure 16) and e-commerce industries (e-Conomy SEA2022 estimates that over 2022-2025, the Thai markets for e-commerce and online delivery will enjoy an average growth of respectively 13% and 20%) (Figure 17). This will then boost demand for consumer, industrial, and agricultural and agro-industrial goods (e.g., processed and chilled and frozen foods), tools and machinery, and other miscellaneous products.
-
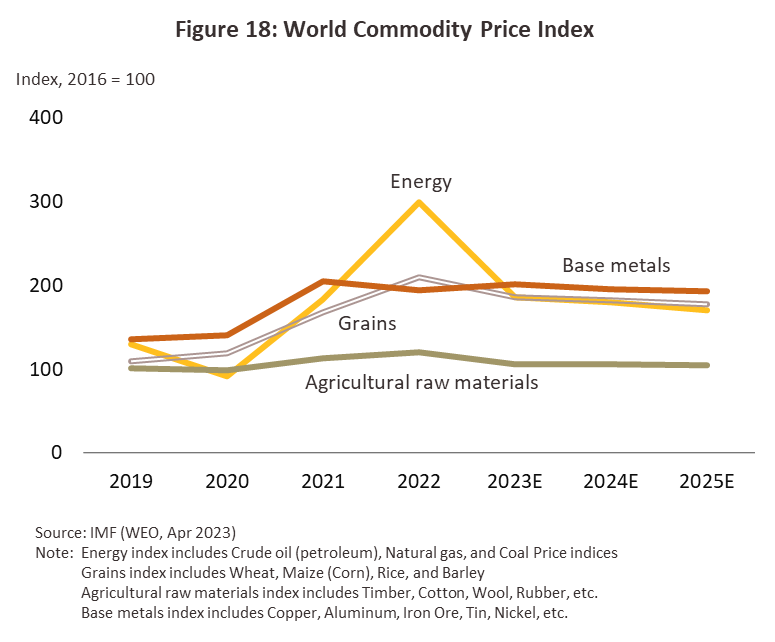
Bulk cargo: Conditions will slowly improve as demand for commodities, construction materials, metals, minerals and ores all strengthen. (i) For many items, the global Commodity Price Index is likely to remain elevated relative to the pre-COVID-19 period (Figure 18). (ii) The Chinese government is trying to stimulate the economy by investing in infrastructure and supporting work on real estate projects, which will add to demand for some commodities (e.g., steel and cement). (iii) Demand for food and agricultural goods (e.g., sugar, rice, cassava products, etc.) will intensify as El Niño-induced drought and water shortages worsen. This is expected to last into 2024, cutting outputs and adding to demand for food and agricultural goods to stockpile against future shortages.
-
Tankers (petroleum products, chemicals, and gas): Growth in demand for tanker services will be supported by greater consumption of oil and gas products by the transport and industrial sectors. Krungsri Research forecasts that in 2023 and 2024, domestic demand for refinery products will return to its 2019 level of 0.84-0.85 million barrels per day, up from 2022’s 0.80 million barrels. Similarly, in 2023, demand for liquified natural gas (LNG) will come to 5-6 million tonnes, compared to just 3.3 million tonnes in 2022. Growth will then continue into 2024 and 2025.
Going forward, challenges to the industry that may weigh on turnover will include the following. (i) The extended Russia-Ukraine war and cuts to OPEC production quotas will tighten the supply of oil to world markets, pushing up prices for crude, reducing demand for shipping services, reschedule of sailing routes and adding to overheads. (ii) Competition from overseas shippers will likely intensify as they expand deeper into markets in the Asian region. Because these players occupy a significant share of the market and so negotiate from a position of strength, they will be able to control allocation spaces. Thai operators will thus need to rapidly adjust their operations by, for example, partnering with other companies to cut their costs and increase the efficiency of their management systems. (iii) Costs will rise with the need to meet international maritime standards10/, in particular those that have a bearing on fuel efficiency and the use of new transport technologies. Players will also need to bring their ships up to ‘zero-emission vessel’ standards as required by IMO 2020. This will include cutting greenhouse gas emissions by 5% by 2030 (from 2008) and by 50% by 2050. (iv) Delays in work on government-backed maritime infrastructure will affect expansion in the industry, with many projects still undergoing feasibility studies. These include the proposed land bridge to connect the Gulf of Thailand and the Andaman Sea (currently authorities are looking for a suitable site for the development of a deepwater port) and phase 3 of the Map Ta Phut port, construction of which should begin in 2024, with the site scheduled to begin commercial operations in 2026 or 2027.
1/ Source: Office of Transport and Traffic Policy and Planning (OTP), Ministry of Transport (2013)
2/ United Nations Conference on Trade and Development (UNCTAD)
3/ Not include fisheries products from fishing boats, ships carrying aircraft, arms and armaments, and coastguards and rescue vessels
4/ Dry cargoes include bulk cargo such as grains, coal or iron ore. General cargoes, such as raw materials, semi-finished goods or finished goods, machinery, breakbulk cargo, and refrigerated goods.
5/ Goods may be carried as a ‘full container load’ (FCL) or as a ‘less than a full container load’ (LCL).
6/ As of 2022. Data supplied by the Office of Maritime Promotion, which operates within the Marine Department.
7/ Construction of the canal system linking the Pacific and Indian oceans in the south of Thailand: Annex E of the Development of the National Logistics System, published in 2015 by the Secretariat of the House of Representatives.
8/ As of 1 January 2023, the International Maritime Organization (IMO) has enforced amendments to the International Convention for the Prevention of Pollution from Ships (MARPOL) that tighten earlier regulations. These include the Energy Efficiency Existing Ships Index (EEXI) and the Carbon Intensity Indicator (CII), which aim to reduce emissions of greenhouse gases and to ensure the use of low-sulfur fuels. The regulations are enforced according to a vessel’s engine capacity, tonnage, and speed, and in addition to affecting operations, these new rules will also hasten the scrapping of vessels that have been in service for more than 25 years.
9/ Thai laws permit AEC member (mode 3) to own either 49% or 70% of issued shares in logistics companies. For sea passenger services, ownership is limited to 49%, but for ocean sea freight services offering temperature-controlled environments, this rises to 70%. Likewise, customs agents and maritime agencies may only be 49% foreign owned, but for freight forwarders operating out of private ports this rises to 70%.
10/ IMO 2020 requires that all ocean-going vessels comply with a range of rules that aim to cut emissions. Vessels are therefore now required to: (i) use low-sulfur fuels, which are more expensive than the high-sulfur alternatives, or (ii) install scrubbers to clean exhaust fumes; (iii) use dry docks for repairs and maintenance; and (iv) transition to the use of batteries or alternative fuels such as ammonia, hydrogen, methanol, or biofuels, thus resulting in rising demand for a new generation of clean-energy vessels. Alternatively, vessels may cut emissions by reducing their operating speeds, while older ships will increasingly be demolished, leading to a fall in the average age of the merchant fleet. The most recent changes to the IMO MARPOL regulations have been in effect since 1 January 2023 (as referenced in footnote 8/)


.webp.aspx)