From 2020 to 2022, the Thai petrochemical industry is expected to continue to grow, supported by pro-industry government policies and an anticipated increase in demand for petrochemical products from downstream industries in both domestic and export markets. In 2020, the global outbreak of COVID-19 and its subsequent impact on Thailand’s and the global economy will drag operators’ revenues. But in 2021 and 2022, the industry and revenues should recover along with anticipated solid growth in global demand. However, the industry remains exposed to several risks arising from fluctuating oil prices, rising US-China trade tension, and challenges experienced by players in adapting to a constantly changing business environment both within and without the sector, due to increasing global pressure to deal with pollution. These factors will influence operators’ revenues and profitability.
Overview
The petrochemical manufacturing business is normally a large-scale operation that employs many complicated and tightly interconnected industrial processes. It involves huge capital investment to establish a petrochemical complex, which requires the use of advanced technology, and the sites that host these complexes need to have access to a wide range of industrial-scale utilities. Given this, the payback period on investment is relatively long.
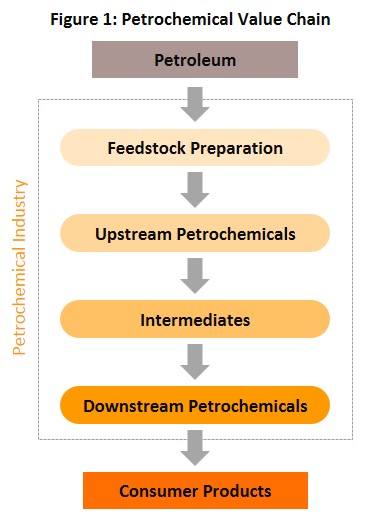
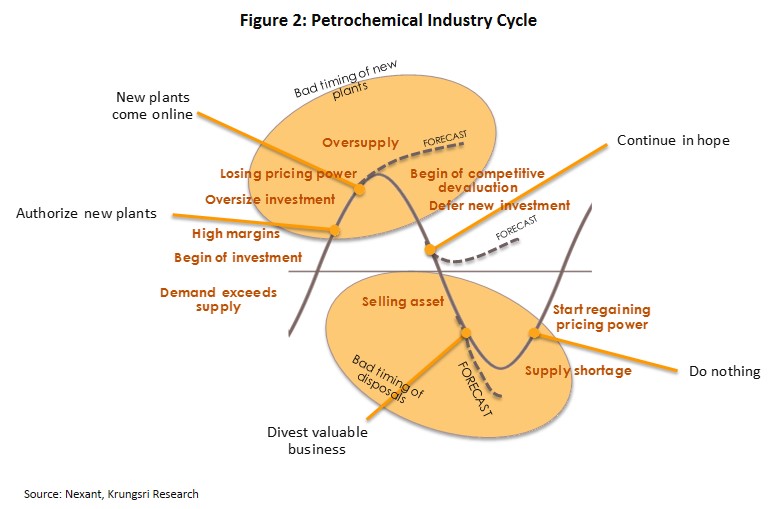
Generally, the petrochemical industry is exposed to cyclical supply-demand conditions and prices, as the desire to exploit economies of scale encourage large and intensive investment to meet anticipated future demand. Decisions to expand existing facilities or invest in new sites are usually made when prices for petrochemicals are high, and this would normally be when an expanding economy is feeding demand for these products or when there is a supply shortage. But construction of a petrochemical complex normally takes between three and seven years, and if the anticipated demand fails to materialize upon completion, there would be excess supply in the market. Global data suggest each natural cycle lasts between six and nine years, but shocks in the world economy could also affect the supply and demand sides of the equation. And recently, it has been harder to identify cyclical movements within the industry at the global scale. Investments in large global petrochemical complexes are typically made by players in the oil sector which use petroleum products as feedstock. Although, some petrochemical output can also be used as feedstock or as primary ingredients in a wide range of industrial processes. The manufacturing process for petrochemicals can be divided into four main stages:
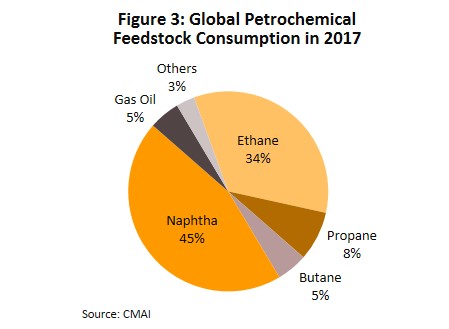
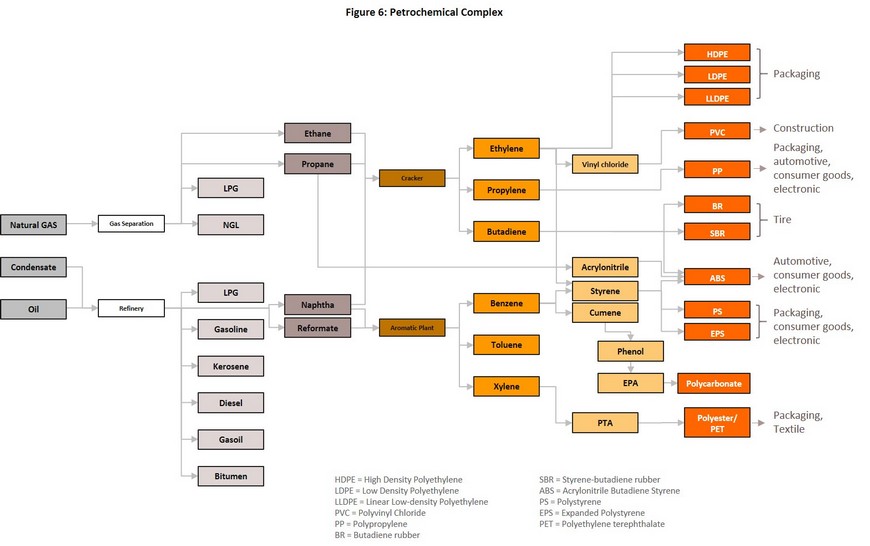
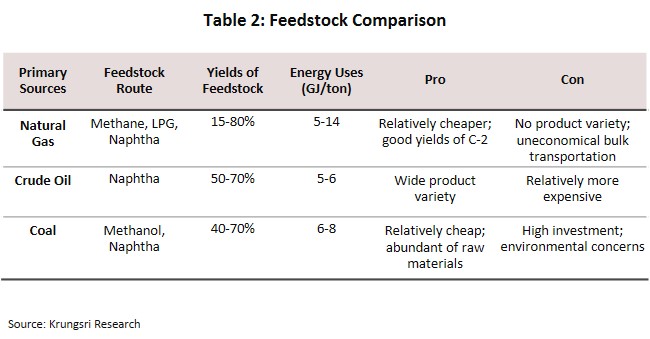
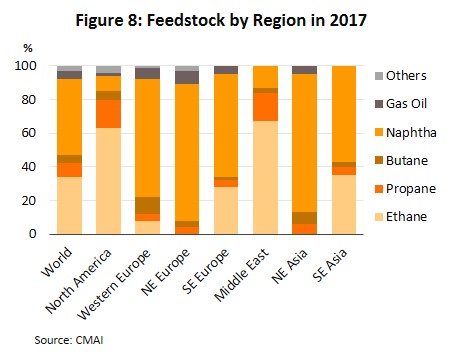
Stage 1: Manufacturers of feedstock typically use products from the petroleum sector, including natural gas, condensates (a product of gas distillation), and naphtha (from the distillation of crude oil). About half the petrochemical production capacity uses naphtha as feedstock, which is especially common in facilities in Asia and Europe. In North America and the Middle East, gas is the preferred feedstock because these areas are rich in natural gas deposits. In addition, recent technological developments are allowing organic products such as sugarcane, cassava and palm to be used as raw material in the production of bioplastics, and investment in these sectors is expected to rise in the future (Figure 3).
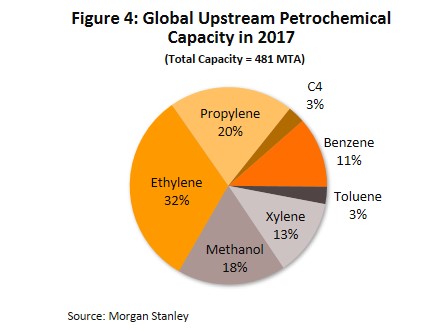
Stage 2: Upstream petrochemical industries take feedstock and use them to produce precursor or preliminary petrochemical products. These may be divided into two groups according to their molecular structure: (i) olefins, which include methane, ethylene, propylene and other chemicals that have a base structure formed from four carbon atoms (so-called ‘mixed C4’ chemicals); and (ii) aromatics, which include benzene, toluene and xylene, and are used as inputs in the manufacture of other petrochemical products.
.
Stage 3: Intermediate petrochemical industries consume upstream products, both olefins and aromatics, and process or combine them with other chemicals to produce intermediate products. Some major products in this industry are vinyl chloride and styrene. These are sold to downstream industries.
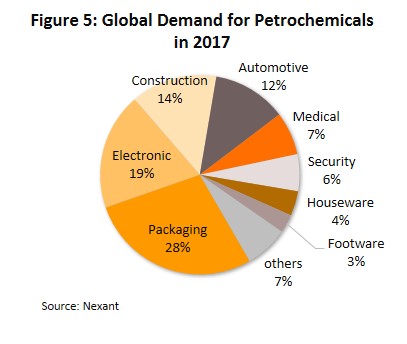
Stage 4: Downstream petrochemical industries take upstream and intermediate goods and use these to make finished products for use in related sectors (Figure 5). Products consumed by the downstream petrochemical industry can be sub-divided into four groups:
- Plastic resin is the most commonly-used product in downstream industries, including packaging, automotive manufacturing, construction material, and consumer goods. The most important plastic resins are polyethylene, polypropylene, polyvinyl chloride (PVC), acrylonitrile butadiene styrene (ABS), polyethylene terephthalate (PET), and polystyrene (PS).
- Synthetic fibers, for example polyester and polyamide or nylon fiber, are mostly consumed by the textiles and packaging sectors.
- Synthetic rubber/elastomers are used in the manufacture of automotive parts, tires, and consumer goods. Examples include styrene butadiene (SBR) and butadiene (BR)
- Synthetic coatings and adhesive materials, which include polycarbonate and polyvinyl acetate, are used in construction and several other industries
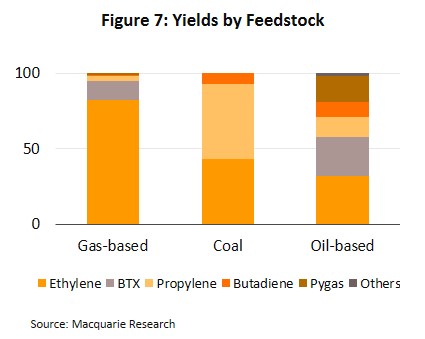
The choice of feedstock for a particular production process is made by the individual operator but it is strongly influenced by the desired output because each feedstock has a different hydrocarbon composition and will produce different petrochemical outputs. For example, using natural gas to produce ethylene yields about 80% ethylene and 20% other products, whereas using naphtha yields only 30% ethylene and 70% other products (Figure 7).
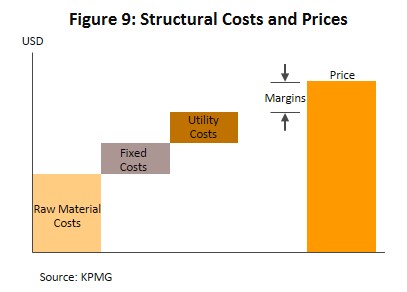
The major cost item in the sector is feedstock which comprises 60-70% of the total production cost. Power and transportation account for another 15-20%, and the remaining 15-20% is attributable to fixed costs. Hence, productions cost is largely dependent on prices of oil and related products, making this a cost-based industry and producers who are able to keep these under control will have a competitive advantage. More specifically, production overheads, or cash cost, will depend on the type of feedstock used, the production technology employed, and access to feedstock. Therefore, feedstock management is also an important factor in determining costs, and locating production facilities on sites with easy access to raw material and to markets will reduce transportation overheads and improve competitive advantage.
The ability to manage complex investments is another important factor in determining business success. It would allow manufacturers to better manage costs, to reduce exposure to risks arising from fluctuations in product prices, and to plan production more effectively. Product flexibility also permits manufacturers to quickly adjust production to meet changing demand, while large-scale operations allow manufacturers to benefit from economies of scale and reduce the marginal cost of production.
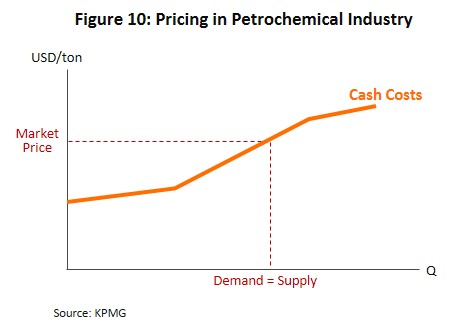
The petrochemical market is extensive and globally interconnected. Hence, prices are normally based on a combination of production costs and supply-demand dynamics on global exchanges. Global prices are largely determined by ‘laggard-driven pricing’. This means the market price is set by the cost of producing the last unit consumed, and so when the cost of the feedstock used in producing that last unit changes, this will have a direct effect on prices of output. Research show prices of upstream and downstream petrochemical products have a 70–85% and 40-70% correlation, respectively, with the cost of feedstock.
The ‘spread’ of a particular petrochemical product refers to the difference between the product price and the cost of raw material; this represents the gross profit margin for each product. However, most downstream petrochemical industries have a product chain stretching from upstream products through intermediate to downstream outputs, so when calculating profit, we must consider spreads for all the products in the supply chain.
Profitability is normally reflected by gross integrated margin (GIM). This is the difference between the total value of petrochemical products less total cost of production. Hence, the GIM depends on the spreads of all the products manufactured, which could rise or fall according to an operator’s cash cost and capacity utilization. However, product mix will vary for different production sites and for different operators, which makes is complicated to assess competitiveness by simply comparing GIM. This has prompted the use of cash cost as the preferred metric for assessing competitiveness, specifically cash cost for ethylene because it is the world’s most commonly produced upstream product at 32% of total global petrochemical output, and is used as feedstock in a wide variety of processes.
The global petrochemical sector
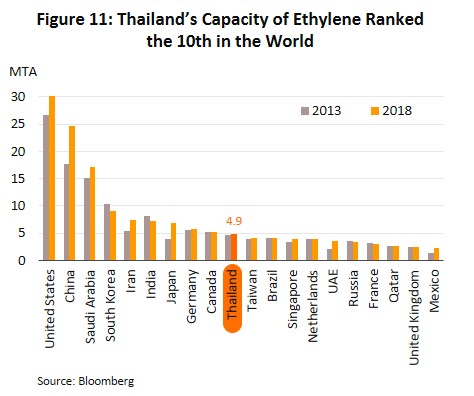
An assessment by the Information Handling Service (IHS) show that in 2017, the global petrochemical sector had a market value of around USD700bn, and that is expected to grow and exceed USD1trn within five years. China was both the biggest producer and consumer of petrochemicals in 2017 at 29% of global output and 28% of consumption. The United States was the world’s single largest source of ethylene, hosting 18.6% of global production capacity (Figure 11).
Worldwide, petrochemical products are used in packaging (28% of output), electronics (19%), construction (14%), automobiles (12%), and a range of other related sectors (27%). Demand for petrochemical products typically grow 1-2 times faster than the general rate of growth in the economy.
Thai petrochemical sector
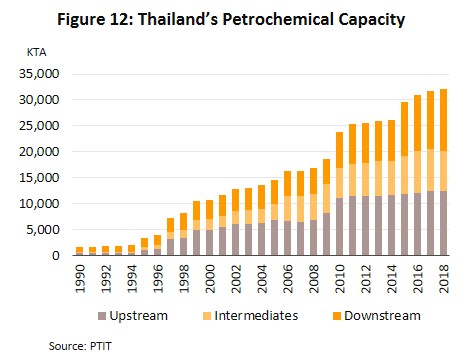
In 2018, the Thai petrochemical sector had a total production capacity of 32 million tons, the largest in the ASEAN region and 16th largest in the world.
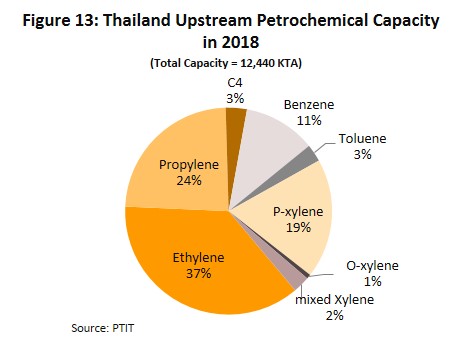
- In that year, they produced 12.4 million tons of upstream products, 7.7 million tons of intermediate goods, and 11.8 million tons of downstream outputs
- Naphtha is the main feedstock (68% of total feedstock consumption), while 69% of production capacity is for olefins.
- Over 80% of Thai upstream and intermediate production is for domestic use as inputs for further downstream processes. And, 45% of the downstream output is consumed within Thailand. The primary consumers of downstream products in Thailand are packaging sector (38% of the total), textile (18%), automobile (12%), electronics (11%), and others (21%). The remaining 55% goes to the export markets (largely in the form of plastic pellets or nurdles), the most important of which are China (31%), Japan (10%), Indonesia (10%), Vietnam (9%) and India (8%).
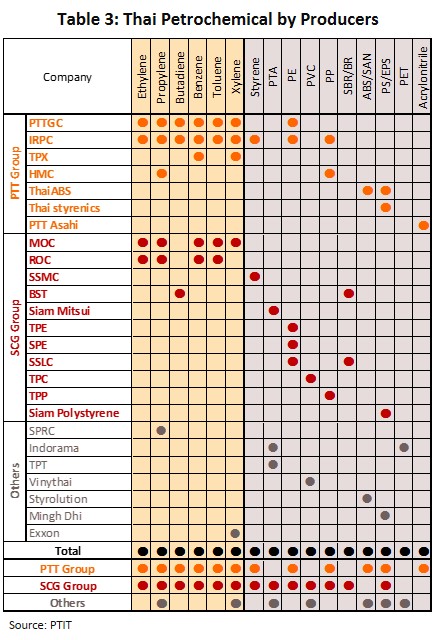
There are two major players in the domestic petrochemical sector: PTT with 54% market share, and SCG with 29% share. These two have been competing to gain competitive advantages in manufacturing and marketing by continually investing in related businesses in Thailand and overseas. PTT is linked to upstream industries, including oil drilling, natural gas production, oil refining, and the production of a wide variety of petrochemical products. The SCG group has stakes in companies that consume petrochemical inputs, such as manufacturers of consumer goods and building materials. The smaller players are also active in the sector but tend to focus on the production of intermediate and downstream goods. They include Thai companies, for example Vinythai, and international operators or joint-ventures with foreign companies such as Indorama, Exxon, and MingDih.
However, Thailand has limited natural gas reserve, which is expected to be depleted in the near future. This has prompted changes in the domestic petrochemical sector, including:
- Increasingly switching to using naphtha, a crude oil product, as replacement feedstock. This will lead to a change in the upstream product mix.
- Developing a greater range of new downstream products, especially higher value-added goods, and at the same time, moving away from price competition. These are in line with the third phase of the development plan for the sector for 2004-2018.
- Expanding production facilities in countries with access to raw material and a sufficiently large domestic market, including Indonesia, China and America. An example is PTT Global Chemical’s investment to construct a petrochemical complex in the United States to exploit the supply of cheap shale gas in the region.
Situation
In 2019, the global economy registered the slowest growth in a decade, at +2.9% vs +3.6% in 2018. This was attributed to the US-China trade conflict which had dragged world trade. That subsequently affected downstream petrochemical industries and demand growth for petrochemical products slipped from +4.3% in 2018 to +3.1% a year later (based on Krungsri Research estimates).
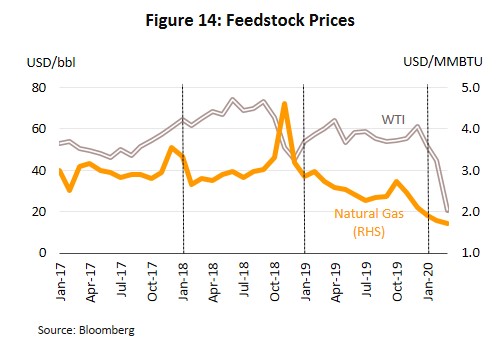
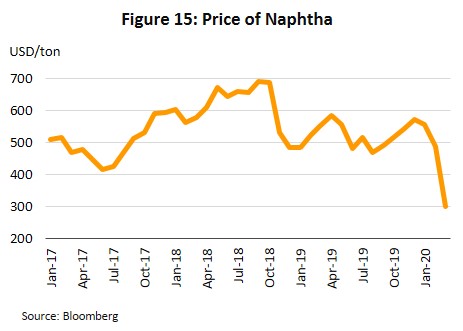
Price of crude oil (one of the primary inputs to the industry) weakened in 2019 due to a combination of rising supply especially from non-OPEC producers, and softer demand. WTI price fell by 12.2% to average USD57.0/bbl in 2019. This pushed down the price of naphtha, which is derived from crude oil, by 14.8% to average USD525/ton in the year. Likewise, price natural gas fell by 19.4% to an average of USD2.5 per million BTU (MMBTU), (Figures 14 and 15), but because the drop is larger than for naphtha, producers which use gas as primary input enjoyed a cost advantage.
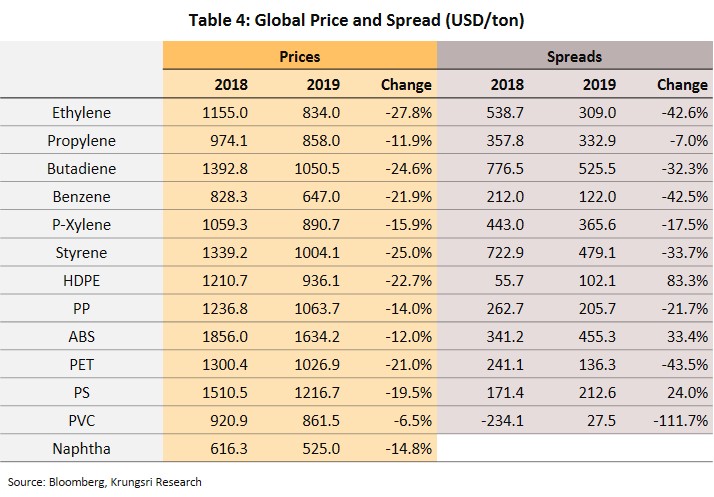
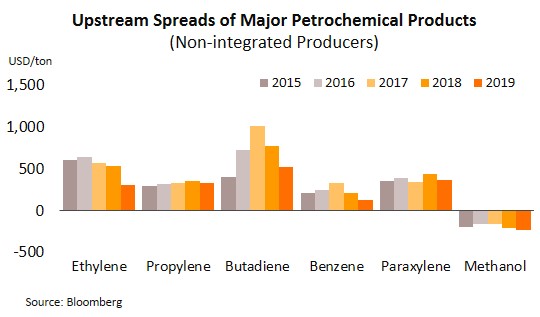
World prices and spreads weakened for all major petrochemical products in 2019 (Figure 16). This is because although lower oil prices caused inputs to be cheaper, weaker global demand and a slowdown in output from downstream industries had pressured spreads. In addition, the market was hurt by China’s move to ban the import of recycled plastics.
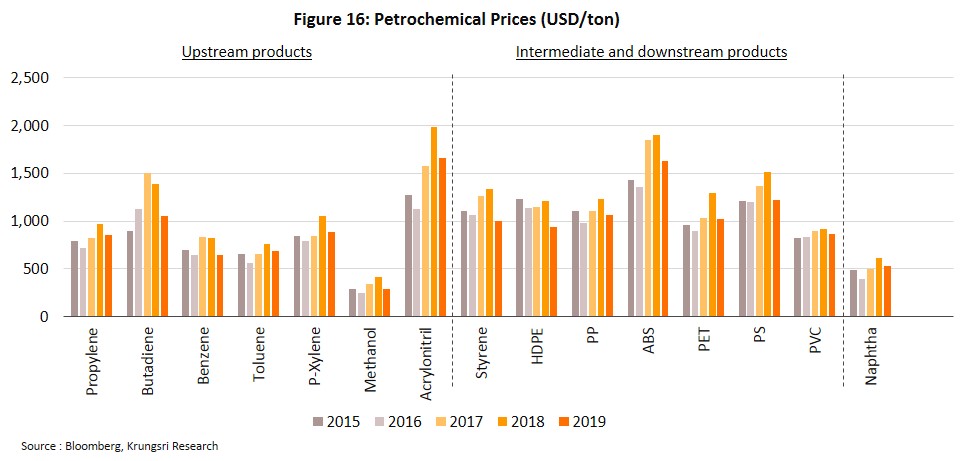
Upstream products:
Olefins
- Ethylene: Spreads shrank by 42.6% from 2018 level to USD309/ton as manufacturers of downstream products had cut back ethylene-based capacity, especially in the Middle East, which caused oversupply of ethylene in the market. At the same time, production capacity had expanded in Asia. These pressured prices significantly.
- Propylene: Spreads fell by 7% to USD332.9/ton in 2019. The expansion of production capacity in China and the Middle East boosted the supply of propylene, though this was partly offset by higher demand from the auto sector and the fact that some large propylene producers in Asia had shut production lines for repairs in the second half of the year. Hence, supply pressure had eased and overall, spreads tightened only slightly
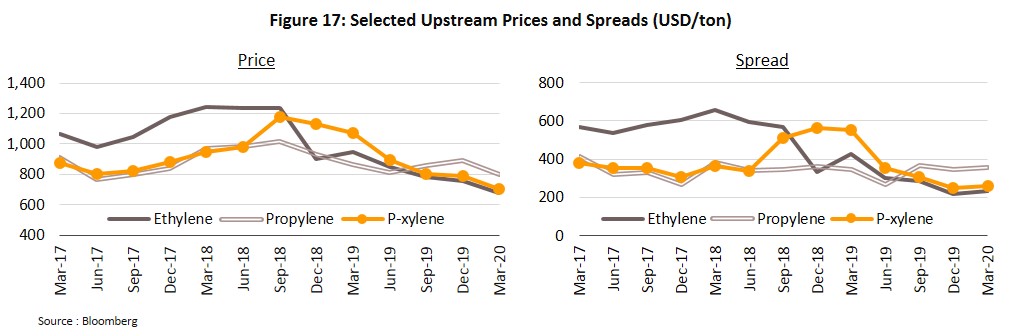
Aromatics
- Para-xylene (PX): Spreads tightened to USD365.6/ton (down 17.5%) as China, already the world’s biggest producer of para-xylene, added 10 million tons of production capacity between March 2019 and March 2020. This was undertaken as part of China’s base chemical self-sufficiency plan, which aims to reduce imports of chemicals, but that effectively reduced para-xylene prices by 15.9% from 2018 level. However, some high-cost production centers were also shut in the year, which helped to ease the oversupply situation. Meanwhile, there was still strong demand from textile and fabric manufacturers, producers of terephthalic acid, and bottle manufacturers, which limited the drop in spreads.
- Benzene: Spreads collapsed to USD122/ton (down 42.5%) following the sharp rise in the supply of para-xylene, the production of which generates benzene as a byproduct.
Downstream products:
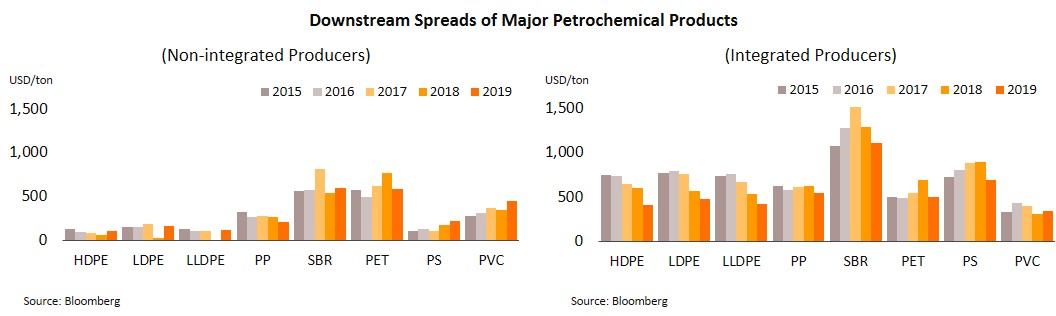
- High density polyethylene (HDPE): Spreads widened by 83.3% to USD102.1/ton driven by greater demand for polyethylene (PE) products from industries that manufacture packaging, consumer goods, construction materials and automobiles, while the cost of ethylene (feedstock) also fell
- Polystyrene (PS): Spreads increased by 24.1% to USD212.6/ton. Styrene is produced from benzene and so prices for the former tend to move with the latter, while supply also rose large facilities in Indonesia and resumed production in 4Q19. In addition, demand for downstream goods had surged, especially in China and India.
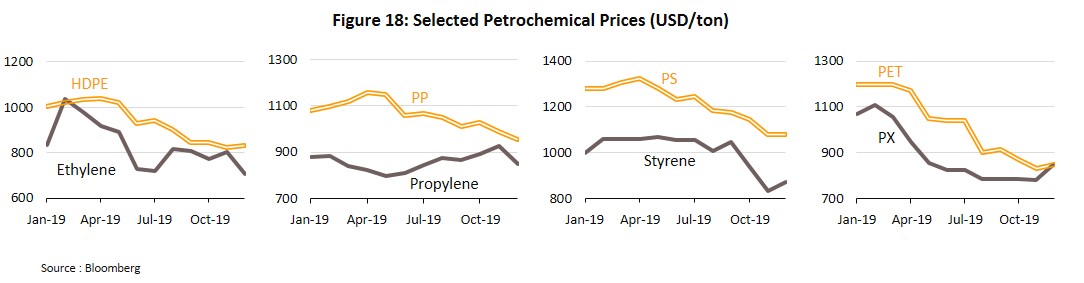
- Polypropylene (PP): Spreads shrank to USD205.7/ton (down 21.7%) following an increase in production capacity in China, Malaysia and Vietnam, and weaker demand caused by: (i) the move in many countries to cut consumption of single-use plastics, almost 50% of which is used in packaging (e.g. plastic bottles and bags) that is produced from PE, PP and PET nurdles; and (ii) slowing output in downstream industries, especially in the Chinese auto sector.
- Polyethylene terephthalate (PET): Spreads fell by almost half (down 43.5% to USD136.3/ton) as a significant volume of new production capacity had come online, while demand was affected by the same forces that had weakened the market for polypropylene.
The Thai petrochemical market was under pressure in 2019 due to slowing economies in export markets, and domestic growth had dropped to +2.4% from +4.1% in 2018. The latter limited the growth in domestic demand for petrochemical products to just +0.7% from +3.1%.
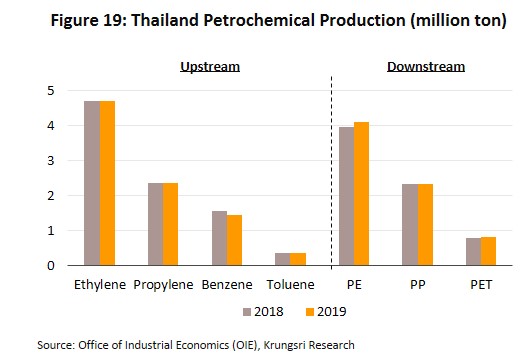
- Petrochemical output rose by 0.7% to 16.2 million tons as production of downstream products increased. Output of PE and PET increased by 3.8% and 5.4%, respectively, largely for use in packaging and plastics industries (Figure 19).
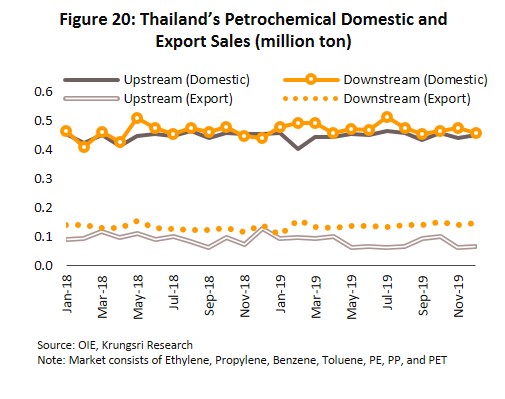
- Sector output increased by 1.9% to 11.0 million tons last year. Consumption of upstream goods was flat at 5.3 million tons, but output of downstream products rose to 5.7 million tons (up 3.8%) led by greater demand for petrochemicals to produce consumer goods (especially plastics and packaging) and construction materials, and in agriculture. However, weak global demand and the expansion in Chinese production capacity (China is Thailand’s major export market) reduced exports by 4.1% to 2.6 million tons. However, exports of downstream goods had risen to some ASEAN destinations which benefited from the expansion in Chinese-owned production facilities. Thus, exports of upstream goods shrank by 16.0% to 0.96 million tons, while exports of downstream products increased by 4.5% to 1.64 million tons (Figure 20). And prices of many products had weakened in the year in line with movements on global exchanges. Hence, the total value of exports dropped to USD11.9 bn (down 14.2%).
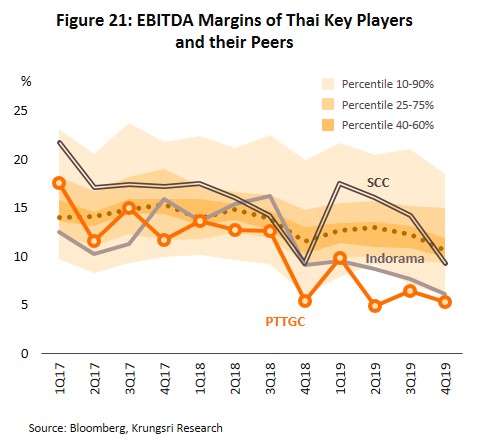
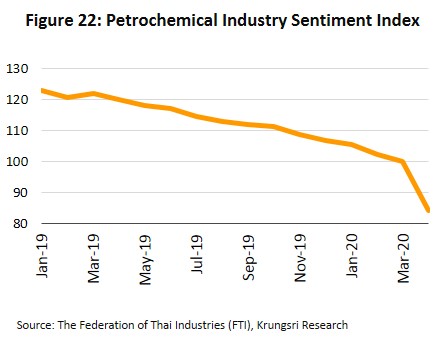
- Profitability of the major players in the petrochemical sector worsened throughout 2019 as prices fell and demand softened. This also weakened investor sentiment in the sector (Figures 21 and 22).
In 1Q20, the Thai economy shrank for the first time in 24 quarters. Like other countries around the world, the COVID-19 pandemic had forced Thailand to temporarily lock down the country. Many economic activities were stalled, though industrial activities that relied on inputs from China were hit especially hard. The shutdown dramatically reduced demand for Thai petrochemicals from both domestic and international buyers, especially those in China where many factories were temporarily shuttered. This had placed significant pressure on the market, forcing prices of HDPE and styrene to 11-year lows of USD815.3 and USD815.7 per ton, respectively, and naturally, the value of exports also fell by 18.4% YoY to USD2.5bn. At the same time, prices for upstream goods (e.g. naphtha) fell with lower crude oil prices (WTI price averaged USD38.9/bbl in 1Q20 vs USD56.8/bbl in 4Q19), which widened spreads compared to the previous quarter.
Outlook
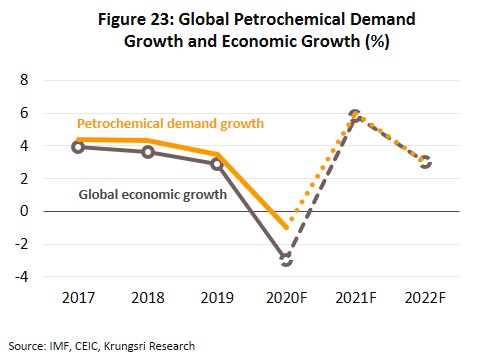
For the first time since the global financial crisis in 2009, the IMF forecasts a global recession this year as a result of the COVID-19 pandemic and the subsequent impact on economies worldwide (especially in the first half of the year). The IMF predicts global GDP would shrink by 3.0% this year. Krungsri Research projects global demand for petrochemicals would drop by up to 2% in 2020. But the IMF forecasts global growth would recover to +5.8% in 2021 and +3.0% in 2022. Krungsri Research projects that would support demand for petrochemicals to grow by 3.5-4.5% in those years (Figure 23).
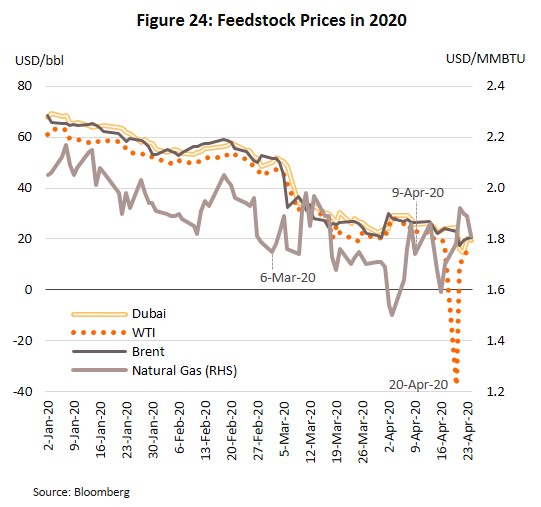
Global prices of crude oil (used to produce upstream goods) would likely remain low the rest of 2020 due to the supply glut and sharp drop in demand because of stalled economic activity (Figure 24). The EIA forecasts WTI would average USD30.1/bbl in 2020, down from USD57.0 in 2019, and rise to USD43.3 in 2021 and USD50.0 in 2022. Price of natural gas would also be depressed and is expected to average USD2.2/MMBTU in 2020, and inch up to USD2.7 and USD2.5 in each of the following two years.
Low crude prices should keep production cost of naphtha low, although pressure arising from the supply glut will ease as recovering demand for gasoline would encouraging refineries to switch to producing the latter instead of naphtha.
Krungsri Research projects naphtha price would average USD365.8/ton this year, and rise to USD440.6 in 2021 and USD 482.1 in 2022 (they would still be below USD525 average in 2019), with concomitant consequences for costs, prices and spreads for manufacturers of intermediate and downstream products.
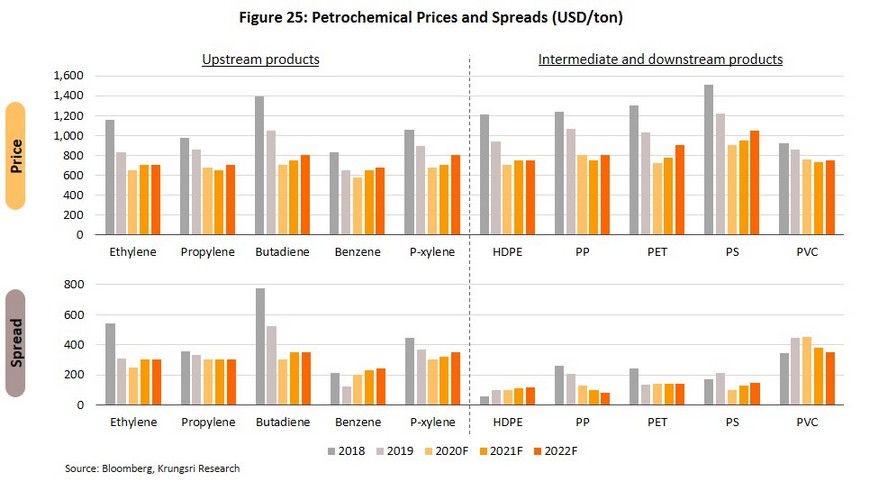
World prices for petrochemical goods are likely to continue to fall throughout 2020 (Figure 25) along with a shrinking global economy and demand for petrochemicals, which were especially visible in the first half of the year. Demand will fall for downstream consumer goods, intermediate goods that are used in other manufacturing industries, and upstream chemicals and inputs used in the sector (such as naphtha and condensates). But, low crude prices would reduce cost of upstream inputs, which would limit the drop in spreads of petrochemicals that are derived from crude oil.
In 2021 and 2022, prices should recover along with rising demand for plastic pellets for industrial consumers (e.g. durables, consumer goods, electrical appliances, autos and construction supplies). But the supply of some goods would also rise substantially, including olefin HDPE because of anticipated growth in exports from the US, and aromatic PX given rising investment by refiners in the Middle East (e.g. Saudi Arabia) as countries in the region look to diversify their economies and reduce dependence on oil exports. In addition, in a move to cut imports of chemicals, China had opened a new facility last year for the commercial production of PX which added 0.9 million tons annually to global output. This larger supply would cap price increases and pressure spreads.
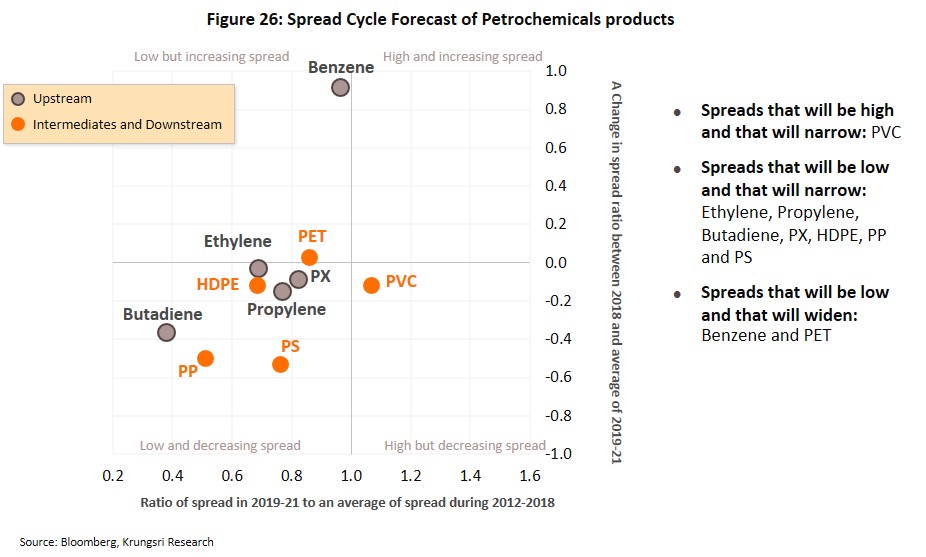
Krungsri Research’s projections for spreads over 2020-2022 is shown in Figure 26.

Outlook for major petrochemical products in 2020-2022
Ethylene
Ethylene (an olefin) is the world’s most widely-produced petrochemical, accounting for a quarter of total global upstream production. Total annual production capacity is 160 million tons, mostly in East Asia (24%), North America (22%) and the Middle East (19%). 60% of output is used as feedstock in the production of polyethylene, which is then used to produce packaging. Ethylene is also used to produce ethylene oxide, ethylene dichloride and ethyl-benzene, which are also also used in packaging and the auto industry.
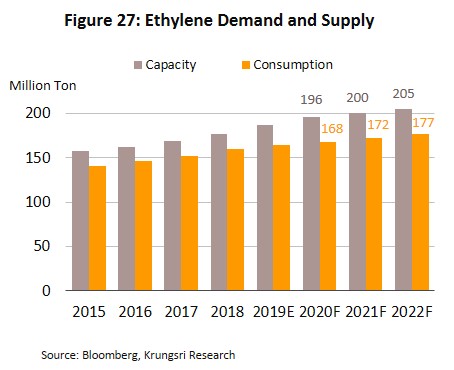
Over the next 3 years, production capacity is forecast to grow by 3.2% annually. Most of the new capacity will be in Asia, especially China which is pursuing a policy to reduce imports of chemicals. Under the base chemical self-sufficiency program, China plans to construct 38 new ethylene plants by 2030. The United States also hopes to increase exports of polyethylene to Asia. However, with ethylene demand projected to grow by only 2.5% annually, the combined factors would lead to over-supply in the market, which would prompt producers to cut prices and cap ethylene-naphtha spreads.
Polyethylene
Polyethylene is the most widely produced plastic pellet. It is made from ethylene, and 70% of output is consumed by the packaging industry.
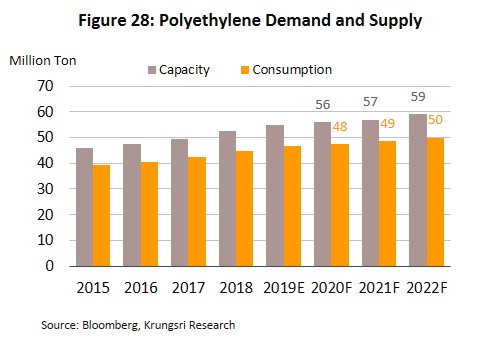
Demand for polyethylene is expected to grow by 2.3% per year, slightly slower than production capacity which is forecast to grow by an average of 2.6% annually. The resulting supply glut would keep prices low, and polyethylene-ethylene spreads would be unchanged or increase slightly.
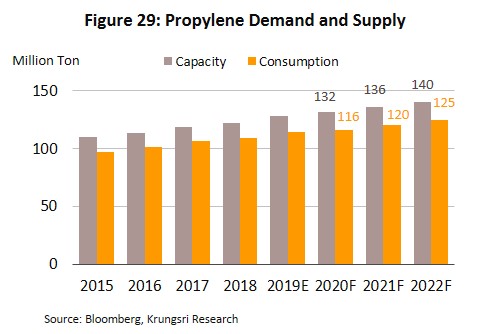
Propylene
Propylene is (after ethylene) the second most widely-manufactured petrochemical. It can be made from naphtha, LPG or coal. 65% of output is used to make polypropylene, a plastic that is mostly used in auto assembly. It is also used as an input in the production of industrial and consumer goods.
Production capacity is projected to grow by an average of 2.9% per year, mostly concentrated in China driven by the country’s import substitution program. Meanwhile, demand is forecast to grow at a slightly higher rate of 3.1%. However, propylene prices would be pressured by a supply glut and low ethylene prices (an alternative), which would cap spreads.
Benzene
This is derived from naphtha. There is 63 million tons of production capacity worldwide, which means it accounts for the largest share of aromatic petrochemical products. Around 50% of output is used as raw material in the production of ethyl-benzene, which is in turn used to produce polystyrene, and another 20% goes to the production of cumene, used in packaging, construction materials and consumer goods.
Production capacity and demand will grow at average annual rates of around 2.5% and 2%, respectively. The additional consumption is attributable manufacturers of downstream products such as PS and ABS. Like the other petrochemicals, excess production capacity will affect the market and cap benzene spreads.
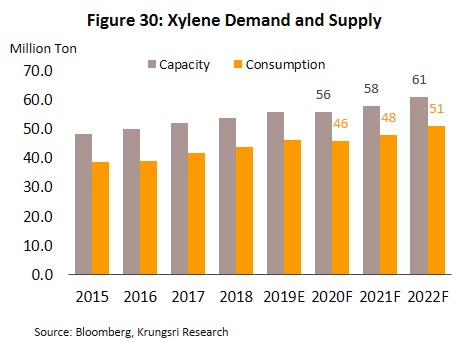
Xylene
เป็นผลิตภัณฑ์ปิโตรเคมีสายอโรมาติกส์ที่สำคัญของไทย มากกว่า 2 ใน 3 เป็นผลผลิตที่ได้จากโรงกลั่นน้ำมัน และสามารถผลิตได้จากแนฟทา ส่วนใหญ่ใช้ในการผลิต Polyester และ PET ในอุตสาหกรรมบรรจุภัณฑ์และสิ่งทอ
Demand is predicted to rise by 3.3% annually, faster than the growth in production capacity (3.0% per year). Capacity growth would be led by China, the Middle East and Thailand (IRPC has postponed its planned 2020 expansion). PX-naphtha spreads will stay flat or widen slightly.
Polystyrene: PS
This is also a downstream aromatic. Current global production capacity is 11 million tons per year. The chemical is produced from styrene monomer. Polystyrene is consumed by manufacturers of electronics, packaging and construction supplies.
Demand is projected to grow by an average of 3.0% per year, while production capacity growth would lag slightly at 2.5%. This would ease the oversupply situation in the market and support higher spreads.
The domestic market for petrochemical products is projected to weaken this year and prices would slide in-line with those set on global exchanges. Meanwhile, demand for nurdles from downstream industrial consumers (e.g. auto assembly and construction supplies) would tumble. However, this will be partly offset by low oil prices which will keep cost of inputs equally low, and stronger demand for some downstream products, including medical goods (especially face masks and cleaning products) and plastics & packaging (online sales is supporting demand for packaging). And, benzene producers will benefit from demand from large Chinese manufacturers of PX for use in the production of styrene and phenol.
Krungsri Research projects demand for petrochemical products will grow in the next two years driven by the following:
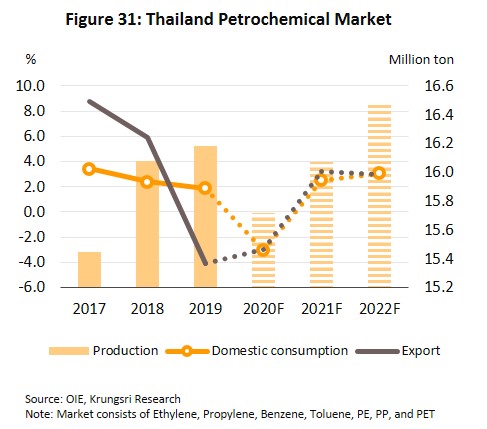
- Thailand’s economy is forecast to grow by 2.5% in 2021 and 2.8% in 2022, which would lift demand for petrochemicals in industries including packaging & plastics, construction materials and auto assembly.
- Greater investment to produce specialist downstream petrochemical products, led by rising interest in environmental-friendly products and government policy to reduce use of plastics.
- Government policy to promote investment in ‘super clusters’ in special economic zones and in ‘new S-curve’ industries in the Eastern Economic Corridor, where investors will qualify for tax exemptions and waiver of import duties on machinery when investing in environmental-friendly industries and/or those that use advanced chemical processes.
- Rising per capita plastic consumption in developing nations.
However, downstream producers of LDPE, PS, PP and PVC nurdles would see slower growth as the government steps up measures to reduce and eliminate the consumption of single-use plastics by 2022.
Krungsri Research projects domestic consumption of petrochemicals would drop by 3.0% in 2020, but grow by an average of 2.0-3.0% p.a. in the following two years, while exports would grow by an annual average rate of 1.1% (Figure 31).
At the same time, players will be exposed to several risks in the coming period that could rein in growth in the Thai petrochemicals sector. (i) There is lingering uncertainty in the direction of the US-China trade conflict. Rising tension could hold back the global economic recovery, which would hurt Thailand’s economic growth and demand for petrochemical products, especially from China, Thailand’s principal export market. (ii) Fluctuations in oil prices would lead to volatile petrochemical prices. (iii) There are plans to increase production capacity for some petrochemical products, especially PX and Benzene, largely in China, Vietnam, and the Middle East. This would cap prices of these products, despite stronger demand, and Thai producers will see weaker demand for their goods.
Changing industry and global business dynamics also pose challenges to players in the petrochemicals sector. How they respond to these will determine their future positioning in the market. Industry players are increasingly reliant on the use of new technology to add value to their processes and to support downstream industrial consumers, especially in packaging, automobiles and electronics because these industries are evolving in response to the emergence of the circular economy. The latter would cause demand to shift from commodity-grade goods to a greater need for specialty products, and the petrochemical industry would be forced to change. Deloitte estimates that although over the next 15 years (from 2018), the global market for petrochemicals will grow by about 3.0% per year, demand for specialty petrochemical products will expand by 4.5% annually. There is rising external influence on the sector as a result of the shift from supply-driven consumption to demand-driven production, which is altering the nature of competition within the sector. In the past, competitiveness was built on the ability to source inputs and control costs, but now it is increasingly dependent on the player’s ability to produce a wide variety of products to meet market needs, to build relationships with businesses in other sectors, and to develop and exploit new technologies and processes. These will determine profitability in the coming period.
Krungsri Research view:
Between 2020 and 2022, steadily rising demand will help Thai operators to maintain turnover at satisfactory levels, but spreads would narrow. In addition, most Thai players have operations throughout the entire supply chain, from upstream to downstream, and also maintain a presence in related industries both in Thailand and overseas (especially in markets with strong demand growth such as China, Indonesia, and the CLMV region). This would help to streamline production planning.
However, despite the positive outlook, Thai players are exposed to risk of limited feedstock because the natural gas reserves in the Gulf of Thailand are almost exhausted. Operators could face problems with securing consistent access to inputs and, if they resort to imports, they may have to pay higher costs for both natural gas and crude oil. This could weaken margins.
Another factor that could limit the growth of the sector is government policies in major export markets, especially China, Indonesia and Vietnam which are increasingly moving towards self-reliance in petrochemical production. This means Thai producers would need to adjust their business strategies and switch to a policy of engaging in joint partnerships with existing players in markets such as Indonesia which is seeing solid growth in demand for plastics and benefits from easy access to raw material. In addition, to reduce exposure to price competition, producers will also benefit from moving out of the commodity-grade market and up the value chain by producing more specialized products.
Over the medium- to long-term, some Thai producers may switch to producing environmental-friendly bio-plastics because Thailand has abundant biomass resource such as cassava, palm and sugarcane which can potentially be used as alternative feedstock. These high added-value products are currently in vogue because of the perception that they would reduce environmental problems. Another advantage is that the Thai government is promoting investment in this area by offering targeted tax breaks.


.webp.aspx)