In the period 2019-2021, the domestic market for beverages (which takes some 90% of all output by the sector) is expected to see low levels of growth even as the Thai economy expands. The most important market segments of carbonated drinks, energy drinks, beer and spirits are now becoming saturated, while the government is also introducing measures that aim to cut consumption of potentially harmful products, including alcoholic drinks and those with a high sugar content. Beyond this, purchasing power in the lower end of the market remains soft and this weakness continues to weigh on the market.
In terms of exports (approximately 10% of the market), these will gradually improve as Thai producers steadily penetrate important target markets overseas, such as those in Vietnam and Myanmar. Thai drinks producers will be able to generate additional income from establishing production facilities overseas but at the same time, this will reduce the contribution to company balance sheets of exports of Thai-based production.
Overview
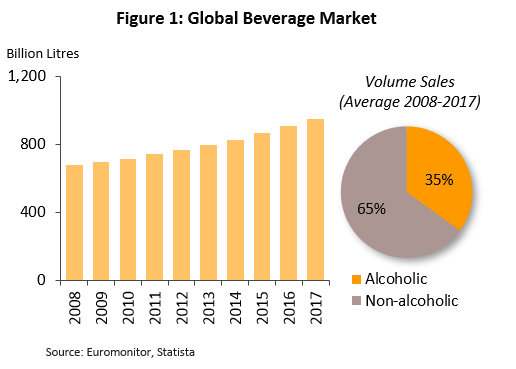
Globally, beverages form a significant world industry with continuing growth (Figure 1) and in 2017, the sector had a combined value of around USD 2.15 trn and 950 bn liters of drinks in consumption. The sector has seen steady expansion and between 2008 and 2017, growth in consumption averaged an annual figure of 3.8%.
The world market is split into two major segments. (i) In terms of the volume of annual consumption, non-alcoholic (or soft) drinks account for around 65% of the market and these come in a wide range of forms, including bottled water, carbonated drink, soda, energy drinks, sports or electrolyte drinks, fruit juices, ready-to-drink tea and coffee, etc. (ii) The remaining 35% of consumption comprises alcoholic drinks such as beer, wine and spirits. The markets for these two major segments are described in more detail below (Figure 2).
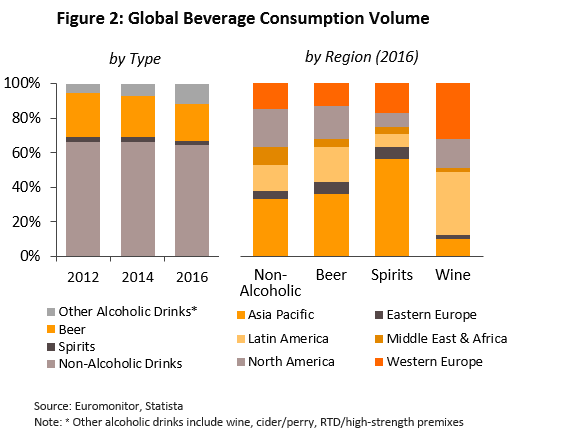
- Non-alcoholic drinks: These are distributed in large volumes but sales are concentrated in areas of high population density. The Asia-Pacific region (where around 60% of the world population lives) consumes 33% of global non-alcoholic drinks consumption and is followed in importance by the most urbanized parts of the world, that is, North America, Western Europe and Latin America, which take 22%, 15% and 15% of world consumption, respectively.
- Alcoholic drinks: Those that are distributed in the greatest quantity include beer, spirits and wine.
- Beer: The Asia-Pacific region is the most important market for beer sales, taking 36% of global beer consumption. This is followed by Latin America, North America and Western Europe, each of which has respectively a 20%, 19% and 13% market share by volume.
- Spirits: Asia-Pacific and Western Europe is the most important region, consuming 56% of global spirit consumption. This is followed by Western Europe, with 17% of global spirit consumption.
- Wine: In this case, the two biggest markets are Latin America and Western Europe, which have a market share of 36% and 32% by wine consumption volume, respectively.
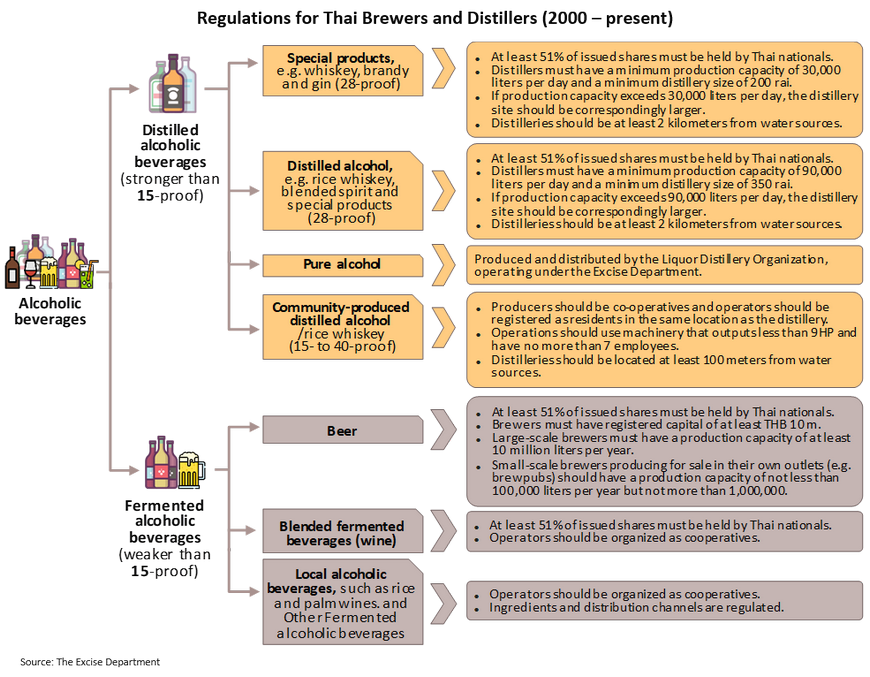
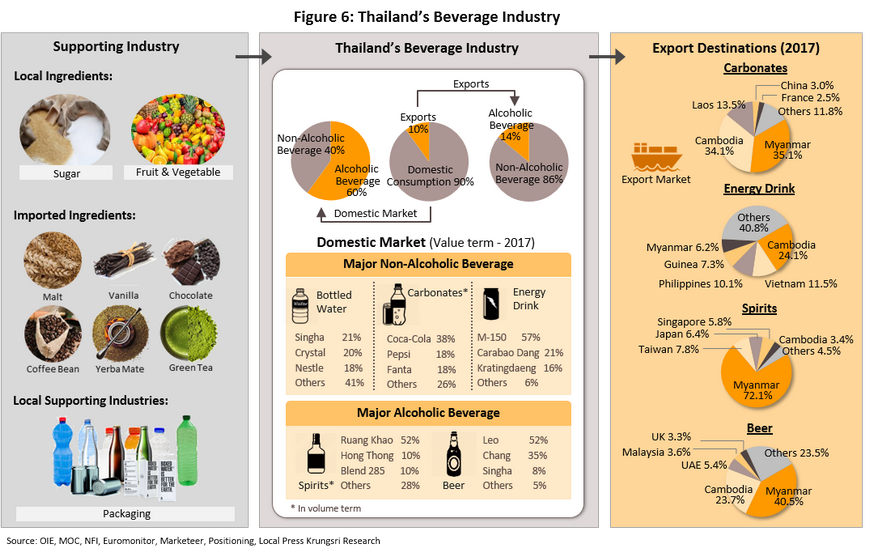
The domestic Thai beverage industry outputs a comprehensive range of product lines, both in terms of production and consumption. The industry is also closely tied to related sectors, such as the upstream production of raw materials (especially of sugar) and packaging, and as such production of a wide range of drinks is possible and domestic consumer demand can largely be met; imports of drinks are mostly restricted to expensive goods at the top end of the market, such as whiskey and wine. Thailand is also able to export its domestically-produced drinks, with around 10% of total drinks production. In 2017, a total of 775 sites producing beverages were registered with the Department of Industrial Works and these were split between (i) 680 sites (88% of the total) producing non-alcoholic drinks, and of which 60% were SMEs and (ii) 95 sites producing alcoholic drinks (12% of the total). 49% of these were large-scale operations producing spirits (classified as 28-degree proof) and beers under the market-leading brands. The remainder were small- and mid-sized operations outputting white spirit, local types of spirits and wines because factories producing these latter types of alcoholic drink are less tightly regulated by the authorities (see the illustration on page 3, ‘Regulations Governing Thai Brewers and Distillers’).
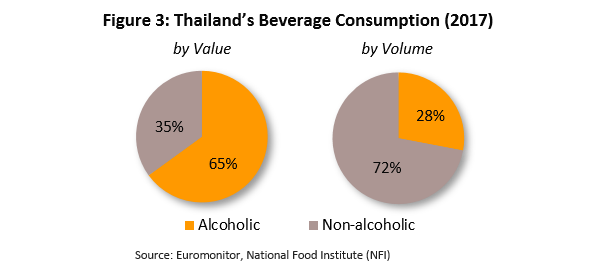
In 2017, the domestic market for beverages was worth THB 570 bn and consumed 7,477 million liters of drinks. The latter was divided between the non-alcoholic and alcoholic segments in the ratio 72:28 but by value, the relative importance of the two segments flipped to a ratio of 35:65. Details are as follows (figures 3-5).
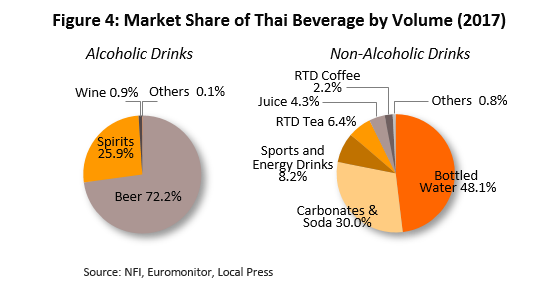
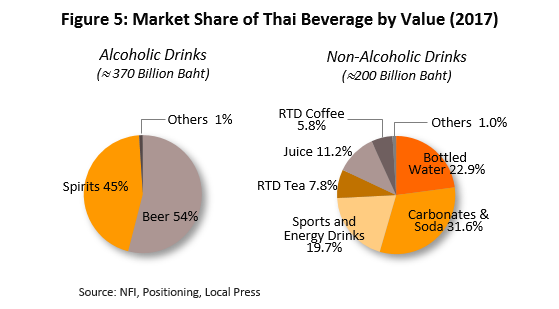
- Non-alcoholic drinks. The most important of these was bottled water, with a 48.1% share of the soft drinks market by volume and 22.9% by value. Carbonated drinks had a 30.0% and 31.6% share by volume and value, while energy drinks were the third most important product category, with an 8.2% (by volume) and 19.7% (by value) share.
- Alcoholic drinks. Here, beer was by far the most important product, having a 72.2% market share by volume, followed by spirits (25.9%). In terms of value, beer remains the most important, though with the reduced share of 54.0%, followed again by spirits (45.0%).
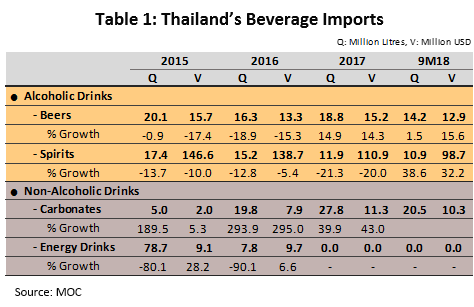
The overwhelming majority of exports of drinks (86% by value) are of non-alcoholic varieties, where Thailand’s main expertise lies in energy and carbonated drinks. The ASEAN zone comprises the most important export target (with about 60% by value of exports of Thai non-alcoholic drinks), followed by the United States (14%). Alcoholic products account for only 14% of the value of exports, though again, the ASEAN zone is the main market for these, with the region purchasing 82% of exports of Thai alcoholic drinks by value. Japan (5%) and Taiwan (3%) sit in distant second and third places.
The development and structure of the Thai beverage industry
The Thai beverage industry began life with the government production of alcoholic drinks as part of its import-substitution strategy. Following this start, the government then increasingly opened the way to private-sector investment, using continuing BOI incentives to stimulate the sector and since these beginnings, the Thai drinks industry has matured to the point that it now produces a wide range of alcoholic and non-alcoholic products. The development of particular market segments within the industry is given below.
The production of alcoholic drinks began in Thailand with the fermentation of locally-produced beverages (made from fermented rice or sugar). In the first stages of the sector’s development (from 1927), the state held a monopoly on the production and distribution of alcohol, which was based at the Bang Yee Kan factory in Pathum Thani (operating under the Excise Department). Here, ‘white spirits’ were used to produce other products, such as blended spirits, which were then flavored, infused and colored to make stronger drinks, and other types of special drinks. However, from 1959, the government permitted the private sector to move into the production of alcoholic beverages by allowing companies to bid for the rights to run the Bang Yee Kan factory. This policy ran until 1999, when, at the start of the new millennium, the industry was turned around by a liberalization of the markets for production and distribution. Subsequent to this, a large number of new breweries and distilleries were established, as were joint ventures between Thai and foreign companies to produce beer for the Thai market.
Despite this, though, the market for alcoholic drinks remains dominated in Thailand by a few players. Partly this is because of the nature of the production process, which is capital intensive and requires the use of high technology, but in addition to these obstacles, regulations put in place by the Thai authorities governing the requirements that have to be met by companies applying for a license to produce and distribute alcohol, together with the 2000 decree by the Ministry of Finance on breweries and distilleries, also place a considerable number of hurdles in the way of new entrants to the market (especially SMEs), particularly with regard to the beer and spirits segments.
The development and structure of the Thai beverage industry (continued)
- Beer: The domestic market for beer is dominated by the duopoly of Boon Rawd Brewery, producers of Singha, Leo and U Beer, and Thai Beverage (or ThaiBev), which produces Chang, Leo, Archa, and Federbrau. These corporations are both highly competitive organizations and enjoy significant advantages in terms of their capital base and distribution channels, with the result that the two have a 93% market share of the Thai beer market (by volume).
- Spirits: The production of spirits is tightly regulated by the authorities and this makes it difficult for new players to compete in the market. Because of this, ThaiBev has been able to maintain a commanding position and has an over 80% market share, a position that reinforces its considerable financial strength, its production efficiencies, and its power to release new product lines that cover all segments of the market. The company operates 18 sites that produce alcoholic drinks as well as owning additional companies to import further product lines into Thailand, and at present, there are over 30 of these, all meeting different demands from the company’s customer base. Brands selling ‘white spirits’ include Ruang Khao, Phai Thong, Niyom Thai, Sua Khao, Mee Khao, Mungkorn Taijeen, Chaiya, Chao Praya, Phraya Nak, Phaya Seur and Bangyikhan. ‘Colored spirits’, also called ‘brown spirits’ include Maekhong, Hong Thong, Mangkorn Thong, Sang Som, Blend and Crown 99, while ‘mixed spirit’ brands include Sua Dum and Siang Chun.
Non-alcoholic drinks. Initially, this part of the industry was developed through the investments of foreign companies, such as the production of carbonated drinks by Coca Cola, which began investing in Thailand in 1949, and the American-owned Polaris water bottling plant, which started operating a year later. As the domestic market for non-alcoholic drinks developed, the Thai government began to take a more active role in supporting its development through, for example, the 1960 act on promoting investment in industry manufacturing for domestic consumption and the measures for stimulating export industries in the Third National Economic and Social Development Plan (1972-1976). These development strategies relied on Thailand exploiting its advantages in low labor costs and ready access to the agricultural products used as raw materials in beverage production (e.g. fruit and vegetable juices) and as a consequence of this, there was a significant uptick in investment in these industries by both Thai and overseas players, which in turn resulted in production better meeting consumer demand in domestic and export markets.
The market for non-alcoholic drinks is now very varied in Thailand, with a large number of products and producers in the mix. Because of this, the structure of individual segments within the market varies. The major types of non-alcoholic drinks are as follows:
- Bottled water: This industry requires high initial levels of capital but the continuing development of machinery and technology to filter water means that this can now be done to a very high standard at low unit costs and as such, the number of new entrants to the market is increasing. That said, though, some 60% of the market is controlled by large operators that enjoy economies of scale (some of these benefit from bottling water under contract to other parties, including hotels and hospitals) and which also produce other beverages, including carbonated drinks, fruit juices, beer and spirits, thus giving them advantages in terms of marketing and distribution. The most important Thai producers of bottled water are currently Singha Corporation (selling under the Singha brand), Sermsuk (Crystal brand), Nestlé Thai (Nestlé brand) and Coca Cola Thailand (Namthip brand). These brands are distributed through retailers, modern trade outlets, restaurants, and online and through direct sales to home and office purchasers. In addition to these, local brands also serve immediate, local markets, and there are more than 100 of these upcountry selling to restaurants and street food stalls.
- Carbonated drinks: This market has the features of an oligopoly because new players have to invest significant capital reserves in the purchase of machinery, a fixed cost, that they will then hope to recuperate by producing in large enough quantities to generate economies of scale, and because they usually have to import ingredients from a parent company. Important operators in this market include Coca Cola Thailand (selling Coke, Fanta, Sprite, Schweppes, and A&W Root Beer), Pepsi Cola Thailand (selling Pepsi, Mirinda and 7 Up), Sermsuk (EST Cola), RJ Group (Big Cola) and Sakol Beverage Company (RC Cola).
- Energy drinks: This market is also somewhat oligopolistic in nature because, as with bottled water, producers need to generate economies of scale by outputting in bulk. In the case of energy drinks, this is to enable them to price their goods cheaply and so successfully reach the domestic market, which in Thailand is overwhelmingly blue collar in composition; this in contrast to the market for energy drinks in areas such as the United States, Europe, Japan and South Korea, where the market also extends to white collar workers and students, in addition to manual laborers. Marketing strategies that emphasize developing many brands as a way of preserving market share also work as barriers to entry against new players and so at present, there are three market leaders: Osotspa (operating under the brands M-150, Lipo and Shark),TC Pharmaceuticals (Red Bull and Ready) and Carabao Group (Carabao Dang).
Situation
The major segments of the Thai beverage market are bottled water, carbonated drinks, energy drinks, beer and spirits, and these together account for 87% of the industry’s value; between 2012 and 9M18, the non-alcoholic drinks portion of this saw solid growth, with sales lifted by rising rates of urbanization, changes in consumer lifestyle and higher rates of eating out. Factors that influence the development of these different market segments follow.
Bottled water: Greater rates of growth than other segments
-
In the five-year period from 2012 to 2017, the index of production for bottled water grew by an average of 9.7% per year, while the index of distribution grew at the even faster annual average rate of 10.3%. This growth was supported by changing consumer behavior and a growing concern with health and wellness, which in turn is driving increased demand for clean, high-quality water. In addition, the exceptionally hot weather caused by the El Niño that ran from 2015 to the first half of 2017 also helped to lift demand.
- However, in 2017 the market for bottled water slowed and growth in the index of distribution halved in value to 3.7% YoY from the 7.4% YoY growth that was recorded a year earlier. This shift in the market was triggered by a weakening of consumer spending power and in response to this, water bottlers cut back on production and instead tried to run down existing stock, a move reflected in the 6.0% YoY decline in the index of production. In 9M18, these problems began to resolve themselves as improving economic conditions again boosted consumer spending and the indices of production and distribution of bottled water returned to growth of 4.0% YoY and 10.7% YoY respectively. Given this, growth in demand for bottled water is expected to have run to 8-10% YoY in 2018.
- Share of the bottled water market, 2017: The entire bottled water market is worth THB 43 bn annually and is shared between Singha, with 21% share, Crystal (20%), Nestlé (18%) and Namthip (9%) (Source: Singha Corporation).
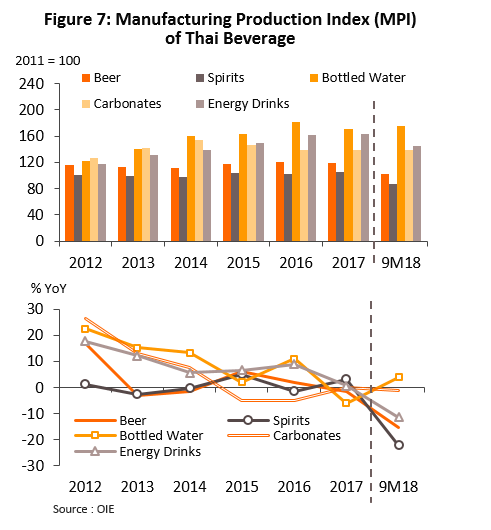
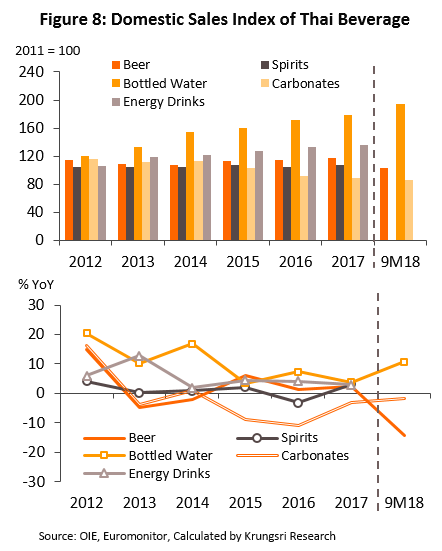
Carbonated drinks: In 2017, at 41.13 liters/person/year, Thai per capita consumption of carbonated drinks was the highest in the ASEAN zone, but for many years domestic demand for these drinks has been weakening. Thus, in the period 2012-2017, the index of production grew by an average of 6.2% per year while the index of distribution shrank by an annual average of 1.6%. This change is explained by shifting concerns with health and by growing competition from functional carbonated drinks[1] and from sparkling drinks[2], which over the past 1-2 years have become increasingly popular with consumers who take an interest in their health. In addition to this, a number of events have also disrupted the market.
- In 2012-2013, temporary supply shortages drove a fall in consumption. At this time, Sermsuk terminated its contract with PepsiCo to produce cola under the Pepsi brand, with the company instead launching its own brand of cola, EST Cola. PepsiCo responded by investing in its own production facilities but it took around a year to build the new factory and to bring the new supply of Pepsi to the market.
- In 2016, the market weakened on a general softening of consumer spending caused by worsening economic conditions. This affected consumer confidence and tended to cause consumers to hold back on spending, especially on non-essential goods such as carbonated drinks.
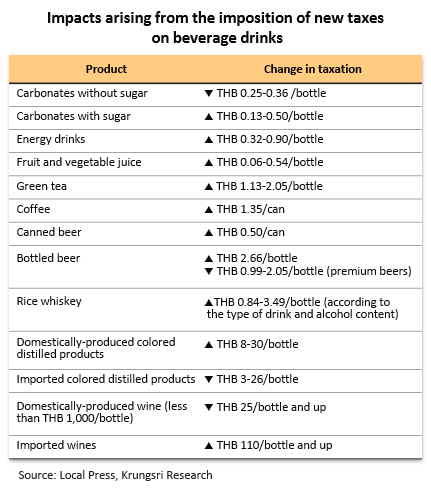
- In 2017, consumption of carbonated drinks continued to fall, and the index of distribution shrank by 3.2% YoY. This time, the decline was caused by government policy and a change in the basis on which excise duties are collected (see Box A on page 7 for details); under new regulations, tax is due on drinks on the basis of their sugar content and because of this, sales prices for drinks were raised, though this was clearly especially serious for carbonated drinks, which typically have a high sugar content (taxes added THB 0.13-0.50 per bottle). In response to this, producers adjusted their production processes to reduce carbonated drinks’ sugar content and to use non-sugar sweeteners instead (with an accompanying cut in tax of THB 0.25-0.36 per bottle). Thus, in 9M18, demand for carbonated drinks continued to slide but at a slowing rate and so the index of distribution shrank by 1.2% YoY. At the same time, the market was boosted by an improvement in the domestic economy that lifted consumer spending, while it was also pulled in the other direction by social trends that emphasize personal health and so tend to reduce demand for carbonated drinks[3]. Overall, domestic demand is expected to have contracted by 0% to -2% YoY in 2018.
- 2017 market share for carbonated drinks: The market leader is Coca Cola Thailand, with a very healthy 62.4% share by volume of all carbonated drinks distributed to the domestic market. Coca Cola is followed by PepsiCo Thailand (21%), RJ Group (8.6%), Sermsuk (7%) and a number of other companies (1%). In terms of individual products, Coke is the leader, with 38.1% share (by volume), followed by Pepsi (17.7%), Fanta (17.6%) and EST (6.9%) (source: Euromonitor). In terms of particular types of drinks, the cola market is led by Coke, with a 52% share at a value of THB 35 bn, and is followed by Pepsi (30%) and EST (10%) (source: Marketeer). For other types of colored carbonated drinks, Fanta is the market leader (a 50% share and a value of THB 15 bn), followed by Sprite (20%), EST Play (11.4%) and Mirinda (6%) (source: Positioning).
Energy drinks: Growth in the market has followed income growth for the main customer base of laborers and agricultural workers, a group whose spending is sensitive to changes in economic circumstances.
- Between 2012 and 2017, the spending power of the target customer groups saw only weak growth and so the indices of production and distribution of energy drinks rose by a respective average of 8.7% and 5.4% per year. During this period, while agricultural workers suffered from a combination of low prices for agricultural goods and poor yields as a consequence of sharp changes in the climate, manual laborers also missed out on the results of economic growth and so had to take greater care with their spending.
- For the first 9 months of 2018, demand for energy drinks continued to grow, though not at a high rate. The market was aided by: (i) increases to the national minimum wage4/ (ii) government measures providing financial support to low-income earners and manual laborers, a group that at least partly overlaps with the core market for energy drinks5/; (iii) farm incomes improved on better yields, these driven by an improvement in the climate, and higher prices for some goods (e.g. jasmine rice, cassava, and corn); and (iiii) producers of energy drinks maintained sales volume by holding the retail price of their goods stable, even as extra taxes added THB 0.32-0.90 to each bottle sold. The result of this is that total sales of energy drinks are expected to have grown by 0-2% YoY in 2018.
- 2017 market share for energy drinks: In terms of volume, Osotspa holds a 50% market share of the domestic market for energy drinks, followed by Carabao Group (29.4%), TC Pharmaceuticals (17.5%) and ThaiBev (1.3%) (source: Euromonitor). Considered in terms of individual brands, M-150 is the market leader, with a value of THB 35 bn and a market share of 57.0%, with Carabao Dang in second place (21.0%) and Red Bull in third place (16.0%) (source: Positioning).
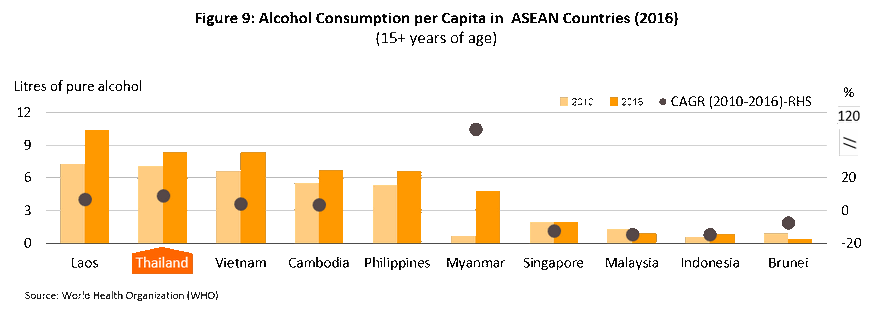
Alcoholic drinks. Although per capita consumption of alcohol in Thailand is the highest in the ASEAN zone, average rates of growth in the market are relatively low (Figure 9). The situation is described in detail below.
- In 2013 and 2014, the market for alcoholic drinks was affected by worsening economic conditions and by a review of the excise duties levied on beer and spirits that came into effect on September 4, 2013. This review overhauled the basis for calculating taxes in two ways. (i) Excise duties were no longer to be levied on the basis of factory-gate or CIF prices but instead on the final wholesale price, excluding any sales taxes and (ii) tax was henceforth to be calculated on the basis of the value of the drink and its alcohol content in the ratio 80:20 (this is in place of the earlier method, which was based on either the sales price or the alcohol content, whichever would yield a higher tax revenue). The result of these changes was to raise prices for alcoholic drinks, especially for beer and imported spirits (increases in excise duties ran to 20-25% for imported beer and spirits, 10-15% for domestically produced beer, 10% for domestically produced white spirits and 25% for other domestically produced colored spirits). The outcome of this was that in 2014, demand for beer shrank while demand for spirits grew only slightly (the index of beer distribution fell by 2.2% YoY, while that for spirits grew 0.8% YoY).
Box A: Changes to taxation in the drinks industry, 2017
Adjustments to excise duties following the 2017 Excise Tax Act were enforced from September 16, 2017 and had important consequences for the collection of taxes in the beverages sector.
- The review of the basis for calculating duties from factory-gate prices (for domestically-produced drinks) or CIF prices (for imported drinks) to one based on the recommended retail price, less any sales taxes, had more significant consequences for Thai-made alcoholic drinks than for imported ones and this has then led to the former carrying a heavier tax burden.
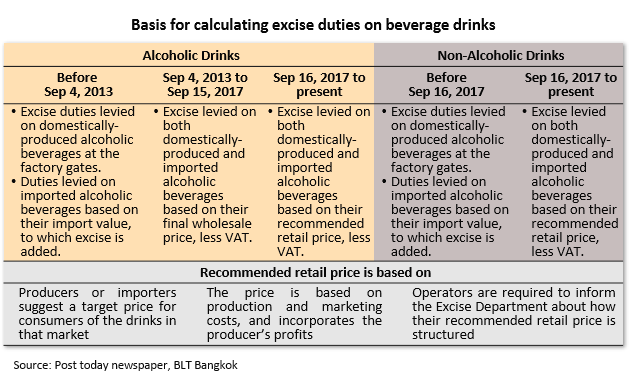
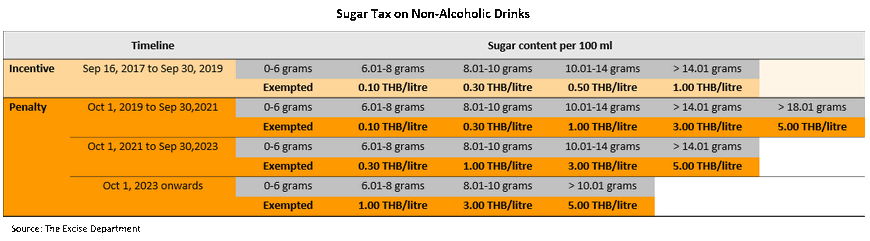
- The collection of taxes on drinks according to their sugar content has brought about changes to the sector in two ways. (i) Tax has been imposed on soft drinks according to their sweetness, as well as on the sugar content of powdered and concentrated drinks, in order to increase public awareness of the impact of the consumption of sugar-laden drinks on health. Initially, the tax rates have been set at a relatively low level but these will be ratcheted up every two years until 2023. (ii) Tea and coffee have been removed from the list of drinks that are tax-exempt (because they promoted the use of agricultural products and are beneficial to health) and so taxes on these goods have also risen.
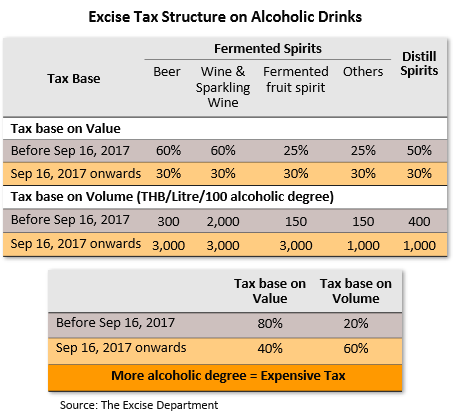
- Duties on alcoholic drinks retain their mixed nature so these are still based on both price (to reflect the extent to which a product is a luxury) and alcohol content (to reflect its potential to damage health) but the balance between the two has shifted. Thus, the value component has fallen from 80% to 40% and the alcohol-content component has increased from 20% to 60%, a mix that better reflects international norms.
- In 2015 and 2016, the market for alcoholic drinks saw only low levels of growth. In part, this was caused by increasing hesitancy in spending by mid- to lower-level consumer groups. Underpinning this was the effects of the very strong El Nino and the accompanying drought, which brought low yields for agricultural goods at a time when prices were also low. Beyond this, restrictions on marketing also played a part, and in 2015, a number of measures were put in place by officials to control alcohol consumption that negatively impacted the marketing efforts of brewers and distillers. These included: (i) tax measures that aimed at curbing the consumption of alcohol (excise duties have been used to subsidize the Sports Fund and the Elders Funds); (ii) controls on advertising and marketing communications for alcoholic drinks; (iii) government support for public awareness campaigns that aimed at changing consumption patterns; and (iv) changes to the times when alcohol can be sold6/ and by whom it can be bought7/. In the last quarter of 2016, the market was also affected by the government request for the temporary halting of the marketing of alcohol and entertainment activities during the period of mourning for the late king Rama IX. In the same period, the suppression of so-called ‘zero dollar tours’ run for Chinese tourists also cut the number of tourist arrivals, and with this, sales of alcohol (for 2016, the distribution index for beer fell by 3.2% YoY, while that for spirits rose by just 1.4% YoY).
- In 2017, the domestic market again saw only low levels of growth on a combination of changes to customs and excise, which caused an increase in retail prices for alcoholic drinks generally, though especially for products that have a higher alcohol content (see details in Box A on page 7), public campaigns to reduce alcohol consumption, and changing consumer behavior that pays greater attention to health and with this, increased consumption of lower-alcohol drinks, and some consumers turn to drinking wine instead.
- The beer market grew by 2.3% YoY in 2017. Growth in the ‘economy’ end of the beer market was relatively flat in the year, as increases in duties weighed on sales; prices rose by THB 0.5-2.66 per bottle or can (or by 1.3-6.8%) due to changes in taxation and because the main consumers are somewhat price sensitive, this held back sales. However, the premium beer market did much better, thanks partly to a cut in taxes of THB 0.9-2.0 per bottle or can (down by between 1.8% and 4.0%) and partly to the growing interest in craft beers8/. In 2017, the market remained for these small and was worth only some THB 300 m but growth is currently at the breakneck pace of over 40% YoY, compared to 6% YoY growth in the general market for beer, though craft beers are overwhelmingly imported9/. In the year, Boon Rawd Brewery was the market leader, with a 51.3% share by volume, followed by ThaiBev (42%) and Thai Asia Pacific Brewery (4.9%) (source: Euromonitor). In terms of brands, Leo is the market leader with a 52.0% market share and a value of THB 200 bn, followed by Chang (35.0%), Singha (8.0%), Heineken (3.2%) and Archa (1.0%) (source: ThaiBev).
- Sales of spirits grew 3.0% YoY in 2017. The market for local distilleries and white spirits (which account for 42% of all spirits distributed to the Thai market) saw tax-driven price rises of THB 0.84-3.50 per bottle (increases of 1.6-6.6%) but the impact of this on consumption was limited. The market for colored spirits fared worse in the year, as rises in excise duties hit this segment much more heavily. These came to THB 8-30 per bottle, which translated into price rises of 5.7-21% and as a result, consumers cut purchases and/or switched to buying other, cheaper types of alcohol, including white or locally-made spirits. The market share of players in the spirits segment, with an impressive 81% share by volume, was ThaiBev, followed by Diageo Moet Hennessy Thailand (0.8%), Agency Brandy (0.7%) and other, smaller players (17.5%). The leading brands were the locally distilled Ruang Khao (a 51.7% share by volume), the colored spirit Hong Thong (9.6%), the distilled colored spirit ‘Blend 285’ (9.5%), the locally distilled Phai Thong (2.8%), and the colored distilled Sang Som (2.4%) and Maekhong (2.0%). Other brands accounted for the remaining 21.9% of the market (source: Euromonitor).
- The first 9 months of 2018 witnessed a fall in the quantity of alcoholic drinks that were sold, which was partly driven by advance purchases that had been made in anticipation of increases in excise. Positive factors supporting consumption through the year included a generally improving outlook for the economy and the FIFA world cup, which ran through June and July and which stimulated sales in restaurants and bars. For the year as a whole, the expectation is that demand for beer will slide by 5% to 10% YoY, while that for spirits will fall at the lower rate of 2% to 4% YoY.
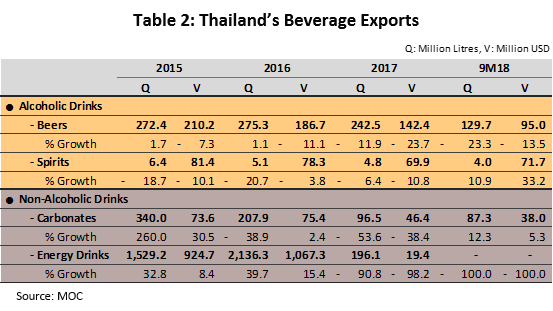
- Exports of beverages have declined over the past 2-3 years as producers (both Thai and overseas operators) have tended to establish their own production facilities in neighboring countries. The latter take around 75% of Thai exports and so are the main targets for Thai-based manufacturers, and as production has increased in these countries, exports have correspondingly declined. Major producers participating in these trends include Coca Cola, which has invested in Myanmar and Cambodia to produce Coke and its Burn energy drink, PepsiCo (invested in Myanmar and Vietnam to produce Pepsi and the Sting energy drink), Carlsberg (invested in Lao PDR), ThaiBev (Vietnam), and Osotspa (Myanmar). Competition with beverages produced in other countries is also tending to increase, and so for example, within the energy drinks market, in Cambodia, Thai producers are now competing with the South Korean Bacchus brand, while in Vietnam, competition is with the Vietnamese Number1 brand and the Philippine Red Dragon and Red Do brands.
Outlook
Overall, the beverage sector is expected to see growth in the period 2019-2021, but the rates of growth will likely be fairly low. Markets for the major product groups (carbonated drinks, energy drinks, beer and spirits, which together contribute 90% of sales) are reaching saturation as changing consumer trends increasingly value personal health, while the government is also trying to reduce consumption of drinks that are potentially damaging to human health (i.e. alcoholic drinks or those with a high sugar content). Exports (10% of the market) are also forecast to see only limited room for growth in the period. The decision by a large number of producers to reduce costs and to increase the efficiency of their marketing by shifting production directly to export markets will reduce the value of goods shipped from Thailand, though at the same time, it will increase the profits generated from overseas production facilities.
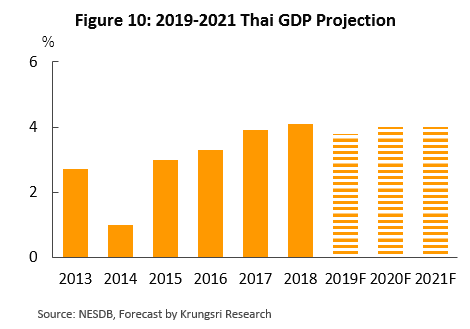
For non-alcoholic drinks, the outlook is generally positive and demand is forecast to rise steadily on an expanding economy (Figure 10) , increasing rates of urbanization, and hotter weather driven by the possible emergence of a new El Nino in the first half of 2019. However, different product lines will be affected by different factors, and these are outlined below.
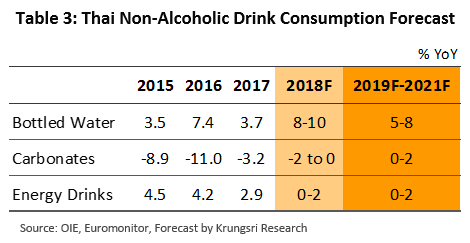
- Bottled water: From 2019 to 2021, the market for bottled water is forecast to see solid annual growth of 5-8% per year. Bottled water is an essential product, but it is also one that supports modern lifestyles and consumers increasingly value its purity. Given this, bottled water that meets widely accepted standards, such as ISO 9001 and HACCP, will make consumers feel more confident in the product, and this will then feed into an expansion of the market, both for sales of small bottles and for the larger tanks distributed to households and offices. However, the continuing entry of new players to the market means that competition remains stiff and so operators need to use a wide range of marketing strategies and to exploit as many distribution channels as they are able to, which in turn will raise their costs.
- Carbonated drinks: Consumption of carbonated drinks is expected to recover somewhat in the next three years (2019-2021) but average annual growth is forecast to be restricted to the range of 0-2%. This segment will benefit from two developments. (i) In 2018, PepsiCo and Suntory Beverage and Food (a Japanese food processor) established the joint venture Suntory PepsiCo Beverage Thailand10/ in order to distribute goods through the Deutsche Post DHL Group. At the same time, the new company put in place a network of sales agents across the country and it is hoped that these moves will help Pepsi place its goods in national retailers and so reduce the problems that the company has encountered with distributing its goods nationwide. (ii) The climate is expected to warm from 2019, and this will tend to lift demand. However, factors will also pull the market in the other direction, and the fact that carbonated drinks are regarded as something of a luxury item and have adverse effects on health may hold back sales. Competition from alternative products, such as functional drinks and ready-to-drink tea, is also expected to increase.
- Energy drinks: The forecast for sales of energy drinks over the next three years is for average annual growth of 0-2%. On the positive side, sales are likely to be supported by increasing income for the target market of lower income workers thanks to (i) the second round of government welfare payments, which has positive impacts on the spending power of low-income groups, and (ii) government moves to push through its spending, which is increasing the amount of money in circulation and helping to stimulate grassroots economic activity. On the other hand, however, negative factors will also work against the market, and these will include the possibility of lower farm incomes as a result of poor climatic conditions leading to harvest losses, while generally, the prices of agricultural goods remain low. Manufacturers are also exposed to the risk of competition from alternative products, such as ready-to-drink coffee and electrolyte drinks.
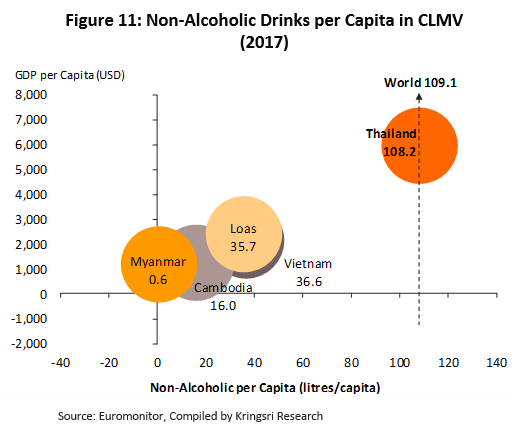
Exports of non-alcoholic drinks will tend steadily to decline as plans to establish or to expand production facilities in the ASEAN zone (home to the main export targets) by Thai producers are put into effect. Thus, Osotspa is in the process of building a facility in Myanmar between 2018 and 2019, the Carabao Group plans shortly to build an energy drinks factory in Vietnam and to increase production capacity in Myanmar, Malaysia and the Philippines, Coca Cola plans between 2017 and 2020 to expand its production capacity in Malaysia and the Philippines, and between 2018 and 2022 TC Pharmaceuticals plans to invest THB 50 bn in building and expanding factories making energy drinks in Europe and the ASEAN zone. Producers of soft drinks will therefore begin to generate income from these overseas sites and this will replace their current exports. Sales of soft drinks within the CLMV zone are still relatively low (Figure 11), while incomes are rising, populations are becoming increasingly urbanized, and Thai soft drinks tend to be favored by consumers in these countries, all of which points to significant opportunities for Thai producers to build markets in the CLMV region.
The alcoholic drinks part of the industry will follow a similar trajectory through 2019-2021, returning to growth but with the extent of this growth somewhat limited (Table 4). Government controls on marketing and advertising, the establishment of alcohol-free zones, and public awareness campaigns that aim to reduce alcohol consumption will all tend to restrain any expansion of the market, while continuing low levels of income in the agricultural sector will hold back growth in the lower-end of the market.
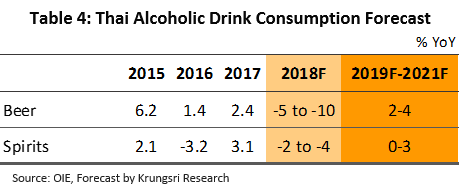
- Beer: It is forecast that domestic demand for beer will return to growth of an average of 2-4% per year in 2019-2021. The segment will be helped by an improving economic outlook and by marketing drives undertaken during major sporting events, which help to boost sales in restaurants and pubs, bars and other entertainment sites. Craft beers in particular are becoming increasingly popular and large Thai breweries have responded to this growing consumer demand by beginning to brew craft beers of their own in-country[11]. Beyond this, breweries are also introducing new product lines to reduce both the alcohol content and the serving sizes as a response to the changes in tax described above and so keep retail prices low, moves that should have a stimulus effect on the market. At the same time, some consumers are showing a greater interest in their personal health and this will mean that low- or no-alcohol beers[12], a new segment of the market that is becoming more prominent worldwide, will take on greater importance and may steal market share from traditional beers.
- Spirits: Consumption of spirits is forecast to rise by 0-3% per year over the next three years. The increase in price that has been caused by higher duties may restrict growth in sales to lower income groups, such as agricultural and construction workers. Distillers plan to meet this challenge by introducing new premium lines[13] and this may help to stimulate sales at the upper end of the market.
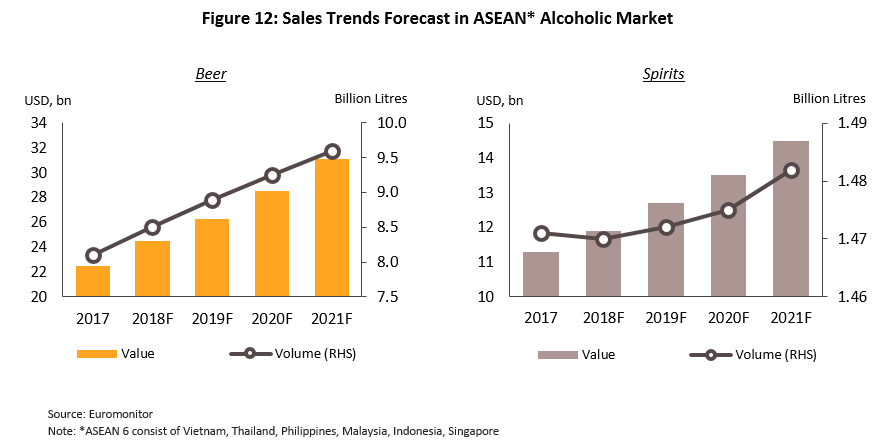
There is the possibility of a recovery in exports of alcoholic drinks. Consumption of alcohol is increasing in the ASEAN zone (Figure 12), an area that is responsible for over 80% of the value of exports of Thai alcoholic beverages, and that is thus Thailand’s main export target. Thai brewers and distillers are also releasing new product lines to stimulate export markets, as well as expanding their distribution networks across ASEAN countries. ThaiBev has therefore entered into a joint venture with Asia Euro Wines and Spirits, a major distributor of drinks that operates a distribution network that extends across China, Singapore, and Malaysia. However, competition within the ASEAN market is stiff due to the high market share of local players, and Thai operators looking to enter these markets will therefore need to invest substantially in the costs involved in building their customer base and in selling their products packaged with locally made ones, a strategy that players favor as a way of capturing market share. Examples of moves by Thai companies to join with other operators in the ASEAN market include (i) ThaiBev’s joint venture with Saigon Beer Alcohol Beverage Joint Stock Corporation (Sabeco), Vietnam’s biggest brewery (as of 2017), and (ii) ThaiBev’s joining with Myanmar Supply Chain and Service Company (MSC) and Myanmar Distillery Company (MDC), Myanmar’s biggest distillery, under the Grand Royal brand. These moves by Thai producers of alcoholic drinks to penetrate markets in neighboring countries should help to increase earnings.
Krungsri Research view:
Overall, turnover for players in the beverages sector will increase slightly in the period 2019-2021, as both domestic and export markets will see only limited growth. At the same time, increases to excise duties and taxes will tend to increase costs for producers and so erode profitability.
- Producers of bottled water: Turnover for players in this segment is expected to improve on domestic demand growth, but competition will likewise increase from operators new to the market. Marketing activities, extra advertising, increased public relations, and expanding the number and range of distribution channels will all add to business costs, and this may have an impact on profitability within the segment.Producers of carbonated drinks: The domestic market should see some growth, and this will lift turnover for operators, while extra income from overseas production facilities will help to offset income lost from the anticipated decline in exports. However, the increasing tax burden on high-sugar drinks, the rising costs of marketing activities necessary to stimulate the somewhat depressed market, and the growing competition from alternative types of soft drinks may eat into profits.
- Producers of energy drinks: Exports of Thai-based production are expected to decline in importance but this will be offset by increasing investment in markets overseas, where the large working-age populations will support an increase in operators’ turnover. The domestic market is, though, reaching saturation and profitability may come under threat as a result of rising costs, which are being pushed up by the sweetness tax and the requirement for higher expenditure on marketing to deal with the challenge of greater competition, both from brands in the same market and from alternative product groups.
- Breweries: Turnover for breweries will increase in step with changes in the domestic market, though it is not expected to rise greatly, while growth in income from exports will also be limited by growing competition, especially from beer brewed in export markets themselves. Profit rates are expected to narrow slightly but although higher duties will have a negative impact on business, the strengthening Thai baht will help to reduce the costs of importing raw materials.
- Distilleries: Slow growth in the domestic market will tend to hold back income growth for distilleries, while income from the export of spirits produced in Thailand will tend to weaken as this is replaced by sales from distilleries that have now been established overseas. In addition, operators will also feel the pressure arising from, on the one hand, rising excise duties and on the other, a market where it is difficult to pass on these costs to the consumer, since the latter typically have only weak spending power and are generally rather price sensitive. This will then likely have negative consequences for profit rates.
1] Functional drinks are non-alcoholic drinks to which some kind of supplementation has been added in order to make the drink healthier. These might include vitamins, herbs, or fruits and vegetables.
[2] Sparkling drinks are fizzy soft beverages that contain dissolved carbon dioxide and which usually have additional flavorings or scents, or added vitamins.
[3] From the publication by the Food Intelligence Center at the National Food Institute “Consumers tending to increase consumption of health drinks”.
[4] Increases in the national minimum wage were announced with effect from January 1, 2018, These averaged THB 15.97 per day, to give new daily rates of THB 308-330. The minimum wage is now at 7 different bands and the exact rate is set on a province by province basis, depending on the economy and costs of living of each.
[5] The government welfare system provides benefits to 11.57 million people and has the goal of assisting with the costs of living for low-income earners.
[6] In line with an announcement in the Government Gazette, sales of alcohol prescribed in the 2008 Alcoholic Beverage Control Act were restricted to the two periods of 11.00-14.00 and 17.00-24.00. This is with the exception of sales in international airports and designated entertainment zones, for which separate regulations exist. These new laws came into effect on 23 January, 2015.
[7]Article 29 of the 2008 Alcoholic Beverage Control Act specifies that alcohol may only be sold to individuals aged 20 years or older.
[8] Craft beer is beer that has a particular, unique quality, whether that is in terms of its taste or its aroma. The American Craft Beer Association divides craft beer breweries into has the following characteristics. (i) Small producers are those with an output of not more than 6 million barrels per year (approximately 700 million liters per year). (ii) Independent producers are those where the operator owns at least 75% of the shares in the business. (iii) Traditional producers are those that employ traditional brewing techniques.
[9] Craft beer is usually produced in volumes too small to meet the minimum required to obtain a brewer’s permit in Thailand and so it has to be sourced abroad, often in Cambodia, Lao PDR and Myanmar (where thanks to the AFTA, producers benefit from 0% tax rates). These products are therefore imported to Thailand for distribution as well as being marketed in other countries in the region.
[10] Suntory PepsiCo Beverage Thailand (SPBT) was established to expand sales of non-alcoholic drinks in Thailand in the standard categories of carbonated drinks, bottled water, electrolyte drinks, ready-to-drink tea and coffee, and fruit juices
[11] At the end of 2017, Boon Rawd Brewery released a new beer, the Snowy Weizen by EST.33 craft beer. As its name suggests, this is a wheat beer and it was followed in June 2018 by the release of EST.33 Copper Craft Beer, a beer made from Thai GABA rice. There are now over 50 Thai and foreign craft beers in the market.
[12] Alcohol-free beer is beer that is less than 0.5-degree proof, and it is simply beer that is brewed in the normal way but which after fermentation has the alcohol removed in a process that preserves the flavor, smell and color of the beer. In Thailand, the market for alcohol-free beer is small and specialist and since as yet no Thai breweries produce their own alcohol-free beer, sales are of imported products. However, in Europe and the United States, it is becoming increasingly popular due to health consciousness, global sales growing by an average of 5% per year between 2010 and 2015. Prominent brands include Heineken 0.0, Asahi Style Free and Carlsberg 0.0%.
[13] ThaiBev, a major producer of alcoholic drinks in Thailand, plans to introduce its new premium brand white spirit, Ruang Khao Silver. This is targeted both at the domestic market and at exports to the ASEAN zone and northern Asia and should come on sale at the end of 2018.


.webp.aspx)